Probabilities Module - The Quant Science This module can be integrate in your code strategy or indicator and will help you to calculate the percentage probability on specific event inside your strategy. The main goal is improve and simplify the workflow if you are trying to build a quantitative strategy or indicator based on statistics or reinforcement model.
Logic
The script made a simulation inside your code based on a single event. For single event mean a trading logic composed by three different objects: entry, take profit, stop loss.
The script scrape in the past through a look back function and return the positive percentage probability about the positive event inside the data sample. In this way you are able to understand and calculate how many time (in percentage term) the conditions inside the single event are positive, helping to create your statistical edge.
You can adjust the look back period in you user interface.
How can set up the module for your use case
At the top of the script you can find:
1. entry_condition : replace the default condition with your specific entry condition.
2. TPcondition_exit : replace the default condition with your specific take profit condition.
3. SLcondition_exit : replace the default condition with your specific stop loss condition.
Quantitative

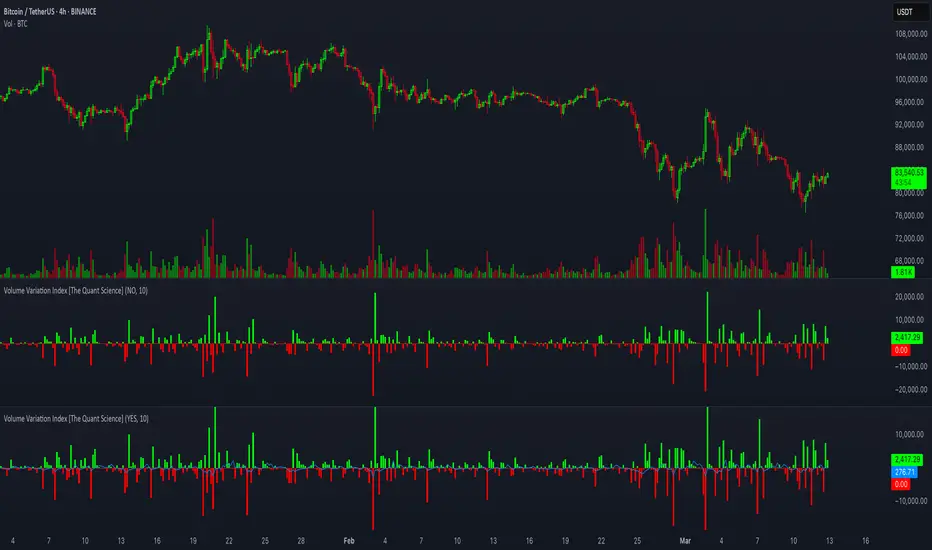
Volume Variation Index IndicatorThis tool is a quantitative tip for analysts who study volumes or create volume based trading strategies.
Like all our projects, we start with a statistical logic to which we add coding logic.
This indicator can save a huge amount of time in calculating the variation of volume between sessions .
How it work
The indicator calculates the difference between the volume of the last closing bar and the volume of the previous closing bar. It shows the difference between the trading volumes.
The session in which the trading volume is up are represented in green.
Red session represent trading volume down.
We have added a third function.
Through the User Interface the trader can activate or deactivate the variation average.
The indicator is able to calculate the average of the volume changes by representing it with a blue line.
To activate the average, simply set it to ON in the User Interface.
By default, the indicator calculates the average of the last 10 periods, but you are free to set this parameter in the User Interface.
Data access
To access the data, simply move the cursor. When you move the cursor over the green bars, the increase data will be displayed in green. By hovering the cursor over the red bars you will see the decrease data in red. By hovering the cursor over the average will show you the average data in blue.
The data is displayed in the top left corner of the indicator dashboard.
If you found this indicator helpful, please like our script.
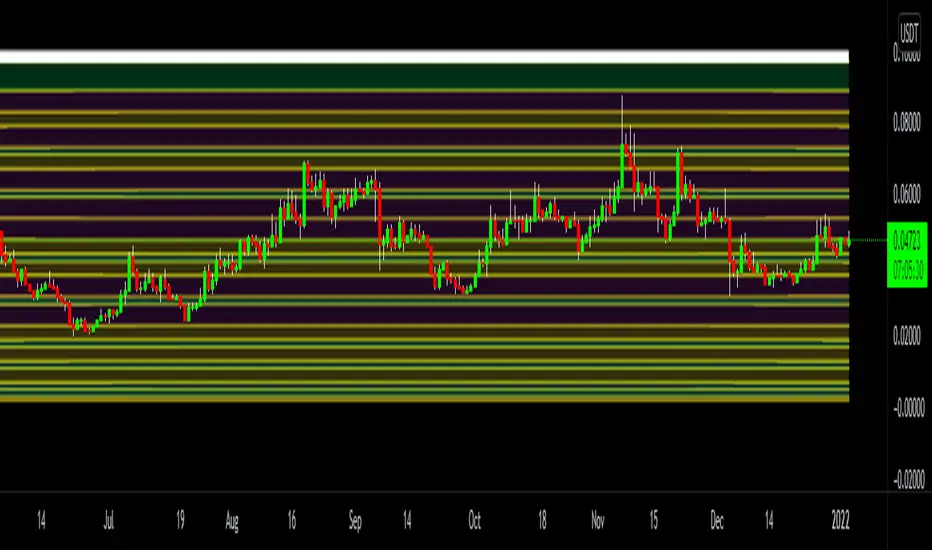
Prime Distance Frame Quant Model for Risk Reward & Pivot PointsIn this script we take all of the prime numbers up to 100 and plot them as olive lines and then consider the distance between two adjacent plots and color code these distances with the fill function. This allows us to find higher and lower prime gaps allowing us to make much more informed decisions on our risk reward for a given trade and the levels where we should consider taking profit.
The Script includes scaling for all assets and is intended to be used for crypto trading.
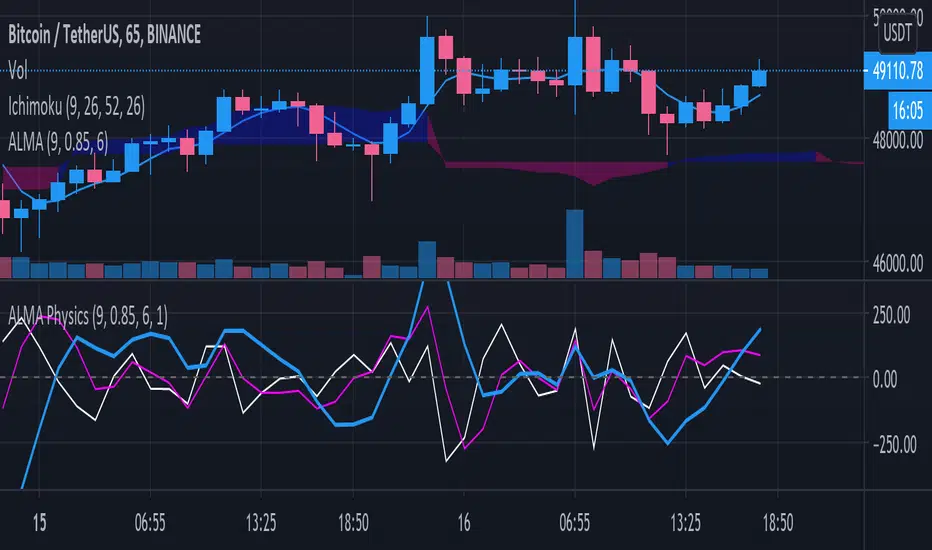
ALMA PhysicsA super simple yet elegant indicator, "ALMA Physics" calculates the derivatives of the Arnaud Legoux Moving Average (ALMA) with respect to Time. Both the ALMA parameters and the time variable can be modified in the indicator's settings.
derivatives "physics":
Blue - ALMA Velocity (dALMA / dt)
Magenta - ALMA Acceleration (d_Velocity / dt)
White - ALMA Jerk (d_Acceleration / dt)
The indicator may be used to gauge market momentum. The simple code can also be used for pedagogical purposes for anyone interested in developing indicators in TradingView.
Mathematical Derivatives of PriceThis indicator is meant to show the Velocity (1st order derivative), Acceleration (2nd order derivative), Jerk (3rd order derivative), Snap (4th order derivative), Crackle (5th order derivative), & Pop (6th order derivative) of price. The values at the top of the indicator window are in this order from left to right. I don't particularly know how this would be used in a trading strategy, but if you're ever curious about how quickly price is moving and how much it is accelerating, then you could use this tool.
*If you only care about velocity and acceleration, and don't like how squished the window is because of the long decimal numbers then edit the "precision" value in the first line of the script to a smaller number of your choosing.*

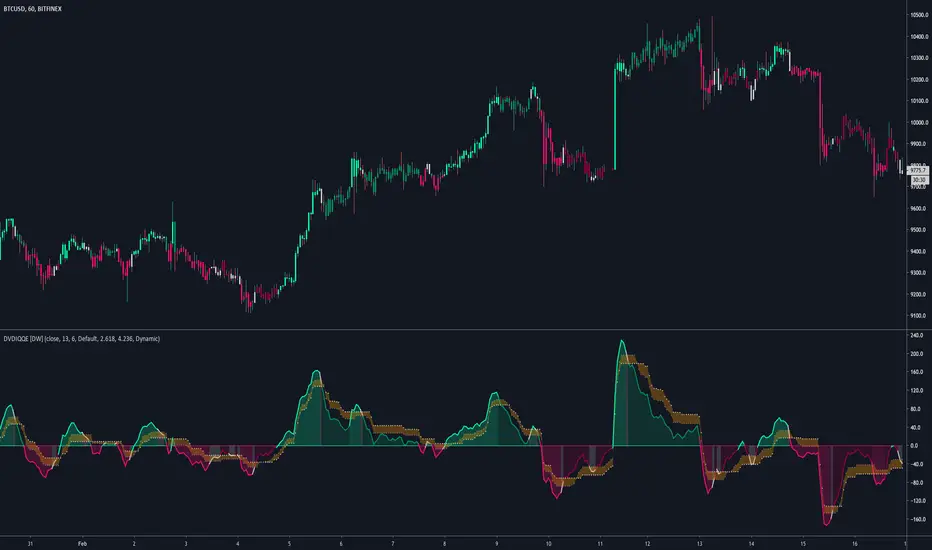
DVDIQQE [DW]This is an experimental study inspired by the Quantitative Qualitative Estimation indicator designed to identify trend and wave activity.
In this study, rather than using RSI for the calculation, the Dual Volume Divergence Index oscillator is utilized.
First, the DVDI oscillator is calculated by taking the difference between PVI and its EMA, and NVI and its EMA, then taking the difference between the two results.
Optional parameters for DVDI calculation are included within this script:
- An option to use tick volume rather than real volume for the volume source
- An option to use cumulative data, which sums the movements of the oscillator from the beginning to the end of TradingView's maximum window to give a more broad picture of market sentiment
Next, two trailing levels are calculated using the average true range of the oscillator. The levels are then used to determine wave direction.
Lastly, rather than using 0 as the center line, it is instead calculated by taking a cumulative average of the oscillator.
Custom bar colors are included.
Note: For charts that have no real volume component, use tick volume as the volume source.