Intermarket SSMT Table [Pogiest]General
Intermarket Sequential Smart Money Technique (IMSSMT) is a Quarterly Theory concept that identifies divergences (extreme highs/lows) when comparing different market triads to another market triad in two consecutive quarters.
SSMT involves identifying divergences in a correlated asset triad that occurs consecutively from the previous quarter to the current quarter to predict new phases of price, a shift in market sentiment, and also potential trend reversals. An SSMT divergence occurs when one or two assets makes a new high or low, but the other asset or assets does not, signaling a potential shift in market direction. A Hidden SSMT Divergence occurs when one or two assets’ closing price closes higher or lower than the other one or two assets’ closing price. However, with potential gaps in price, an opening price can also be the extreme when comparing assets for divergences. Hidden SSMT divergence compares the candle bodies while a Standard SSMT divergence compares the highs and lows. Both types of SSMTs are considered to be cracks in correlation and can be used to identify potential new phases of price whether it be a reversal, retracement, consolidation, and continuation.
Credit of concepts/ideas: ICT & TraderDaye
What Makes This Indicator Unique
The indicator table is designed to be used on any symbol the trader is viewing. For example, the indicator is shown on an NQ chart while selecting three symbols in the Forex triad in settings. The indicator will request the separate data from the symbols selected and display the data within the table. The table does not rely on data on the chart being viewed. Instead of switching charts, the table is used to track other market triads for SSMTs (standard & hidden) while viewing other markets simultaneously.
The indicator has the ability to display Standard SSMTs, Hidden SSMTs, or both simultaneously in real-time, tick by tick in the time period selected in a correlated asset triad within the table. Toggle modes for each type of SSMT will run independently (runs when enabled) and therefore, optimizes performance. The user is able to select three different tickers in settings instead of limiting to pairs. In addition, the indicator has “Invert” toggle options to track both Standard and Hidden SSMTs for assets with negative correlations.
How the Indicator Table Works
The indicator functions to track any divergences from the previous quarter to the current quarter. In addition, the indicator tracks the current status even when there are no divergences (see phase column below).
Timeframe Column:
1. Displays up to two different timeframes to monitor.
Asset Columns:
1. Display up to three different assets to monitor.
2. Cells display “Bull” in green background color or “Bear” in red background color showing the current state of each candle and updates in real-time tick by tick.
Phase Column:
Displays the current status from the previous quarter to the current quarter. The status updates in real-time tick by tick.
1. “F/S” indicates there are no current SSMT divergences between the previous quarter to the current quarter and all assets have not swept the previous quarter, a “failure swing”.
2. “HH” is displayed when all assets have swept the previous quarter’s extreme high. (Higher High)
3. “LL” is displayed when all assets have swept the previous quarter’s extreme low. (Lower Low) See screenshot with drawings below.
4. SSMT indicates there is an SSMT from the previous quarter to the current quarter. Red background is a bearish SSMT (divergence at the highs) or green background is a bullish SSMT (divergence at the lows). If the SSMT becomes invalid (i.e. the last asset sweeps the extreme high/low), then the table will update to display either “HH” or “LL” depending on the extreme it swept. See screenshot with drawings below.
5. “Both” indicates there are SSMT divergences at both the extremes highs and lows. If an SSMT on one side gets deleted, then the cell will automatically update to display the SSMT that is still intact. See screenshot with drawings below.
Invert Toggle Option:
When this setting is turned on, the asset column cells will display the inverted color of the live chart to show assets are in-sync. It will track the inverted swing points for SSMTs, higher highs, lower lows, etc. For example, if EUR and GBP are making lower highs, while DXY (Inverted toggle on), makes a lower low on the actual live chart, it will display “SSMT”.
NOTE:
Scanning function per timeframe to detect SSMTs:
Weekly HTF: Scans 4HR bars
Daily HTF: Scans 1HR bars
6HR/4HR HTF: Scans 15m bars
1HR HTF: Scans 5m bars
5m HTF: Scans 1m bars
The script has fixed lookback periods for bars to ensure the appropriate data is being captured. The higher the timeframe the user selects in settings while viewing on an extremely lower timeframe, the indicator may give inaccurate readings:
Recommended Chart Timeframes:
For best performance and accuracy, view your chart on a timeframe close to or lower than the scan timeframe:
Weekly HTF → View on 1H-4H chart
Daily HTF → View on 1H-4H chart
6HR/4HR HTF → View on 5m-15m chart
90M HTF → View on 3m-15m chart
1H HTF → View on 1m-15m chart
The indicator will attempt to scan further back if needed, but extremely low chart timeframes (e.g., 1m) with high HTF (e.g., Weekly) may still have limitations.
In addition, the indicator bases the SSMT off the previous quarter’s time range to the current quarter’s time range. If there are discrepancies in the time ranges (start to end of higher timeframe period selected), the SSMTs may display differently than what is viewed on the chart. For example, indices open at 18:00 est on a new trading day, so the time ranges matches throughout the day. However, in Forex, EUR and GBP opens at 17:00 est while DXY opens later, so the time ranges may be off (i.e. 6 hour timeframe). For best use, select time periods that matches throughout the day.
Usage
Traders can use both types of SSMT divergences to anticipate potential reversals in points of interest such as higher timeframe swing points, supply/demand zones, higher timeframe imbalances, key levels, etc. This indicator can also be beneficial in identifying cracks in correlation via Hidden SSMT when there are no divergences off the highs and lows. Divergences can come in different forms relating to Intermarket SSMT. For example, if one market triad is all making lower lows while the other market triad is making higher highs, this can be deemed a divergence between the two markets. Another example would be one market triad all makes lower lows while another market triad makes a bullish SSMT. This can potentially signal a bullish move up. SSMT divergences (standard and hidden) can be used as a confirmation tool with other confluences to identify trend direction with respect to points of interest, higher timeframe order-flow, lower timeframe order-flow, etc. In addition, having both a Standard SSMT and Hidden SSMT divergence display could potentially signal a reversal. It is up to the trader to gauge the price action at the time.
Settings
1. Choose up to three different assets to monitor.
Note: If only two are selected, the indicator will only display the two selected and compare the two assets for divergences. If one is selected, a warning sign will be displayed to select at least two assets.
2. Choose up to two different timeframes. Option to deselect timeframes.
3. Enable/disable standard or hidden SSMT.
4. Option to enable alerts. Alerts include the different phases in the table (i.e. SSMT, HH, LL, and Dual SSMT [both standard & hidden) for each timeframe.
5. Toggle option to show/hide the table. Toggle option to show/hide the “Title Row” which is the first row at the top of the table.
6. Adjust the table positioning to be displayed on the chart.
7. Option to change text size in the table cells. This will also increase/decrease the size of the table.
Risk Disclaimer
This indicator is for educational and informational purposes only and does not constitute financial advice. All trading and investment decisions remain solely the responsibility of the user.
Trading involves a high degree of risk, and past performance is not indicative of future results.
Always conduct your own research and consult with a qualified financial professional before making any trading decisions.
By using this indicator, users acknowledge they understand these risks and accept full responsibility for their trading decisions and outcomes.
Quarterlytheory

VX-Time Quadrant Overlay (Quarterly Cycles) by Ikaru-s-The Time Quadrant Overlay is a purely time-based visualization tool designed to structure market time into repeating quarterly cycles across multiple timeframes.
It does not generate trade signals, entries, or bias.
Its sole purpose is to provide time context, so price action can be interpreted within a clear cyclical framework.
What this indicator does
The indicator divides time into four repeating quarters (Q1–Q4) and displays them simultaneously across different time horizons, such as:
Weekly
Daily (6-hour quarters)
90-minute cycles
Micro cycles (within 90-minute structure)
Each row represents a different time cycle, allowing traders to see time alignment, transitions, and overlaps at a glance.
Quarter Structure
Each cycle follows the same repeating sequence:
Q1 – Early phase
Q2 – Expansion / “True Open” phase
Q3 – Continuation
Q4 – Late phase / Transition
The quarters are visualized using color-coded boxes, making it easy to see:
where the market currently is in time
when a new quarter begins
when multiple cycles align or diverge
Quarter Start Marker
An optional Quarter Start Marker (vertical dashed line) can be enabled to highlight the start of a selected quarter (default: Q2).
This is intended as a time reference, not a signal:
useful for planning
useful for contextualizing reactions to levels
useful for session and cycle awareness
How to use it (practical)
This tool is best used to:
provide time structure to existing analysis
plan around upcoming time transitions
contextualize reactions to levels or areas
understand where price is acting within a cycle
It works well alongside:
discretionary price action
session-based trading
futures and index markets
any methodology that respects time as a variable
Customization
The indicator is fully customizable:
Enable / disable individual cycles
Adjust box transparency and history depth
Toggle labels and pane labels
Enable / disable quarter start markers
Select which quarter to highlight
This allows the tool to remain clean on higher timeframes and detailed on lower ones.
Important Notes
This is a visual framework, not a strategy.
No claims of predictive power are made.
Time structure does not replace risk management or execution logic.
The indicator is designed to adapt across markets, but interpretation remains discretionary.
Final Thoughts
Time is often treated as secondary to price.
This tool exists to make time visible, structured, and easy to work with — nothing more, nothing less.

Multi-TF Quarter & Session Candle Indicator-aamirlang [Beta]Key Features:
Quarter Identification: It detects 90-minute HTF candles on 5-minute charts and labels them as Q1, Q2, Q3, Q4 for clear session tracking.
Session Identification (Asia, London, NY, PM): Identifies sessions on 15-minute and 60-minute charts and labels them automatically. So that you can visually see whats happening on Higher TimeFrame.
CISD Detection: Highlights Critical Swing Directions to pinpoint potential market reversals.
Sweep Detection: Automatically draws sweeps to indicate price levels tested or broken.
Multi-Timeframe Support: Works seamlessly on 1m, 5m, 15m, 60m, Daily, Weekly, and Monthly charts.
How It Works:
If you do not see higher TF Candles please enable them from the Menu.
Detects and prints HTF candle and automatically detects Quarters and Sessions.
Automatically maps 5m to 90m (Quarter of a Session) HTF and labels Q1/Q2/Q3/Q4 to each candle so that you can visually see how a session is going on and what to expect in comming sessions.
Automatically detects a Session and labels sessions Asia/London/NY/PM.
When working in Higher TF other that 4H, It prints Daily candles by labeling them.
Other timeframes show normal candle time or standard D/W/M formatting.
CISD module identifies critical swing directions.
Sweeps are drawn automatically to highlight tested levels.
By using this Indicator:
Quickly identify session and quarter candles without manual calculations.
Detect intraday swing directions and potential reversal zones.
Visualize volatility for better risk management.
Perfect for intraday, swing, and long-term analysis.
Credits:
Credit to: @traderdaye for Quarterly theory.
and to all the beautiful people on Tradingview who contributed.
Note:
This is free and version so it may contain error or bugs please leave a comment for any bugs, suggestions and queries.
Enjoy Trading.

Dual SMT - Standard & Hidden [Pogiest]General
Smart Money Technique (SMT) involves identifying divergences in a correlated asset triad to predict new phases of price, a shift in market sentiment, and also potential trend reversals. An SMT divergence occurs when one or two assets makes a new high or low, but the other asset or assets does not, signaling a potential shift in market direction. A Hidden SMT Divergence occurs when one or two assets’ closing price closes higher or lower than the other one or two assets’ closing price. However, with potential gaps in price, an opening price can also be the extreme when comparing assets for divergences. Hidden SMT divergence compares the candle bodies while a Standard SMT divergence compares the highs and lows. Both types of SMTs are considered to be cracks in correlation and can be used to identify potential new phases of price whether it be a reversal, retracement, consolidation, and continuation.
Note: Credit of concepts/ideas goes to ICT and TraderDaye.
What Makes This Indicator Unique
The indicator has the ability to display Standard SMTs, Hidden SMTs, or both simultaneously in real-time, tick by tick in the time period selected in a correlated asset triad. Toggle modes for each type of SMT will run independently (runs when enabled) and therefore, optimizes performance. Option to select three different tickers in settings instead of limiting analysis to pairs makes this indicator more versatile. In addition, the indicator has “Invert” toggle options to track both Standard and Hidden SMTs for assets with negative correlations.
Instead of confirming SMT by selecting the number of pivots to look back for detection and confirmation, lines will be plotted on the chart on the first tick it detects a divergence. This can help traders anticipate SMTs in advance and give early warnings instead of waiting for a pivot confirmation. Active lines are displayed on the chart when the indicator identifies a divergence from the current time range to the previous time range in a correlated asset triad. These lines will move dynamically tick by tick on the chart and are anchored to the exact high/lows (Standard SMT) or bodies extremes (Hidden SMT). For inverted symbols, the lines will plot at the inverted anchor points. If new extremes are being made, the lines will move dynamically with the current forming candle for visual precision. During the current time period, the indicator continues to scan for new highs/lows as well as scanning the body high/lows while making line adjustments automatically. Lines will get deleted once the SMT becomes invalid.
The indicator is also designed for consecutive time ranges or cycles. Users are able to select the timeframe to monitor divergences which the indicator has multiple options to choose from including the most used timeframes (i.e. Monthly, Weekly, Daily, 6HR, 4HR, 90M, 1HR, 30M, 15M, etc). For example, if the 90m timeframe is selected, then the indicator will scan for divergences at the extremes in the current 90m cycle and compare the extremes to the previous 90m cycle. The indicator is designed to work when viewing lower timeframes while selecting higher timeframe cycles in settings.
There are four separate alert systems included in this indicator consisting of Standard bull/bear and Hidden bull/bear. Indicator is mode-aware and only triggers when alerts are enabled.
Dynamic Capabilities
Active (Real-Time):
For Standard SMT (High/Low), the indicator scans for divergences using the absolute highs and lows of each candle:
• Bull SMT: Compares the lowest points (wicks included).
• Bear SMT: Compares the highest points (wicks included).
In addition to SMT lines being plotted immediately after detection and lines moving dynamically at new high/low extremes, the indicator will remove the SMT automatically at the first tick it detects the divergence becoming invalid (i.e. all assets made a higher high or lower low in two consecutive time periods). Standard SMT labels are displayed as "SMT - TF" and are anchored to the center of the SMT line.
For Hidden SMT (Bodies), the indicator scans for divergences using only the candle body extremes (open/close, ignoring wicks):
• Bull SMT: Compares the lowest body prices (min of open/close) - divergence based on where bodies close, not wicks.
• Bear SMT: Compares the highest body prices (max of open/close) - divergence based on where bodies close, not wicks.
In addition to SMT lines being plotted immediately after detection and lines moving dynamically following the body high/low extremes, the indicator will remove the SMT automatically once the divergence becomes invalid (i.e. all assets made a higher high or lower low with the body extremes in two consecutive time periods). Hidden SMT labels are displayed as "SMT - TF" and are anchored to the center of the SMT line.
Historical (Fixed Plotting):
Once an SMT divergence (Standard or Hidden) was active and the current time range completes, the SMT line will be plotted and fixed on the chart as a historical line as the new time range starts. When the new time range starts, the cycle resets and the indicator scans for a new active SMT line in the current time range compared to the previous time range. Historical lines are stored for Standard SMT (up to 5) and Hidden SMT (up to 5) for the most recent lines.
Inverse SMT lines (Negative Correlation):
Assets with a negative correlation can be selected in settings with the Invert toggle option selected in settings. SMT divergences for both Standard and Hidden SMTs will be plotted on the chart at their respective anchor points from the previous time cycle to the current time cycle. Lines will behave normally as how it functions when the invert toggle is deselected. However, the lines are inverted on the chart with bullish SMT lines at the highs or bearish SMT lines at the lows.
Usage
Traders can use both types of SMT divergences to anticipate potential reversals in points of interest such as higher timeframe swing points, supply/demand zones, higher timeframe imbalances, key levels, etc. This indicator can also be beneficial in identifying cracks in correlation via Hidden SMT when there are no divergences off the highs and lows. SMT divergences (standard and hidden) can be used as a confirmation tool with other confluences to identify trend direction with respect to points of interest, higher timeframe order-flow, lower timeframe order-flow, etc. In addition, having both a Standard SMT and Hidden SMT divergence display could potentially signal a reversal. It is up to the trader to gauge the price action at the time.
Settings
1. Choose up to three different assets to monitor.
Note: If only two are selected, the indicator will only display the two selected and compare the two assets for divergences.
2. Choose up to one timeframe to monitor.
3. Enable/disable Invert mode.
4. For Standard and Hidden SMT: Enable/disable SMT-Active lines, option to change line style, line width, bull SMT line color, bear SMT line color, and bull/bear label text color.
5. For Standard and Hidden SMT: Enable/disable Historical SMT lines, adjust max historical SMT signals to be displayed (up to 5), option to change line style, line width, bull SMT line color, bear SMT line color, and bull/bear label text color.
6. For Standard and Hidden SMT: Show/hide SMT Labels and adjustable label offset.
7. Shared Label Settings: Adjust label size.
8. Enable/disable SMT Active alerts for Standard and Hidden SMT.
Risk Disclaimer
This indicator is for educational and informational purposes only and does not constitute financial advice. All trading and investment decisions remain solely the responsibility of the user.
Trading involves a high degree of risk, and past performance is not indicative of future results.
Always conduct your own research and consult with a qualified financial professional before making any trading decisions.
By using this indicator, users acknowledge they understand these risks and accept full responsibility for their trading decisions and outcomes.

Quarterly Theory (Lé Modél) 🧪 [Ultimate +] | cephxsQUARTERLY THEORY (LÉ MODÉL) 🧪
SSMT + Timed Structural Swing Points + Alerts
This is mostly types using voice typing so the punctuation might be off.
This indicator uses public domain information based on a trading system called "Quarterly Theory" by TraderDaye & ICT. All concepts are freely available educational material that's been around for years. I just built a tool to visualize it properly.
WHAT IS THIS?
Alright so basically this is my attempt (pretty good attempt I'd say) at building the ultimate quarterly theory tool. It tracks multiple timeframe cycles (monthly, weekly, daily, 90m, and micro) and detects when correlated assets are diverging from each other at key swing points. That's the SSMT (sequential smt) part otherwise called an Offset Divergence either in an Accumulation/distribution phase of price.
On top of that, it finds timed structural swing points with their exact formation times, detects liquidity purges, and confirms change in state of delivery (CISD) through orderblock reclaims. Everything is wrapped in a pretty comprehensive alert system so you can actually trade off this stuff without staring at charts 24/7.
CORE FEATURES
Multi-Cycle SSMT Detection: tracks divergences across 5 nested cycles - monthly, weekly, daily, 90m, and micro. each cycle has its own visibility gates so you're only seeing what's relevant to your chart timeframe. They are also customizable so you are not restricted to what I think is best; nevertheless, hard gates are put in place to prevent unnecessary data calls too far back into history to allow users of all plans to use without errors (Bar data limits)
Timed Swing Points: every pivot high/low gets timestamped. you'll see exactly when the swing formed - super useful for macro window analysis (those :00-:10 and :50-:00 minute windows).
Liquidity Purges: automatically detects when price sweeps a previous swing high/low and reverses. shows both the sweep level and confirmation.
CISD (Change In State of Delivery): finds the stretch candle at pivots and waits for price to reclaim it. that's your delivery change confirmation.
Auto Asset Detection: just throw it on any chart and it figures out the correlated assets for you. works with indices ( CME_MINI:NQ1! , CME_MINI:ES1! , CBOT_MINI:YM1! ), forex majors ( FOREXCOM:EURUSD , FOREXCOM:GBPUSD ), metals ( FOREXCOM:XAUUSD , FOREXCOM:XAGUSD ), crypto, and more.
Normal + Hidden Divergences: normal divergence is when extremes diverge between assets. hidden divergence uses body closes instead of wicks - sometimes catches moves that normal misses.
Comprehensive Alert System: atomic alerts for individual events, preset combos for multi-confluence setups, and a custom "alert kitchen" to build your own conditions.
Each of these features can be visually disabled individually while the logic is still computed and alerts still function without bother.
THE CYCLES EXPLAINED
quarterly theory breaks time down into nested fractal cycles. each cycle divides into 4 quarters (Q1, Q2, Q3, Q4) where Q2 is typically expansion/displacement:
Monthly Cycle: tracks the 4 weeks of the month. best viewed on 4H charts and above
Weekly Cycle: Mon-Tue-Wed-Thu-Fri as the 5 "quarters". best on 1H charts.
Daily Cycle: the trading day split into 4 sessions (asia, london, ny am, ny pm). best on 15m.
90m Cycle: 6 x 90-minute windows throughout the day. best on 3-5m charts.
Micro Cycle: 22.5-minute quarters within each 90m block. 1m charts only.
Tried to implement a new Quarterly Cycle, will defer that to a later update.
VISIBILITY GATES
the indicator automatically shows/hides cycles based on your chart timeframe. here's how it works:
Auto Mode (recommended):
Micro: 1m only
90m: 3m-5m
Daily: 15m only
Weekly: 1H only
Monthly: 4H only
Extended Mode (more flexibility):
Micro: 1m-3m
90m: 1m-30m
Daily: 5m-1H
Weekly: 15m-4H
Monthly: 4H-1D
you can also set custom ranges or just show everything with "All" mode.
INPUTS BREAKDOWN
Visual Preset
All Features: shows everything - SSMT, time labels, CISD, purges
SSMT + TIME + CISD: hides purge lines for cleaner charts
SSMT + CISD: hides time labels too
SSMT Only: just the divergence lines, nothing else
SSMT Plots (Section 2)
Extreme Detection Mode: "Normal" uses wick extremes, "Hidden" uses body closes, "All" shows both
Per-Cycle Toggles: enable/disable each cycle independently with custom colors
Label Styling: choose between "Cycle + Asset", "Cycle" only, or "Asset" only labels
Pivot Detection (Section 3)
Sensitivity: controls how many bars on each side to confirm a swing (default: 2)
Maximum Points: limits how many pivots are displayed
Pivot Labels (Section 4)
Show Time Labels: displays the exact timestamp of each swing
Key Times Only: only shows labels for swings in macro windows (:00-:10, :24-:36, :50-:59)
Macro Colors: special highlighting for pivots during macro windows
Purge Detection (Section 5-6)
Pending Timeout: how many bars a purge can wait for confirmation before being discarded
Strict Key Time: requires both the sweep AND confirmation to be in key time windows
Dotted Line Offset: how far the confirmation line extends past the reversal candle
CISD Detection (Section 7-8)
Size Filter: filters out tiny orderblocks using ATR-based sizing. options from "Really Small" (shows most) to "Juicy" (only big ones)
Pending Timeout: bars before an unconfirmed CISD expires
Exhaustive Mode: shows all valid CISDs instead of limiting to max count
ALERT SYSTEM
this is where it gets powerful. three tiers of alerts:
Atomic Alerts (individual events):
Swing High/Low formed
Bearish/Bullish Purge confirmed
CISD Confirmed/Pending
Purge + CISD Combo
Preset Combos (multi-confluence):
M/W/D/90/Micro SSMT + CISD: fires when SSMT divergence is active AND CISD confirms in matching direction
Require Matching Purge: adds purge to the combo requirement
Stacked Alerts: triggers when 2+ cycles align simultaneously
Alert Kitchen (custom builder):
build your own combo by selecting:
Which SSMT cycle (with direction: bullish/bearish/any)
Whether CISD is required
Whether matching purge is required
Purge tolerance (how close the purge pivot needs to be)
Session Filter:
all alerts can be filtered to only fire during specific sessions:
Asia: 18:00-00:00 ET
London: 02:00-05:00 ET
NY AM: 08:30-12:00 ET
NY PM: 13:30-16:00 ET
Custom time ranges
AUTO ASSET DETECTION
the indicator uses the AssetCorrelation library to automatically figure out which assets to compare. here's what it supports:
US Indices: CME_MINI:NQ1! , CME_MINI:ES1! , CBOT_MINI:YM1! (or micros MNQ/MES/MYM)
Forex Majors: FOREXCOM:EURUSD , FOREXCOM:GBPUSD vs TVC:DXY
Metals: FOREXCOM:XAUUSD , FOREXCOM:XAGUSD , Copper
Energy: CL (crude), RB (gasoline), HO (heating oil)
Crypto: BTC, ETH, TOTAL3 as triad
EU Indices: GER40, EU50, UK100, ESP35
you can also disable auto mode and manually configure your own asset triads/dyads.
STATUS BAR
optional horizontal bar showing which SSMT cycles are currently active. displays M | W | D | 90m | Micro with color coding:
Blue = bullish divergence active
Red = bearish divergence active
Gray = neutral (no divergence)
Purple = both directions active simultaneously (sandwich)
RECOMMENDED USAGE
start with "Auto" timeframe gating - it shows the right cycles for your chart
focus on cycles that align with your trading style (scalpers: 90m/micro, swing: daily/weekly)
use CISD confirmation before entries - divergence alone isn't enough (at least for me)
Pair with True Opens to align properly (This is a trading model in itself)
set up preset alerts for your main setup (e.g., "D SSMT + CISD" on 15m chart)
filter alerts to your active trading session to reduce noise
TIMEFRAME CHEAT SHEET
1m: Micro cycle + 90m context
3-5m: 90m cycle + Daily context
15m: Daily cycle + Weekly context
1H: Weekly cycle + Monthly context
4H: Monthly cycle only
FAQ
why don't i see any SSMT lines?
check your timeframe gating mode. if you're on a 15m chart with "Auto" mode, you'll only see Daily cycle. switch to "Extended" or "All" to see more cycles.
what's the difference between normal and hidden divergence?
normal uses wick highs/lows, hidden uses body closes. hidden can catch divergences that wicks miss, but it's also noisier.
Why do some CISDs not confirm?
the stretch candle needs to be reclaimed by price within the timeout window. if price never comes back to that level, the CISD expires.
can i use this on stocks?
technically yes, but you'll need to manually configure your asset pairs since auto-detection focuses on futures/forex/crypto.
DISCLAIMER
this is an educational tool, not financial advice. quarterly theory, SSMT, and all related concepts are based on publicly available information from TraderDaye and ICT methodology on X with a touch of my own discoveries too.
past performance doesn't guarantee future results. always use proper risk management and never trade more than you can afford to lose. the indicator is provided as-is with no guarantees.
do your own backtesting before using this in live markets.
CREDITS
Quarterly Theory concepts: TraderDaye & ICT
AssetCorrelation library: fstarcapital
Development: cephxs & fstarcapital community
CHANGELOG
Ultimate +: added Alert Kitchen, stacked cycle alerts, session filtering, status bar, size-filtered CISD
Pro +: added hidden divergences, added sweep detection/plots, auto asset detection, preset combos
Base: initial release with core SSMT and pivot time labels
No form of this Library is to be sold in any capacity as part of any service / indicator on the TradingView Platform or elsewhere by anyone else but me.
Otherwise it is completely free to use in private and public open/closed source indicators.
Sidenote: 3rd upload because I'm trying to get the thumbnail right :(
Made with ❤️ from cephxs

QT Previous Micro Cycle Range + SSMT [bilal]Previous Micro Cycle Range + SMTs - Indicator Description
📊 Overview
This indicator tracks 22.5-minute micro cycles within ICT's Quarterly Theory framework and automatically detects Smart Money Technique (SMT) divergences across correlated indices (NQ, ES, YM). It visualizes previous cycle ranges and identifies high-probability manipulation completions for precise intraday entries.
🎯 What It Does
Micro Cycle Tracking:
Divides each 90-minute session into four 22.5-minute micro quarters
Plots the previous micro cycle's High, Low, Equilibrium (EQ), and Quarter levels
Updates automatically as new micro cycles form
Works on any timeframe (recommended: 1-5 minute charts)
SMT Detection:
Compares current micro cycle vs previous micro cycle across NQ, ES, and YM
Detects Bearish SMT: Divergence at highs (signals distribution down)
Detects Bullish SMT: Divergence at lows (signals distribution up)
Draws visual SMT lines with directional arrows showing correlation/divergence
Optional SMT table showing all three indices' movements
💡 How To Use It
For Scalpers & Day Traders:
Wait for a new micro cycle to begin (lines will refresh every 22.5 minutes)
Watch for SMT formation in the current cycle
Bullish SMT = Buy signal (previous low is confirmed, expect move to previous high)
Bearish SMT = Sell signal (previous high is confirmed, expect move to previous low)
Key Concepts:
Minimum Target: Opposite extreme of previous cycle
SMT Confirmation: One or two indices sweep a level while the other(s) fail to sweep
Best Results: Trade with higher timeframe bias aligned
⚙️ Features
Customizable Display:
Toggle High/Low lines with multiple label styles (Timeframe, Label, %, Fib)
Optional Equilibrium (50%) level
Optional Quarter levels (25% / 75%)
Optional extended range projections (±50% to ±400%)
Adjustable line colors, widths, and label sizes
SMT Options:
Enable/disable SMT detection
Show/hide SMT text labels
Custom colors for bullish/bearish SMTs
Option to delete previous cycle SMTs (keeps chart clean)
Real-time SMT table showing all three indices
Comparison Assets:
Default: ES1! and YM1! (customize to your preference)
Set correlation type for each asset (correlated vs inverse)
Disable individual assets if needed
🔍 Understanding The Visuals
Lines:
Solid lines = Previous cycle High/Low (where price came from)
Dotted lines = EQ and Quarter levels (internal cycle structure)
Green lines = SMT divergence detected (buy/sell signal)
Labels:
▲ = Asset made higher high/low vs previous cycle
▼ = Asset made lower high/low vs previous cycle
🔺 = Inverse correlation (up when others down)
🔻 = Inverse correlation (down when others up)
SMT Logic:
If indices diverge (move opposite directions), SMT is confirmed
Bearish SMT = Highs diverge → Sell
Bullish SMT = Lows diverge → Buy
📈 Best Practices
Use on 1-5 minute charts for optimal micro cycle visualization
Combine with higher timeframe bias (Daily Cycle SSMT, session bias, etc.)
Wait for SMT confirmation before entering trades
Target previous cycle's opposite extreme as minimum profit target
Exit when opposing SMT forms or price reaches target
🛠️ Settings Guide
Essential Settings:
Comparison Symbols: Set to the indices you trade (default: ES1!, YM1!)
Show Cycle SMT: Toggle SMT detection on/off
Delete Previous Cycles SMTs: Keep chart clean by removing old SMTs
Visual Preferences:
Line Color/Width: Customize previous cycle lines
Label Style: Choose between Timeframe (22.5m), Label (descriptive), % (percentage), or Fib (0-1)
Show High/Low: Toggle previous cycle extremes
Show EQ/Quarters/Extended Ranges: Add more reference levels as needed
⚠️ Important Notes
This indicator shows previous cycle ranges, not predictive future levels
SMTs are confirmation signals for manipulation completion
Always use proper risk management and combine with your trading plan
Best results when aligned with higher timeframe directional bias
🎓 Based On ICT Concepts
This indicator implements concepts from Inner Circle Trader (ICT):
Quarterly Theory (fractal time structure)
Micro cycles (22.5-minute quarters)
Sequential SMT (mechanical divergence confirmation)
Smart Money accumulation, manipulation, distribution (AMD)
Perfect for: Scalpers, day traders, and anyone using ICT's Quarterly Theory and SMT concepts for precise intraday entries.
Note: This is a study indicator (overlay=true). It does not generate buy/sell signals automatically - you must interpret SMT formations based on your trading strategy.RéessayerGu should know it only works on the 30s chart btwPrevious Micro Cycle Range + SMTs - Indicator Description
📊 Overview
This indicator tracks 22.5-minute micro cycles within ICT's Quarterly Theory framework and automatically detects Smart Money Technique (SMT) divergences across correlated indices (NQ, ES, YM). It visualizes previous cycle ranges and identifies high-probability manipulation completions for precise intraday entries.
⚠️ IMPORTANT: This indicator is designed to work on the 30-second chart only. The micro cycle calculations are optimized for 30s timeframe data.
🎯 What It Does
Micro Cycle Tracking:
Divides each 90-minute session into four 22.5-minute micro quarters
Plots the previous micro cycle's High, Low, Equilibrium (EQ), and Quarter levels
Updates automatically as new micro cycles form every 22.5 minutes
Precise timing based on New York timezone session structure
SMT Detection:
Compares current micro cycle vs previous micro cycle across NQ, ES, and YM
Detects Bearish SMT: Divergence at highs (signals distribution down)
Detects Bullish SMT: Divergence at lows (signals distribution up)
Draws visual SMT lines with directional arrows showing correlation/divergence
Optional SMT table showing all three indices' movements in real-time
💡 How To Use It
Setup:
Switch to 30-second chart (required for accurate cycle timing)
Add indicator to your chart
Ensure you're viewing NQ, ES, or YM (or correlated futures)
For Scalpers & Day Traders:
Wait for a new micro cycle to begin (lines will refresh every 22.5 minutes)
Watch for SMT formation in the current cycle
Bullish SMT = Buy signal (previous low is confirmed, expect move to previous high)
Bearish SMT = Sell signal (previous high is confirmed, expect move to previous low)
Key Concepts:
Minimum Target: Opposite extreme of previous cycle
SMT Confirmation: One or two indices sweep a level while the other(s) fail to sweep
Best Results: Trade with higher timeframe bias aligned (Daily Cycle SSMT, session bias)
⚙️ Features
Customizable Display:
Toggle High/Low lines with multiple label styles (Timeframe, Label, %, Fib)
Optional Equilibrium (50%) level
Optional Quarter levels (25% / 75%)
Optional extended range projections (±50% to ±400%)
Adjustable line colors, widths, and label sizes
Line extension length (default: 15 bars ahead)
SMT Options:
Enable/disable SMT detection
Show/hide SMT text labels with ticker symbols and directional arrows
Custom colors for bullish/bearish SMT lines
Option to delete previous cycle SMTs (keeps chart clean)
Real-time SMT table showing all three indices' current status
Comparison Assets:
Default: ES1! and YM1! (customize to your preference)
Set correlation type for each asset (correlated vs inverse)
Disable individual assets if needed
Works with any correlated futures contracts
Debug Mode:
Toggle debug info to see current NY time, session, and micro cycle timing
Helpful for understanding cycle structure and troubleshooting
🔍 Understanding The Visuals
Lines:
Solid lines = Previous cycle High/Low (where price came from)
Dotted lines = EQ and Quarter levels (internal cycle structure)
Green lines (default) = SMT divergence detected (buy/sell signal)
Gray dotted lines = Extended range projections (if enabled)
Labels:
▲ = Asset made higher high/low vs previous cycle (correlated)
▼ = Asset made lower high/low vs previous cycle (correlated)
🔺 = Inverse correlation (up when others down)
🔻 = Inverse correlation (down when others up)
SMT Logic:
If indices diverge (move opposite directions), SMT is confirmed
Bearish SMT = Highs diverge → High is set, expect distribution down
Bullish SMT = Lows diverge → Low is set, expect distribution up
📈 Best Practices
Must use 30-second chart - indicator timing is calibrated for this timeframe
Combine with higher timeframe bias (Daily Cycle SSMT, 90-min SSMT, session bias)
Wait for SMT confirmation before entering trades (don't front-run)
Target previous cycle's opposite extreme as minimum profit target
Exit when opposing SMT forms or price reaches target
Best windows: Q2→Q3 or Q3→Q4 transitions within 90-minute sessions
Volatility injection times: Watch 09:30, 10:00, and 14:00 ET for strongest moves
🛠️ Settings Guide
Essential Settings:
Comparison Symbols: Set to the indices you monitor (default: ES1!, YM1!)
Correlation Type: Toggle "Correlated" on/off for each asset based on expected relationship
Show Cycle SMT: Enable/disable SMT detection
Show SMT Text: Toggle labels showing ticker divergence details
Delete Previous Cycles SMTs: Keep chart clean by removing old SMTs
Visual Preferences:
Line Color/Width: Customize previous cycle lines (default: black, width 1)
Label Style: Choose between:
Timeframe (shows "22.5m")
Label (descriptive: "previous micro cycle high/low")
% (shows "100%/0%")
Fib (shows "1/0")
Show High/Low: Toggle previous cycle extremes (recommended: ON)
Show EQ/Quarters/Extended Ranges: Add more reference levels as needed
SMT Customization:
SMT Colors: Customize bearish/bullish SMT line colors (default: green for both)
SMT Label Colors: Background and text color for SMT labels
SMT Table: Toggle real-time comparison table (bottom right)
⚠️ Important Notes
30-second chart required - will not work accurately on other timeframes
This indicator shows previous cycle ranges, not predictive future levels
SMTs are confirmation signals for manipulation completion, not entry triggers alone
Always use proper risk management and position sizing
Best results when aligned with higher timeframe directional bias
Monitor all three indices (NQ, ES, YM) for complete SMT picture
Micro cycles are part of a fractal structure - align with 90-min and Daily Cycle SMTs
🎓 Based On ICT Concepts
This indicator implements concepts from Inner Circle Trader (ICT):
Quarterly Theory (fractal time structure - 22.5 min micro quarters)
Micro cycles (four quarters within each 90-minute session)
Sequential SMT (mechanical divergence confirmation across correlated indices)
Smart Money AMD (Accumulation, Manipulation, Distribution pattern)
New York session timing (based on ICT's 6-hour daily cycles)
🕐 Micro Cycle Structure
Each 90-minute session divides into four 22.5-minute micro quarters:
Micro Q1: 00:00 - 22:30
Micro Q2: 22:30 - 45:00
Micro Q3: 45:00 - 67:30
Micro Q4: 67:30 - 90:00
This pattern repeats across all 16 daily 90-minute sessions (Q1.1 through Q4.4).
Perfect for: Scalpers and day traders using ICT's Quarterly Theory and SMT concepts for precise micro-level entries on 30-second charts.
Chart Requirement: 30-second timeframe only.
Note: This is a study indicator. It does not generate automatic buy/sell signals - you must interpret SMT formations based on your trading strategy and higher timeframe bias.

2-Stage PSP with SMT [Pogiest]General
Precision Swing Point (PSP) is a concept derived from Quarterly Theory concepts originating from ICT methodologies. The concept typically uses a 3-candle swing formation in which candle 2 has a divergence in the closing price with one asset compared to the other two assets in a correlated asset triad (i.e. one closes bullish and other two closes bearish, vice-versa). A Terminus Price Divergence (TPD) is an additional divergence between candle 1’s closing price and candle 3’s opening price (i.e. one asset’s candle 3 opening price opens below candle 1 closing price while the other two assets’ candle 3 opening price opens above candle 1 closing price, vice-versa). The candle 3 divergence and candle 2 divergence put together is what defines a TPD. Additionally, consecutive candle SMT (Smart Money Technique) are divergences between Candle 1/Candle 2 highs/lows or Candle 2/Candle 3 high/lows. There are different types of cracks in correlation. A crack in correlation can be defined as a precision swing point, a terminus price divergence, SMT, etc. A “2-Stage PSP” can be defined as a confirmed PSP with consecutive candle SMT. Several cracks in correlation can signify a potential reversal, retracement, or continuation.
What makes this indicator unique:
This indicator is designed to track PSP and TPDs in real time as they are forming. It first displays the current state of the current candle’s price action whether bullish or bearish and highlights when a PSP is about to form. Once the PSP is confirmed, the indicator looks for a second crack in correlation between candle 1’s closing price and candle 3’s opening price to confirm a TPD is active. Once the TPD is active, it looks for a crack in correlation via SMT between Candle 1 and Candle 2’s highs/lows or between Candle 2 and Candle 3’s high/lows. The PSP w/ TPD confirmation and SMT divergence would be deemed a “2-Stage PSP” which is all highlighted in the indicator table. Several cracks in correlation can signify a potential reversal, retracement, or continuation.
Note: Credit of concepts/ideas goes to TraderDaye, JacobSpeculates, The Market Lens Team, Afyz, and ICT.
How the Indicator Table Works
Timeframe Column:
1. Displays up to four different timeframes to monitor.
Asset Columns:
1. Cells display “Bull” in green background color or “Bear” in red background color showing the current state of each candle and updates in real-time tick by tick.
-2. Up and Down arrows are fixed in the cells when the TPD status is “Active” (See below) indicating the final print of the PSP candle (candle 2) closing bullish (up arrow) or bearish (down arrow). The arrows will be cleared once the TPD status is either in an “Inactive” or “Pending” state.
TPD Status Column (see defined divergences in General section above):
1. “Inactive” indicates no divergence in all assets (i.e. all three assets in a triad are all printing bullish or bearish candles)
2. “Pending” indicates a potential divergence in candle 2’s closing price (i.e. one asset’s current state in candle 2 is bearish while the others are bullish, vice versa). This updates in real-time tick by tick and continues to monitor each candle as they form for a candle 2 divergence.
3. “Active” indicates a confirmed TPD in which both a candle 2 divergence and candle 3 divergence (i.e. divergence between candle 3 opening price and candle 1 closing price) exists.
Note 1: If candle 2 has an asset in a correlated triad close as a doji candle (opening price and closing price are exactly the same) while the other two assets close bullish or bearish, the indicator will not deem candle 2 as a valid PSP candle. There has to be a divergence in the opening/closing price on at least two assets to be valid.
Note 2: Any historical TPDs will not be displayed in the table as this indicator only tracks TPDs in real time and continuously monitors for potential TPDs and confirmed TPDs.
Added Feature (2 Stage PSP)
SMT 1: Displays an SMT consecutive candle divergence between candle 1 and candle 2’s highs and lows. This is displayed once a TPD is in “Active” status while candle 3 is printing. Therefore, the label in the table cell displays past data (Candle 1 and Candle 2 high/low SMTs).
1. “Inactive” indicates there were no SMT divergences.
2. “Asset symbol names” are displayed with a corresponding up arrow or down arrow. Cell background color is red for SMT Divergence at the highs and green for SMT Divergence at the lows. For example, if there was a bearish SMT at the highs of candle 1/candle 2 and one asset made the higher high in candle 2, then that asset would have the up arrow indicating it swept candle 1’s high while the other assets have the down arrow as they did not sweep candle 1’s high. This works vice versa for bullish scenario.
3. “Both” indicates there are SMT divergences at both the highs and lows of candle 1 and candle 2.
SMT 2: Displays an SMT consecutive candle divergence between candle 2 and candle 3’s highs and lows. This is displayed while a TPD is in “Active” status and updates in real-time tick by tick during candle 3’s price action.
1. “Inactive” indicates there are no current SMT divergences.
2. “Asset symbol names” are displayed with a corresponding up arrow or down arrow. Cell background color is red for SMT Divergence at the highs and green for SMT Divergence at the lows. For example, if there was a bearish SMT at the highs of candle 2/candle 3 and one asset made the higher high in candle 3, then that asset would have the up arrow indicating it swept candle 2’s high while the other assets have the down arrow as they did not sweep candle 2’s high. If one of the assets that did not sweep candle 2’s high ends up sweeping the high, then that asset will dynamically move to the left of the cell next to the asset that swept candle 2’s high with an up arrow leaving only one asset with the down arrow. If the last asset ends up sweeping candle 2’s high, then the cell would change to “Inactive”. This works vice versa for bullish scenario.
3. “Both” indicates there are SMT divergences at both the highs and lows of candle 2 and candle 3. If an SMT on one side gets deleted, then the cell will automatically update to display the SMT that is still intact.
Note: Equal lows/highs are considered to be a failure swing since it did not sweep the previous candle low/high.
Settings
1. Choose up to three different assets to monitor.
Note: If only two are selected, the indicator will only display the two selected and compare the two assets for divergences. If one is selected, a warning sign will be displayed to select at least two assets.
2. Choose up to four different timeframes. Option to deselect timeframes.
3. Option to enable all alerts or active alerts. Alerts include the different status changes in the table (i.e. Pending, Active, Bullish SMT, Bearish SMT, etc for each or all timeframes).
4. Toggle option to show/hide the table. Toggle option to show/hide the “Title Row” which is the first row at the top of the table.
5. Adjust the table positioning to be displayed on the chart.
6. Option to change text size in the table cells. This will also increase/decrease the size of the table.
Unique User Experience:
1. Track current PSP/TPD status in real-time tick by tick as candles form in multiple timeframes.
2. Track consecutive candle SMT in a 3-candle swing formation in real-time in multiple timeframes.
3. Instead of switching through timeframes to check for PSPs/TPDs, they are consolidated in one table.
4. Once there is a confirmed consecutive candle SMT indicated on the table, there are several cracks in correlation (PSP, TPD, and SMT).
Risk Disclaimer
This indicator is for educational and informational purposes only and does not constitute financial advice. All trading and investment decisions remain solely the responsibility of the user.
Trading involves a high degree of risk, and past performance is not indicative of future results.
Always conduct your own research and consult with a qualified financial professional before making any trading decisions.
By using this indicator, users acknowledge they understand these risks and accept full responsibility for their trading decisions and outcomes.

Quarterly Theory [@kaleboraciy]🧠 Daye Quarterly Theory is based on the idea that markets often move in repeating cycles. Each part of the cycle reflects a stage of the market
Consolidation
Manipulation
Distribution
Reversal/Continuation
This is a classic AMD-X pattern, which is widely used in SMC & ICT concepts. By spotting these phases, traders can better understand where the market might be heading next.
⭐ An important feature of this indicator is the Fibonacci levels, which are calculated in a clever way on the Q1 part of each cycle. You can use this levels for precise entries on manipulation in Q2
📖 Now I want to give brief description of each cycle:
Daily Cycle - the day can be broken down into 6 hour quarters
Q1 - 18:00 - 00:00 Asia.
Q2 - 00:00 - 06:00 London (True Open).
Q3 - 06:00 - 12:00 NY AM.
Q4 - 12:00 - 18:00 NY PM.
Pro tips:
Q2 often lines up with the session’s True Open - a key reference for directional bias.
Q3 tends to show the most directional momentum during the trading day.
Q4 is a critical zone for judging whether the day will extend the move or retrace.
Weekly Cycle - Daye determined that although the trading week is composed of 5 trading days, we should ignore Friday, and the small portion of Sunday’s price action:
Q1 - Monday
Q2 - Tuesday (True Open, Daily Candle Open Price).
Q3 - Wednesday.
Q4 - Thursday.
Pro tips:
Wednesday (Q3) often provides the week’s strongest directional movement - many trades target this zone.
Tuesday’s manipulation (Q2) may shake out weak positions or set up the directional swing - be careful
Thursday (Q4) helps confirm whether the weekly trend continues or reverses.
Monthly Cycle - considering that we have four weeks in a month, we start the cycle on the first Monday of the month (regardless of the calendar Day):
Q1 - Week 1: first Monday of the month.
Q2 - Week 2: second Monday of the month (True Open, Daily Candle Open Price).
Q3 - Week 3: third Monday of the month.
Q4 - Week 4: fourth Monday of the month.
I hope, that this awesome tool will boost your trading 💰

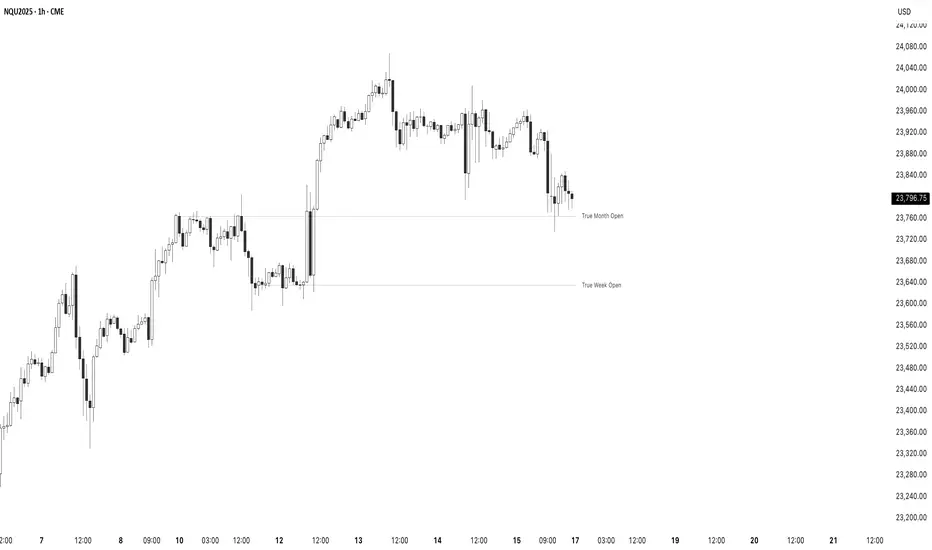
True Opens - (SpeculatorBryan)Overview
This indicator provides a complete framework of key institutional levels by plotting the "True Open" price for the Month, Week, Day, and Intraday Sessions. Instead of using standard chart opens, it uses specific, globally significant times (based in the NY timezone) to identify levels that price action traders watch closely for support, resistance, and market direction.
What It Does
True Monthly Open (TMO): The key macro level, marking the start of the month's trading.
True Weekly Open (TWO): Arguably the most important level, defining the weekly bias. Based on the Sunday evening start of the forex trading week.
True Daily Open (TDO): The New York midnight open, marking the true start of the institutional 24-hour cycle.
True Session Opens (TSO): Key intraday opens (e.g., London, NY) for finding entries and exits on lower timeframes.
Key Features
Clean Forward Projection: All lines and labels project into the future, so you always see the levels in your current price action.
Full Styling Control: Customize the color, style (solid, dashed, dotted), and text for every level to match your chart theme.
Intelligent Display: Levels automatically show on appropriate timeframes to keep your chart clutter-free. Use the "Stacked Opens" feature to override this.
Lightweight & Efficient: Optimized to run smoothly without lagging your chart.
How to Use It
Look for price to react at these levels. A bounce can signal a continuation, while a clean break and retest can signal a change in market structure. Use the higher-timeframe opens (TMO, TWO) as major anchors for your overall bias and the lower-timeframe opens (TDO, TSO) for fine-tuning your entries and exits.
Precision Candle & PSP 🔹 Precision Candle & PSP: Multi-Asset Confirmation Engine
The Precision Candle & PSP indicator is a dual-confirmation engine that detects two distinct price action setups — Precision Candles (PC) and Precision Swing Points (PSP) — using data from two comparison assets of your choice.
By incorporating confirmation from correlated or leading instruments, this tool provides a powerful way to filter out low-probability signals and focus on high-confluence reversal points.
⚙️ Key Features
Multi-Asset Confirmation Logic:
You can define two external symbols (e.g., correlated futures, ETFs, or indices). Signals are only displayed if one of those assets supports the signal seen on the current chart.
Precision Candle (PC) Detection:
This identifies potential reversal bars by checking for opposing candle sentiment between your chart and the comparison asset(s). For example, a bullish bar on the chart paired with a bearish bar on the comparison asset may indicate a rejection or divergence.
Precision Swing Point (PSP) Detection:
Detects swing highs and lows (mid-point structure) and filters them through confirmation from Asset 1 or 2, enabling highly refined structural reversal points.
Asset Priority System:
If both assets confirm, Asset 1 is prioritized. This gives traders control over which market they trust most as the lead signal.
Full Control Over Signal Types:
Toggle between PC, PSP, or both. You can also filter swing points by bullish-only, bearish-only, or both.
Timeframe Filtering:
Allows signals to show only on user-selected timeframes (1m to 1W), which helps align signals with your strategy.
Session-Based Filtering:
Enables session-based control — show signals only during specific time windows (e.g., New York Open, London Close, etc.).
🧠 How It Works
Precision Candle (PC):
Compares the current candle direction (bullish or bearish) on the main chart with the selected asset(s). A signal is generated if there’s candle divergence, indicating potential mispricing or reversal opportunity.
Precision Swing Point (PSP):
Detects classic swing structures (highs/lows) and applies the same multi-asset candle divergence logic, but using the middle bar of the swing. This provides more context and accuracy around turning points.
Visual Priority:
PSP color (from swing logic) takes priority if both PC and PSP trigger on the same bar.
🎯 Who This Indicator Is For
Reversal and structure traders who want early confirmation signals.
Multi-timeframe analysts who want to filter setups by session or timeframe.
Traders working with correlated markets, such as ES/NQ or DXY/Gold, where cross-confirmation adds an edge.
Discretionary traders who need context beyond price alone.
🔒 Why It’s Closed-Source
This script contains:
A custom-built multi-asset confirmation engine, including symbol prioritization and fallback logic.
Dual-layered filtering (timeframe + session) for hyper-specific signal control.
A proprietary blend of candle divergence + swing detection across separate assets — not publicly available in open-source scripts.
Due to the unique logic behind its signal detection and asset coordination framework, the script is protected to preserve its originality and edge.
⚠️ Important Notes
This tool does not generate buy/sell signals — it highlights price structure points that meet your selected confirmation criteria.
You must select valid trading symbols that are available in your data plan.
For best results, use this on correlated or leading markets (e.g., ES/NQ, YM/RTY, BTC.D/BTC, etc.).

Quarterly Theory Opening Prices🔹 Quarterly Theory Opening Prices (QTOP) Indicator
This indicator plots critical institutional price levels based on Quarterly Theory principles. It identifies and displays key opening prices from various timeframes — including Midnight Open, True Session Open (AM & PM), True Week Open, and True Month Open — all dynamically calculated and timezone-aligned.
These levels are widely used by professional traders to anticipate price reactions around session changes. The indicator is highly customizable, giving users visual and analytical access to these levels on any timeframe and market.
🔍 What This Indicator Does
Midnight Open (MO): The open of the new calendar day, often used in intraday trading for anchoring daily ranges.
True Session Open (TSO AM/PM): Reflects institutional trading session starts, designed to highlight liquidity injections during early U.S. market hours (07:30 and 13:30 EST).
True Week Open (TWO): Marks the institutional open for the trading week, beginning on Monday at 18:00 EST (Sunday 6 PM), used for weekly bias.
True Month Open (TMO): Accurately locates the first institutional trading Monday after NFP for monthly opening flow analysis — a rarely implemented but critical level for swing and macro traders.
🎯 Who It’s For
This indicator is designed for:
Intraday traders looking for early-session range anchors and reversal zones.
Swing traders using weekly/monthly opens as structural bias points.
Liquidity-based traders monitoring reactions around key institutional price levels.
🔒 Why It's Closed-Source
This script contains:
A custom-built session detection engine based on timestamp conditions instead of bar-based time filtering, ensuring more accurate plotting across timezones.
Dynamic label and line positioning logic that adapts based on timeframe and chart zoom, minimizing overlap and improving readability.
Proprietary open-level offset calculation logic to enhance visibility and prevent plotting distortion across devices and brokers.
Because these features go beyond existing open-source implementations, and required extensive backtesting and refinement, the source code has been protected.
⚙️ How to Use
Use on any chart and timeframe.
Adjust session settings via the UI panel.
Works best on instruments aligned with New York trading hours, but timezone support is included.
Use plotted levels to define trading ranges, support/resistance, or reference for breakout/reversal strategies.
📌 Note: This tool is not a buy/sell signal generator — it’s designed to provide reliable reference levels around which you can apply your own strategy.

True OpensTrue Opens: Pinpoint Key Inflection Levels
This indicator plots "True Open" price levels for Monthly, Weekly, Daily, and key intraday Sessions. Unlike generic opens, these are anchored to precise New York kickoff times (e.g., True Month Open from the second Sunday at 18:00 NY).
Especially valuable for Futures traders, these levels frequently act as significant support/resistance, offering clear reference points for your analysis.
Conceptual framework based on Daye's Quarterly Theory.

Time-based LiquidityThis indicator automatically marks important time-based liquidity levels on your chart, helping you stay aware of where major price reactions may occur and the market is forced to show its hand.
Key Features:
Previous Month’s, Week’s, and Day’s Highs and Lows: Displays PMH/PML, PWH/PWL, and PDH/PDL — key reference points where liquidity often accumulates.
Intraday Session Highs and Lows: Divides the trading day into quarters (00:00–06:00, 06:00–12:00, etc. following Day’s Quarterly Theory) and tracks session highs and lows dynamically across these periods.
Current Session 90-Minute Quarters: Splits the active session into 90-minute intervals to highlight short-term liquidity structures and potential reaction zones.
Level Alerts: Tracks when each liquidity level is reached and enables customizable alerts so you don’t miss important price movements.
Use Case:
This tool provides an organized, time-based framework for identifying where liquidity is likely to concentrate across different timeframes and intraday cycles. Use these levels for forming bias, planning entries, exits, or anticipating price reactions at key points in the market structure.
Customization Options:
Enable/disable liquidity levels to display (Daily, Weekly, Monthly, Sessions, Session Quarters)
Customize the appearance of each level (color, style, line width)
Enable or disable tracking and alerts for level interactions

Triad QT - BetaQT Profiler is the ultimate tool for Quarterly Theory traders. It's great both for trading and backtesting purposes.
The indicator includes the following features:
- accurate plotting of quarters for cycles from micro to quadrennial, consistent across different markets
- plotting previous quarter high and previous quarter low with possibility of projecting it into next quarters
- plotting DFR for each cycle in convenient, clear way
- plotting True Opens with possibility of looking up higher cycle quarters on lower timeframe charts (you can look up even TYO on micro cycle!) in consistent manner
- plotting SSMTs both for present, as well as historical charts in vey fast fashion - priceless for backtesting and trading purposes
- 3 SSMT detection ways : wick above previous quarter high, close above previous quarter's high, close above previous quarter's highest close (vice versa for lows)
- possibility of choosing the triad you're using from drop down list, as well as setting up your custom triad
- fast performance due to unique coding solutions
------
Brought to you by Triad Trading Community
EmKa

True Opens [Dango]Description:
This True Open Indicator for Quarterly Theory is designed to assist traders in studying and backtesting Quarterly Theory, a time-based approach to interpreting market cycles. Quarterly Theory, as introduced by the Inner Circle Trader, suggests that time must be divided into quarters for proper analysis of market cycles.
Key concepts of Quarterly Theory:
The yearly cycle consists of four quarters, each comprising three months.
The monthly cycle consists of four quarters, each representing one week (excluding partial weeks).
The weekly cycle consists of four quarters, each representing one day (Monday to Thursday).
The daily cycle consists of four quarters, each representing six hours, aligning with the four main trading sessions (Asian, London, New York, and afternoon).
This indicator plots the true opens, which are crucial reference points in Quarterly Theory. True opens are the opening prices of the second quarter (Q2) of each cycle. They serve as a time-based filter for gauging market swings and determining entry points. When bullish, traders aim to buy below the true open, and when bearish, they aim to sell above it.
The true opens plotted by this indicator include:
Yearly true open
Monthly true open
Weekly true open
Daily true open
Asian session true open
London session true open
New York session true open
Afternoon session true open
The exact times of these true opens are not disclosed, as they are calculated using a proprietary method to ensure accuracy and reliability.
By clearly delineating these true opens on the chart, this indicator serves as a handy visual reference for those who have studied Quarterly Theory. It enables traders to easily identify these key reference points while studying price action across various time frames. It helps traders make informed decisions based on the principles of Quarterly Theory, enhancing their understanding of market cycles and potentially improving the accuracy of their trades.
To effectively utilize this indicator, traders should have a basic understanding of Quarterly Theory and its underlying concepts. The indicator can be used in conjunction with other tools and strategies to analyze price action and make trading decisions.
Please note that while this indicator is designed to assist in studying Quarterly Theory, it should not be considered a standalone trading system. Traders should always exercise caution and use appropriate risk management techniques when trading.
Originality and Usefulness:
This True Open Indicator for Quarterly Theory is a unique tool designed specifically to assist traders in studying and applying the concepts of Quarterly Theory. While there may be other indicators that plot certain opening prices, this indicator stands out by comprehensively plotting all the true opens across various time frames, as defined by Quarterly Theory. Not all
The key unique features of this indicator are:
It plots true opens based on the specific rules of Quarterly Theory, which are not commonly found in other indicators.
It covers a wide range of time frames, from yearly and monthly down to intraday sessions, providing a comprehensive view of market cycles.
The plotted true opens serve as time-based filters for gauging market swings and determining entry points, which is a distinct approach based on Quarterly Theory.
The true opens are calculated using a proprietary method that ensures accuracy and reliability.
The source code of this indicator is kept closed to protect the intellectual property and the proprietary algorithms used to accurately identify and plot the true opens based on Quarterly Theory. The closed-source nature also ensures that the indicator remains reliable and consistent, as it prevents unauthorized modifications that could lead to incorrect or misleading results.
By offering a unique and comprehensive tool for studying Quarterly Theory, this indicator provides significant value to traders seeking to enhance their understanding of market cycles and improve their trading accuracy. The closed-source approach is necessary to maintain the integrity and effectiveness of this specialized indicator.

Daye Quarterly Theory by toodegrees> Introduction and Acknowledgements
The Daye Quarterly Theory° tool encompasses the cyclical Time aspect of the markets as studied and developed by Daye (traderdaye on Twitter).
I am not the creator of this Theory, and I do not hold the answers to all the questions you may have; I suggest you to study it from Daye's tweets and material.
I collaborated directly with Daye to bring a comprehensive Time tool to Tradingview.
S/O to @a1tmaniac and @joshuuu for their previous works on this Theory.
> Tool Description
This is purely a graphical aid for traders to be able to quickly determine Daye's Quarterly Cycles, and save Time while on the charts.
The disruptive value of this tool is that it reliably plots forwards in Time, allowing you to strategize and tape read efficiently; as well as calculating all the Cycles, from Micro Sessions, to the Year.
> Quarterly Theory by Daye
The underlying idea is that Time is to be divided in Quarters for correct interpretation of Market Cycles. The specific starting point of a Cycle will depend on the Timeframe at hand.
Daye being one of the most prominent Inner Circle Trader students, these ideas stem from ICT's concepts themselves, and are to be used hand in hand (PD Array Matrix, PO3, Institutional Price Levels, ...).
These Quarters represent:
A - Accumulation (required for a cycle to occur)
M - Manipulation
D - Distribution
X - Reversal/Continuation
The latter are going to always be in this specific sequence; however the cycle can be transposed to have its beginning in X, trivially followed by A, M, and finally D.
This feature is not automatic and at the subjective discretion of the Analyst.
Note: this theory has been developed on Futures, hence its validity and reliability may change depending on the market Time.
This tool does provide a dynamic and auto-adapting aspect to different market types and Times, however they must be seen as experimental.
> Quarterly Cycles
The Quarterly Cycles currently supported are: Yearly, Monthly, Weekly, Daily, 90 Minute, Micro Sessions.
– Yearly Cycle:
Analogously to financial quarters, the year is divided in four sections of three months each
Q1 - January, February, March
Q2 - April, May, June (True Open, April Open)
Q3 - July, August, September
Q4 - October, November, December
Note: this Cycle is the most difficult to optimize as Timeframes become more granular due to the sheer length of its duration. With Time and advancements it will become more accurate. This is the only Cycle for which accuracy is not 100%.
– Monthly Cycle:
Considering that we have four weeks in a month, we start the cycle on the first month’s Monday (regardless of the calendar Day).
Q1 - Week 1, first Monday of the month
Q2 - Week 2, second Monday of the month (True Open, Daily Candle Open Price)
Q3 - Week 3, third Monday of the month
Q4 - Week 4, fourth Monday of the month
– Weekly Cycle:
Daye determined that although the trading week is composed by 5 trading days, we should ignore Friday, and the small portion of Sunday’s price action.
Q1 - Monday
Q2 - Tuesday (True Open, Daily Candle Open Price)
Q3 - Wednesday
Q4 - Thursday
– Daily Cycle:
The Day can be broken down into 6H quarters. These Times roughly define the sessions of the Trading Day, reinforcing the Theory’s validity.
Q1 - 18:00 - 00:00, Asian Session
Q2 - 00:00 - 06:00, London Session (True Open, Midnight New York Time)
Q3 - 06:00 - 12:00, NY Session
Q4 - 12:00 - 18:00, PM Session
Note: these Times are based on Futures Trading in New York Time, these will vary depending on the market type (experimental).
– 90 Minute Cycle:
Merely dividing one of the Daily Cycle’s Quarters we obtain 90 minute quarters. The first one in a Trading Day – 90min Cycles of the Asian Session – follows as an example, in New York Time.
Q1 - 18:00 - 19:30
Q2 - 19:30 - 21:00 (True Open)
Q3 - 21:00 - 22:30
Q4 - 22:30 - 00:00
– Micro Cycle:
Lastly, dividing a 90 Minute Cycle yields 22.5 Minute Quarters, known as Micro Sessions. An example breaking down the 90 Minute Cycle from 18:00 to 19:30 follows.
Q1 - 18:00 - 18:22:30
Q2 - 18:22:30 - 18:45 (True Open)
Q3 - 18:45 - 19:07:30
Q4 - 19:07:30 - 19:30
Note: trivially, these may not be exact unless the Timeframe is in the seconds, to correctly account for the half minute in each quarter – this said the tool is able to plot these anyways, although slight inaccuracy needs to be taken account depending on the Timeframe.
It is important to remember and be aware that the current chart’s Timeframe will heavily impact the plotted Time Cycles. This tool is in its initial form and it will be improved and adapted as traders start using it on a daily basis.
> Tool Settings
Plot Settings:
"Plot Type" will allow you to decide how the Cycles will be displayed. Out of the box the tool will be plotted on a separate pane, at the bottom of the chart; you can decide the orientation of the cycles from longest cycle at the bottom (Bottom Pane), or top (Top Pane). Alternatively you can move the tool to the chart and have the cycles plot on price (Move To -> Existing Pane Above), specifically above price (Top), or below (Bottom). The cycles will auto adjust their position based on the visible price action.
"Historical Cycles" will show previous Historical Cycles, up to where available in terms of script memory.
"Plot Size" will allow you to vary the height of the Cycle’s boxes
"Show Labels" will give you an auto-adapting legend which will help you determine which Cycle is which if you get lost.
The remaining Settings are self explanatory, allowing you to change colors, and choose which Cycles to see.
The source of the code is hidden due to the use of private libraries of mine. Happy to answer any questions in terms of code, where I will not be able to divulge any detail that concerns said libraries. Thank you for understanding!
Major thanks to Daye for his Time and Knowledge, it was a pleasure to collaborate and work together on this tool.
GLGT!
