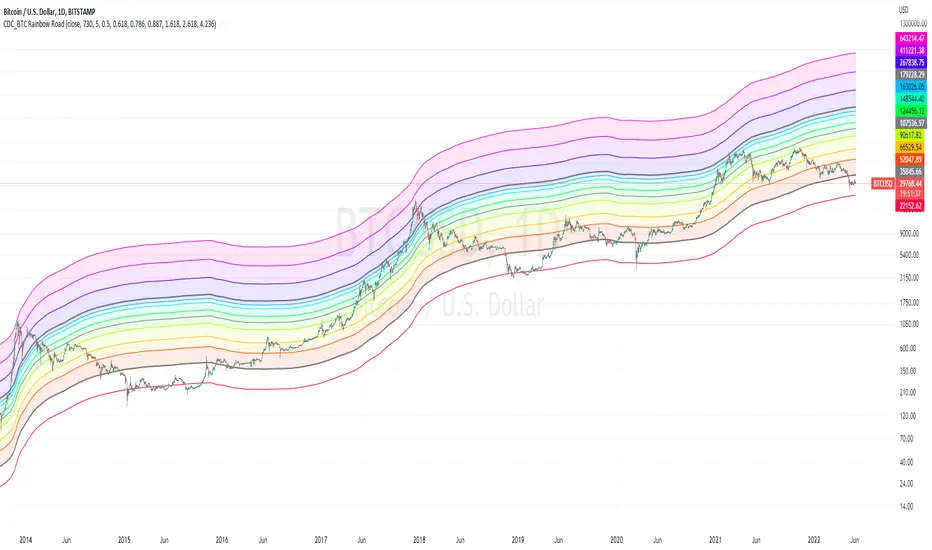
Ethereum Rainbow Chart (9 Levels with Legend)The Ethereum Rainbow Chart is a long-term, color-coded chart that displays Ethereum’s price on a logarithmic scale to show historical trends and growth patterns. It uses colored bands to highlight different price zones, helping to visualize how ETH’s price has moved over time without focusing on short-term fluctuations.
Pine Script®指標