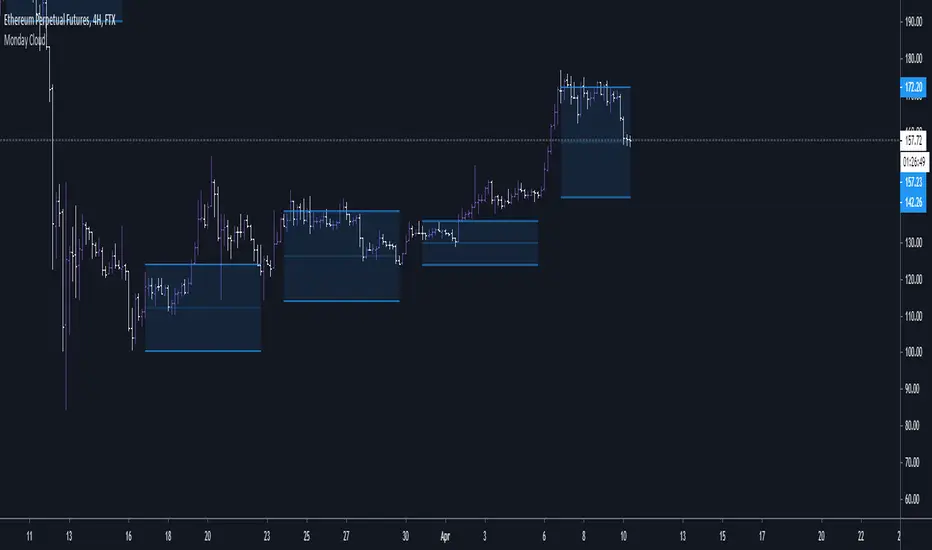
Range identifier by medianThis study tries to highlight ranges
as they are defined by
TradingLatino TradingView user.
The study uses median values.
A range is defined as periods when the price does not move a lot.
Its default values are aimed at BTCUSDT pair and 4h timeframe.
HOW IT WORKS
For each of the bars a '5' median is calculated based on the 'highest of open and close'
For each of the bars a '5' median is calculated based on the 'lowest of open and close'
Thanks to the desviation setting both medians
have a tolerated maximum and a minimum
Condition 1:
The bar current 'highest of open and close'
needs to be between the respective tolerated
maximum and minimum
Condition 2:
The bar current 'lowest of open and close'
needs to be between the respective tolerated
maximum and minimum
If both conditions are met
then the bar is in a range
SETTINGS
Price range periods : How many previous periods are used to calculate the medians
Price range maximum desviation (%) ( > 0 ): Maximum positive desviation for range detection
Price range minimum desviation (%) ( > 0 ): Mininum negative desviation for range detection
Desviations should be both of them a positive number
WARNING
Despite the name indicator does not identify the entire range.
It identifies when you realise you are inside a range.
E.g. If a range length is 8 periods length this range indicator
will highlight only the last 6 periods of the range.
USAGE
If your strategy signals you an upwards trend
then you might use this range detector
to know when to exit your long position
Why?
Because most of the times
the price is found to be
in a range it goes down
FEEDBACK 1
My former attempt on calculating ranges
felt too much over complex that is why
I decided to implement it with medians.
It should be easier to modify if
I want to desviation inputs to be calculated
automatically in the future.
I'm interested on different approaches on how to detect ranges.
FEEDBACK 2
I have only used this identifier in BTCUSDT 4h timeframe.
Feel free to comment down below with your suggested settings
for your favourite pair and timeframe
PINE SCRIPT TRICK
This script simulates looping an string char by char
in pine script.
Range

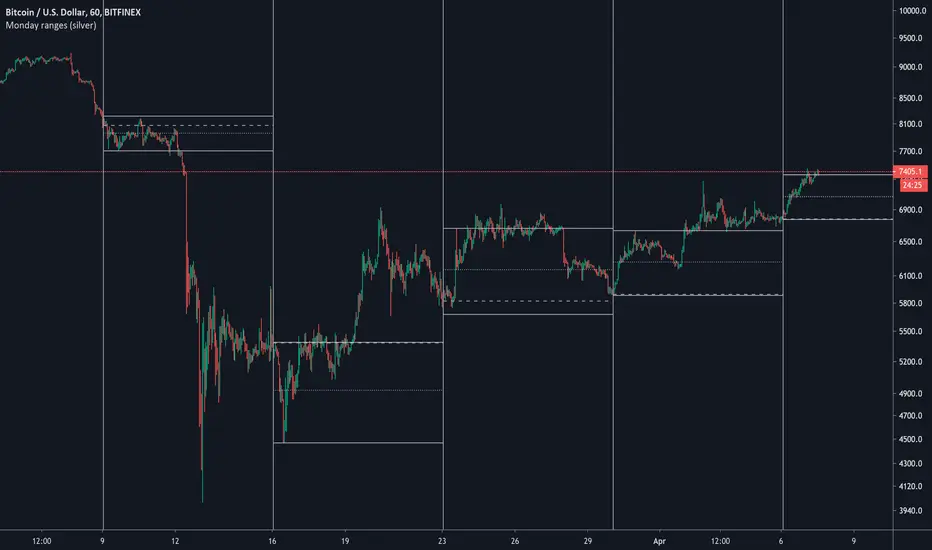
Range identifier by angleThis study tries to highlight ranges
as they are defined by
TradingLatino TradingView user.
A range according to its definition would consist of
periods when the price does not move a lot.
It's aimed at BTCUSDT pair and 4h timeframe.
HOW IT WORKS
Price source is the middle between open and close values.
For each of the bars a '5' periods regression line is calculated
The regression line has an angle with the 0-axis line
which might be between 0 and 90.
0 angle would mean price is always the same
90 angle would mean price going to infinity
When '2' of those periods in a row
have their angles between a maximum angle
and a minimum angle then you have the range
SETTINGS
Price range bar periods : How many previous periods are used to calculate the bar regression line
Price range range periods : How many periods in a row should be used to say that there is a range
Price range maximum angle ( < 90.0 !!! ): Maximum angle for range detection
Price range minimum angle ( > -90.0 !!! ): Mininum angle for range detection
Angles should be set from -89.99 for the minimum angle to +89.99 for the maximum angle
WARNING
Despite the name indicator does not identify the entire range.
It identifies when you realise you are inside a range.
E.g. If a range length is 8 periods length this range indicator
will highlight only the last 6 periods of the range.
USAGE
If your strategy signals you an upwards trend
then you might use this range detector
to know when to exit your long position
Why?
Because most of the times
the price is found to be
in a range it goes down
FEEDBACK 1
I'm quite sure this range approach by comparing angles is a novel one.
I have checked Range Identifier script from TradingView LazyBear user
and it uses another approach.
I'm interested on different approaches on how to detect ranges.
FEEDBACK 2
I have only used this identifier in BTCUSDT 4h timeframe.
I'm interested to know if applying it more traditional
stocks the degrees need to be adjusted to something
more smaller.
PINE SCRIPT TRICK
This script simulates looping an string char by char
in pine script.
CREDITS
I have reused and adapted some code from
'TF Segmented Linear Regression' script
which it's from TradingView alexgrover user.

Volume DensityA group of two indicators:
The "Volume Density" shows how much volume was thrown out relative to the covered price range.
The "Volume Density Bars" shows the same, but with colour on top of the bar chart.

Multiple SuperTrends - evoSupertrend is one of the most popular and easy to use indicators out there. Here are 15 supertrends each having a different ATR multiple from price. This can be used to find ranges (often followed by a reversal) or to create a filter for fake signals.
In the input tab "Spacing" you can change the space between each supertrend, setting this to 0 would be a normal supertrend. You can also change style, color, line width and transparency all in the input tab.
Pine code tip: Change line 21 to 'true' to make editable true.
Enjoy! :)

Rolling midpointsThe script made for research purposes which plots these statistics of a given window: Mid-range (max + min)/2, Lower midpoint (mid-range + min)/2, and Higher midpoint (mid-range + max)/2.
This could be interesting when checking periods with sample size <= 0, or checking distros with srs kurtosis values.
Mean & median are also there.

Time Range StatisticsA good amount of users requested a text box showing various price statistics, the following script returns various of these stats in a user-selected range, and include classical ones such as a central tendency measurement (mean), dispersion (normalized range) and percent change, but also include less common statistics such as average traded volume and number of gaps. The script also calculates the correlation between the closing price and another user-selected instrument.
The script is currently the longest one I ever made and took some efforts, as I wasn't satisfied with the statistics to be originally included. Big thx to Gael for the enormous feedback and the idea of the normalized range, to user @Cookiecrush for the feedback ( without ya I would have posted something bad you know umu ? ), and Lulidolce for the support, friendship is magic!
Selected Range
The setting Start determine the bar at which the range starts, while End determine at which bar the range end. To help you select these values, the current bar number (bar index) is displayed at the right of the indicator title in blue.
The setting evaluate to last bar will use a range starting at Start and ending at the last bar, as such you can use a full range by using Start = 0 and select evaluate to last bar
The range is highlighted by an area on the chart. By default Start = 9000 and End = 10000, you might not have this amount of data in your chart, as such use the displayed bar index to select Start and End, then set the settings as default.
Displayed Statistics
The statistics panel is displayed on the right side of the last bar, the panel has 3 sections, a title section who shows the symbol ticker, timeframe, and overall trends represented by a chart emoji, the overall trends are determined by comparing the number of higher highs with the number of lower low.
Below are displayed the date ranges with time format: year/month/day/hour:minute.
The second section shows the general statistics. The first one is the mean, also represented by the orange line in the chart, the blue line displayed represent the highest price value in the range, while the red one represents the lowest price value.
The second stat is the normalized range, and determine how spread is the price in the user-selected range, why not the standard deviation? Because the standard deviation might return results varying widely depending on the scale of the closing price, you could get measures such as 0.0156 or 16 or even 56 depending on the instrument, as such using a normalized range can be more appropriate as it lays in a range of (0,1). Lower values indicate a low degree of price variation. Note that I still want to find another measure in the future.
The percentage change (or relative change) indicates at which percentage the price has increased or decreased, and is calculated by subtracting the closing at bar Start with the price at bar End , divided by the price at bar End , the result is then multiplied by 100.
The average traded volume calculate the mean of the volume in the selected range, I used the same format used by the original volume indicator for clarity.
Finally, the last stats of the section is the number of gaps, this stat is by default hidden. An up gap is detected when the open price is superior to the previous high, while a down gap is detected when the open price is inferior to the previous low, this allow to only retain significant gaps.
The last section of the indicator panel shows the correlation between the closing price and another instrument, by default GOOG, this correlation is also calculated within the user-selected range. Positive values indicate a positive relationship, that is the two instruments tend to move in the same direction. Negative values indicate a negative relationship, both instruments tend to move in a direction opposite to each other. Values closer to 1 or -1 indicate a stronger relationship, while values closer to 0 indicate no relationship.
In Summary
The script shows various stats, each calculated within a user-selected range, in general one would be more interested in how these stats might evolve with time, but checking them in a custom range can be quite interesting.
Thx for reading. umu

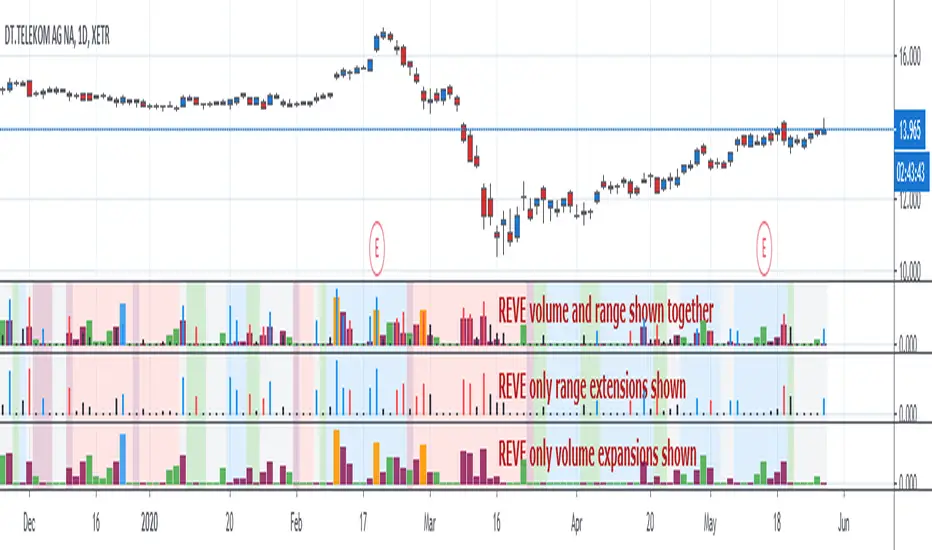
REVEREVE is abbreviation from Range Extension Volume Expansion. This indicator shows these against a background of momentum. The histogram and columns for the range and volume rises ara calculated with the same algorithm as I use in the Volume Range Events indicator, which I published before. Because this algorithm uses the same special function to assess 'normal' levels for volume and range and uses the same calculation for depicting the rises on a scale of zero through 100, it becomes possible to compare volume and range rises in the same chart panel and come to meaningful conclusions. Different from VolumeRangeEvents is that I don't attempt to show direction of the bars and columns by actually pointing up or down. However I did color the bars for range events according to direction if Close jumps more than 20 percent of ATR up or down either blue or red. If the wider range leads to nothing, i.e. a smaller jump than 20 percent, the color is black. You can teak this in the inputs. The volume colums ar colored according to two criteria, resulting in four colors (orange, blue, maroon, green). The first criterium is whether the expansion is climactic (orange, blue) or moderate (maroon, green). I assume that climactic (i.e. more than twice as much) volume marks the beginning or end of a trend. The second criterium looks at the range event that goes together with the volume event. If lots of volume lead to little change in range (blue, green), I assume that this volume originates from institutional traders who are accumulating or distributing. If wild price jumps occur with comparatively little volume (orange, maroon, or even no volume event) I assume that opportunistic are active, some times attributing to more volume.
For the background I use the same colors calculated with the same algorithm as in the Hull Agreement Indicator, which I published before. This way I try to predict trend changes by observation of REVE.
Separated ATR - evoThis script plots two ATR (Average True Range) values, one based on only bullish and the other based on only bearish bars. If the current bar is positive, the negative ATR will use its last known negative bar for the calculation. You can smooth bar directions by using the Heikin Ashi setting.
Use this the same way how you would use the regular ATR indicator, but with the added value of knowing which side of the market has more volatility.

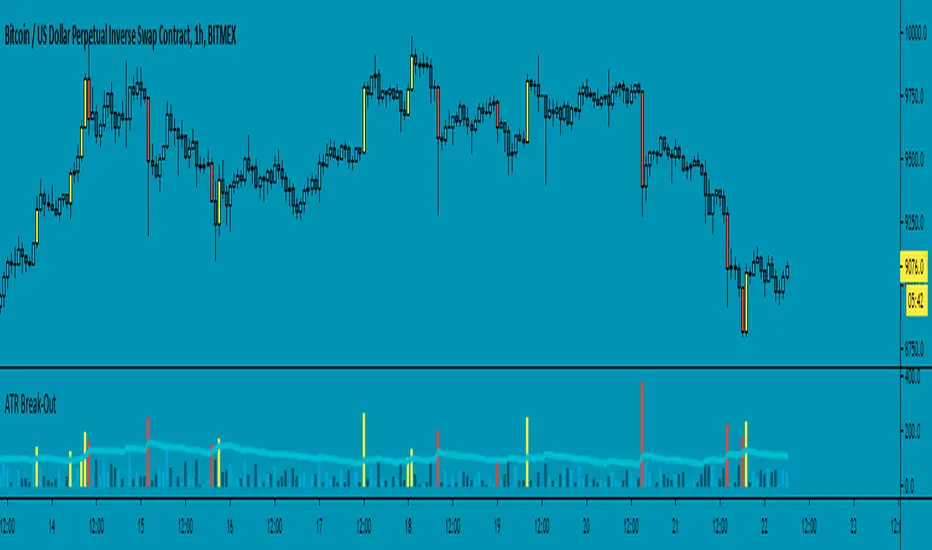
ATR Break-Out - evoThis script measures candle length and average true range (ATR). A break out occurs when a candle is larger than the given ATR value. You can choose to calculate length from wicks or from the body (open & close).
You can use this as trend direction indicator by following the last break out candle or open a position after a break out with a stop just above or below the candle. Enjoy!
ATR Timeframe RangeThis indicator shows the ATR range on the daily or any other timeframe on your current chart. All settings are fully customize-able.

Ranged Candle Length - evoSimilar to one of my previous scripts 'Ranged Volume', but instead of using volume, this script uses candle length mirrored. It creates a range using highest and lowest of a given period. When the range gets larger, it means the current candle is bigger than the largest candle of your given period (break-out).
Yellow = Bullish break out
Red = Bearish break out
A good way to use this is to follow the direction of the last break-out candle or open a position with a stop just below or above the candle (that's how I tested it real time).
Good luck!

[FN] Session Range & Date Range For BacktestingThis has been done before in different ways, however, my goal is to publish a single, simplified copy/paste version of the idea so you can quickly and easily incorporate it into your strategy backtesting.
You can designate weekdays, weekdays + weekends for 24/7 markets, and also session range.
So, you trade bitcoin? It works. CME futures? It works. You are a discretionary trader so the only signals that matter are the ones that happen when you're awake? It works. Copy and paste.
The goal is that its that easy. You'll have to let me know if it is. glhf everyone.
If I'm not mistaken, you should be able to copy/paste this directly into your strategy script (Paste it in before your entry declarations). Just leave out the last 2 lines where the bgcolor() is declared... unless you want the background color lit up, that's up to you. It's just for demonstration purposes in this script.
After you've pasted it in, then in your strategy.entry() function you are adding: to the strategy.entry() function.
e.g:
strategy.entry("Long", strategy.long, qty=1, when = ENTRY_SIGNAL and signal_backtest())
Shoutouts to @zenandtheartoftrading and @allanster for providing the basis of this code that I put together here. We stand on the shoulders of giants.

ATR _NormalizedThis script is good to use with Williams %R indicator, to find out when price has bottomed out.
ATR has to be over 90 and Williams %R ( lenght 52 ) has to be over 95 to find out level around which one is good to buy.
You can check back, to see that this worked very well over history. Best way to use this 2 indicators is with DCA ( dollar cost average ), as area where to buy can go a little bit down and up for as long as few months. So dont just jump in, use DCA .

ORB- Range break outThis script has below features
> Option to choose the bar number for considering break out
> Option to choose the targets based on the candle size
> Option to choose the budget and based on that it will show the quantity to trade
> SL is the candle range
> Can use it in any time frame

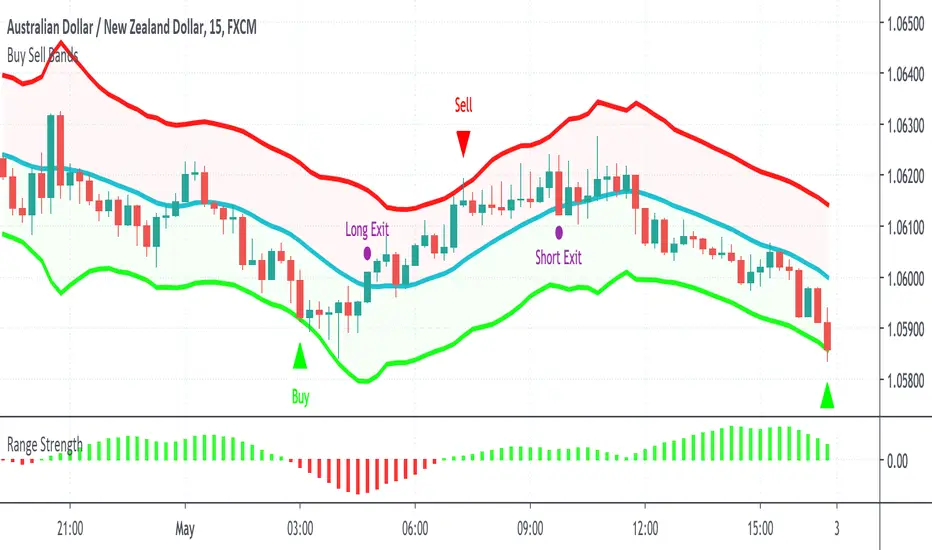
Range StrengthRange Strength is a super simple indicator designed for the mean reversion (range trading) strategy, it shows you how strong the market is ranging or trending. When the indicator is positive (green color) the market is a range mode, when the indicator is negative (red color) it is in a trending mode.
It's best used together with our Buy Sell Bands indicator to identify entry and exit signals within the range, ideally only taking trades when the Range Strength indicator is showing positive (green) readings.
How Is It Different From Other Indicators?
- Designed specifically for the mean reversion (range trading) strategy
- Shows one simple reading and graphical representation of range strength
- Identify the best times to take mean reversion trades versus trend trades
- Works well in conjunction with the Buy Sell Bands indicator to validate entry & exit signals
- Can be applied to all markets and timeframes
How To Use The Indicator?
1) Visit our website URL shown below this description and signup
2) We will then grant your TradingView username permission to use our indicators
3) Go to your Indicators window, then the Invite-Only section and add our indicators to your chart
4) Our indicators will then show on every chart you now look at
5) You can set up alerts to be notified in real time of trading signals from our indicators
6) Read our user manual for all the best tips on how to use our indicators as part of a range trading strategy
7) Feel free to reach out to us for personal one-on-one help with getting setup
What Markets and Conditions Does It Work Best On?
All markets cycle between trending and ranging modes, and the key to successfully using our indicators is identifying when the market is in or about to go into a range trading mode, and as such it can be applied to all markets and timeframes.
Some markets and timeframes trade within ranges more predictably than others, for example Forex, Cryptocurrencies, and Futures on the 15 minute timeframe during the US night session can work well due to the lack of price sensitive news creating lasting trends. With Stocks & ETFs on the 5 minute timeframe during the midday session on large cap blue chip stocks with no recent news releases can show strong range trading environments to use our indicators in.
In addition to single markets, you can also use our indicators on pair charts, for example Coca Cola(KO) versus Pepsi(PEP), you can do this by entering KO/PEP inside your TradingView chart quote box and it will bring up a pair chart. Our indicators will show buy and sell signals right on the pair chart just like any other single instrument chart. You can get very creative with what type of pairs you can come up with.
Our indicators are primarily designed for day trading and swing trading, however they can also be used for position trading and investing by identifying technically oversold and overbought range levels that are based on current and past volatility around a dynamic average price, for this we recommend using a weekly chart to identify longer trading opportunities.
As always indicators should be used as part of a trading strategy to assist in making decisions, you can't just blindly follow every signal they produce, you should always seek to compliment technical trading signals with additional analysis to reduce your risk and increase your odds of making a winning trade.
Examples Of Use On Various Markets and Timeframes
GBP vs CHF Forex Pair 15 Minute Chart
Tesla Stock 1 Minute Chart
Bitcoin vs USD Crypto Pair 15 Minute Chart
Micro E-Mini SP500 Futures 1 Minute Chart
Mastercard vs Visa Stock Daily Pair Chart
To gain access to the Range Strength and Buy Sell Bands Indicators visit our website shown below.
Happy Range Trading :)

Buy Sell BandsBuy Sell Bands is a super simple indicator based on the mean reversion (range trading) strategy that shows you exactly where to buy, sell and close trades on every chart, market and timeframe.
It's best used together with our Range Strength indicator to identify when the market is in a range mode, this is the best time to take the entry signals from the Buy Sell Bands.
How Is It Different From Other Indicators?
- Designed specifically for the mean reversion (range trading) strategy
- Upper and lower bands are based on current and past volatility
- Aren't as sensitive to "squeezes" after periods of contracted volatility
- Works well in conjunction with the Range Strength Indicator to confirm entry signals
- Helps identify good "pair trading" opportunities
- Can be applied to all markets and timeframes
How To Use The Indicator?
1) Visit our website URL shown below this description and signup
2) We will then grant your TradingView username permission to use our indicators
3) Go to your Indicators window, then the Invite-Only section and add our indicators to your chart
4) Our indicators will then show on every chart you now look at
5) You can set up alerts to be notified in real time of trading signals from our indicators
6) Read our user manual for all the best tips on how to use our indicators as part of a range trading strategy
7) Feel free to reach out to us for personal one-on-one help with getting setup
What Markets and Conditions Does It Work Best On?
All markets cycle between trending and ranging modes, and the key to successfully using these indicators is identifying when the market is in or about to go into a range trading mode, and as such it can be applied to all markets and timeframes.
Some markets and timeframes trade within ranges more predictably than others, for example Forex, Cryptocurrencies, and Futures on the 15 minute timeframe during the US night session can work well due to the lack of price sensitive news creating lasting trends. With Stocks & ETFs on the 5 minute timeframe during the midday session on large cap blue chip stocks with no recent news releases can show strong range trading environments to use our indicators in.
In addition to single markets, you can also use our indicators on pair charts, for example Coca Cola(KO) versus Pepsi(PEP), you can do this by entering KO/PEP inside your TradingView chart quote box and it will bring up a pair chart. Our indicators will show buy and sell signals right on the pair chart just like any other single instrument chart. You can get very creative with what type of pairs you can come up with.
Our indicators are primarily designed for day trading and swing trading, however they can also be used for position trading and investing by identifying technically oversold and overbought range levels that are based on current and past volatility around a dynamic average price, for this we recommend using a weekly chart to identify longer trading opportunities.
As always indicators should be used as part of a trading strategy to assist in making decisions, instead of just blindly following every signal they produce you should always seek to compliment technical trading signals with additional analysis to reduce your risk and increase your odds of making a winning trade.
Examples Of Use On Various Markets and Timeframes
GBP vs CHF Forex Pair 15 Minute Chart
Tesla Stock 1 Minute Chart
Bitcoin vs USD Crypto Pair 15 Minute Chart
Micro E-Mini SP500 Futures 1 Minute Chart
Mastercard vs Visa Stock Daily Pair Chart
To gain access to the Buy Sell Bands and Range Strength Indicators visit our website shown below.
Happy Range Trading :)
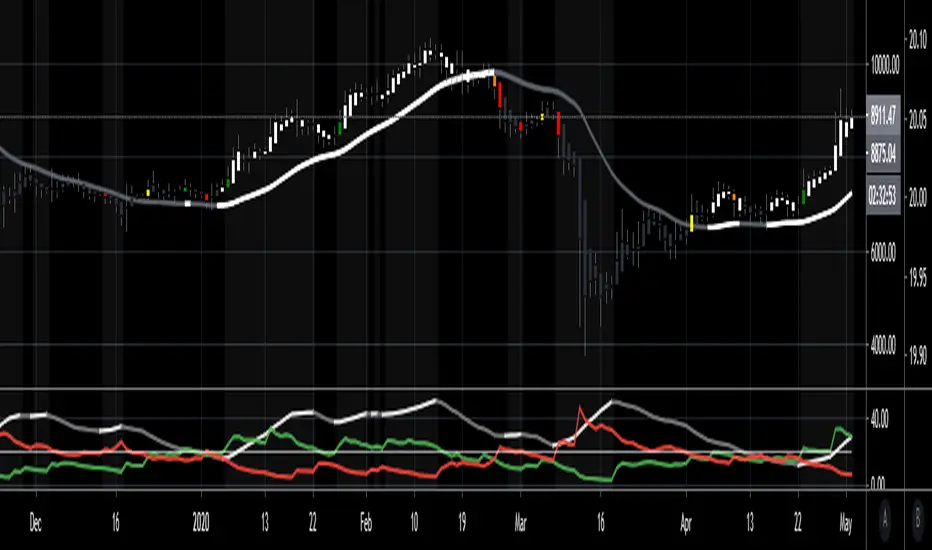
ADX TREND GODADX trend with bar color and background color for strength of trend. Use yellow bar for alert of possible uptrend, use orange bar for alert of possible downtrend. Green bar indicates a strong move upward, red indicates a strong move downward. Background will lighten (can change to any shade) for duration of trend. Exit trend, or TP, when background returns to normal. ADX below threshold is chop. Add this indicator to the main chart as well, and delete all of the indicators, except for background.
Works best with a trending indicator - as pictured in the image above
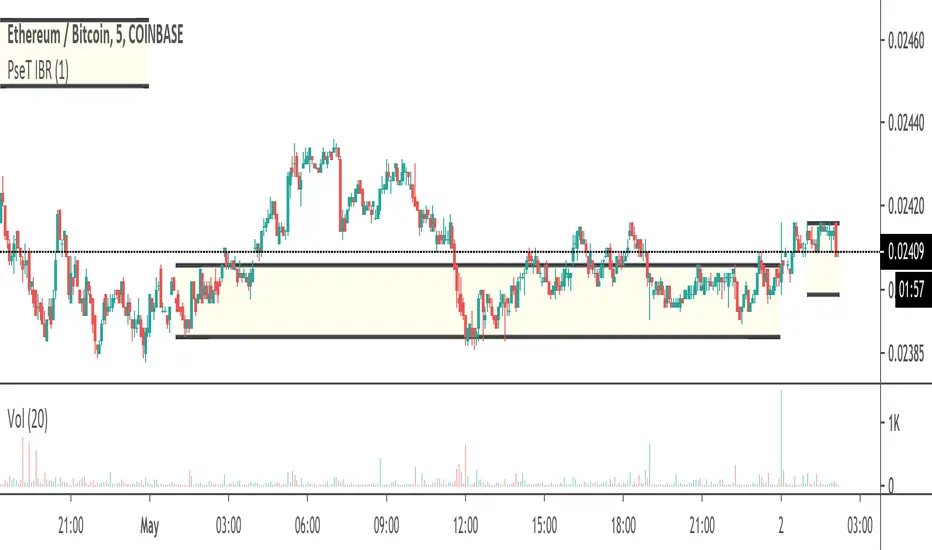
PseT Initial Balance Range (IBR)The Initial Balance is the range high and low printed on the first hour of the session.
It's meant for intraday trading and can be used as support/resistance.
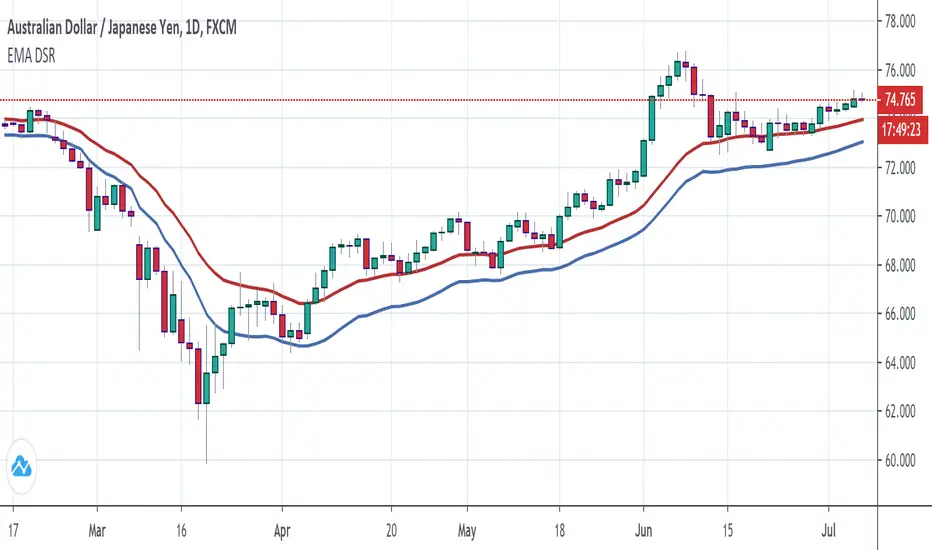
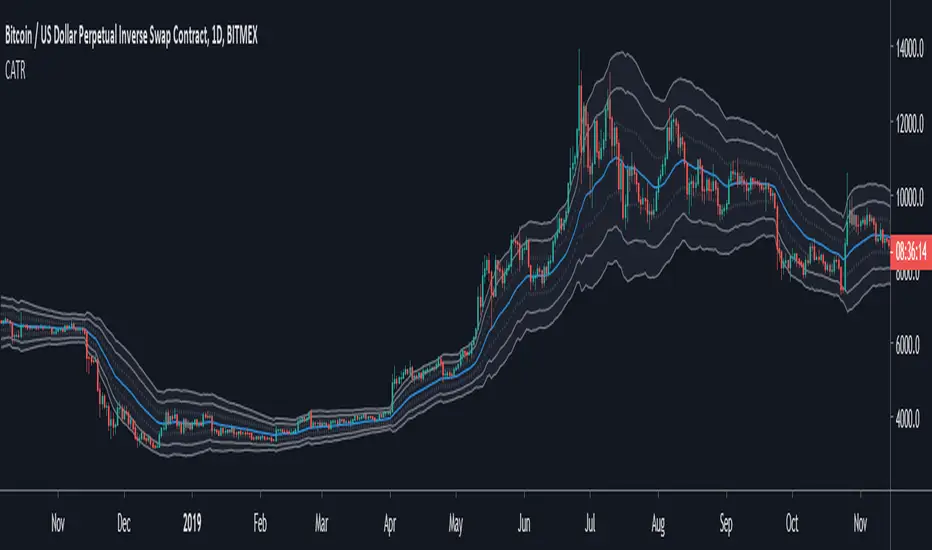
Channel ATR1 - What is the Channel ATR indicator
This is an envelope indicator (like the Bollinger bands indicator) used to evaluate how much the price diverge from it's moving average.
This indicator can be used as a system on it's own. I recommend to use it when the market goes side way, although, you can also use it when the market is trending.
What makes this indicator so relevant and reliable ? The use of the ATR to build the envelope. Read below if you wan to know more.
2 - How is the Channel ATR computed
The main component is an EMA. The envelope is made of 3 layers, each is the Average True Range, plot at a multiple distance from the EMA (1*EMA, 2*EMA, 3*EMA) . If you don't know what is the ATR, it's basically a measure of the volatility (you can read more about it here ).
Each layer of the envelope is a multiple of the measure of the volatility. Let's see how to use it.
3 - How to use the Channel ATR indicator
You can use this indicator in different strategies :
- Return to the mean: When the price goes out of the envelope, it's an excess of the market. You can take advantage of this by betting to a return to the EMA value.
- Trend following : If the market is tending, you can buy/sell when the price touch the EMA and place a target at another level in the envelope.
- Stop loss: Since each envelope layer is built from the ATR (i.e. the volatility), you can use it to place your stop at least at 1 ATR from your entry, to not be hit by the market noise.
- Find your own way : The Channel ATR is a very rich and powerful indicator, you can try to built your own trading system on the top of it.
VPTbollfib & Camarilla (Danarilla)I do not own the original indicators. This is just a combination of the two because of their nature to work in a similar way.
Camarilla Pivots run on the basis of intraday range trading. Usually after daily open you look the fade whatever move happened before. by shorting R3/H3 levels or longing R3/L3. Targeting the other side of the range. This is the infamous PivotBoss level calculations and you would want to activate camarilla and turn off the normal pivots. They use the previous days volatility to plot the next days levels.
But what about some confirmation?
Well RafaelIzoni (who made it open source for improvement) threw together this VPTbollfib. It is volume price trend crossing down a fib line using bollinger bands as price envelope. The beauty of this is that It will signal usually counter to current price action based on selling into uptrends or vise versa. Meaning you get signals to counter price. Which is what you might be looking for on range day trade scalps for camarilla. A wick reversal or engulfing + volume based signal is a very happy pairing together. And those signals are usually suitable for the target of the range you are day trading. Hourly time frame works quite well for both. And camarilla should also be on daily settings.
Special Thanks to Nanda (who published the pivotboss indicator AND) Helped to merge the scripts together.
This indicator alone is an entire trade system. Camarilla already is. If you know the rules. it can be used for entries, exits, risk management to trade the range on TREND, COUNTER TREND, and BREAKOUT plays. The bollinger band fibs add confirmation to the trends levels. And the VPT adds a secondary confirmation to take a camarilla trade.
Try it out. I think you will find both the levels on camarilla and the VPT signals quite suprising.