Daily RVOL (Raw) SMA/EMA + Surge Marker - TP## Daily RVOL (Raw) SMA/EMA + Surge Marker (TP)
This indicator helps you spot **unusual institutional-style participation** by measuring **Daily Relative Volume (RVOL)** and highlighting **sudden RVOL “surges”** compared to the prior day.
### What it shows
**RVOL (raw)** is a ratio:
**RVOL = Today’s Daily Volume ÷ Average Daily Volume (lookback)**
* **1.00x** = normal volume
* **1.50x** = ~50% above normal
* **2.00x** = ~2x normal
The “Average Daily Volume” baseline can be calculated using either:
* **SMA** (simple average), or
* **EMA** (faster-reacting average)
The baseline uses **completed daily bars only**, so it won’t be distorted by a partially completed day.
### Surge Marker (Circle)
The circle prints when **today’s RVOL jumps significantly vs yesterday’s RVOL**:
**RVOL Surge % = (RVOL Today ÷ RVOL Prev − 1) × 100**
So if your surge threshold is **80%**, the circle triggers when:
**RVOL Today ≥ 1.80 × RVOL Prev**
This is meant to detect **volume acceleration**—not just “high volume,” but a **step-change** in participation.
### How to use it (in plain English)
Think of RVOL as a **crowd-size meter**, and the surge circle as a **“big money showed up today”** alert.
It does **not** directly label buy vs sell—it highlights **participation**. Direction comes from price action and context.
### Bullish vs Bearish clues (price + volume together)
Use the circle as a clue, then read the candle and key levels:
**Potential bullish signs**
* Breakout/reclaim of resistance + surge circle (strong confirmation)
* Strong up day (wide range, closes near highs) + surge circle
* **High volume down-close that *does NOT* break lower lows** (holds support)
→ Often means selling pressure was absorbed and price held the line. This can be a **bullish “support/absorption” tell**, especially if the next day confirms with strength.
**Potential bearish signs**
* Breakdown below support + surge circle (distribution confirmation)
* Rejection at resistance on surge circle (supply showing up)
* **High volume up-close that *fails to make higher highs* / can’t push through resistance**
→ Often suggests buying effort was met by strong supply (selling into strength). This can be a **bearish “stall/failure” tell**, especially if the next day confirms with weakness.
### Suggested settings
* **RVOL Length:** 20 is a solid default
* **SMA vs EMA:**
* SMA = smoother baseline
* EMA = reacts faster to recent volume changes
* **Surge Threshold:**
* **80–150%** = rare “shock” participation (fewer, stronger signals)
* **40–80%** = balanced signals
* **10–40%** = more signals, more noise
### Best practice
Use RVOL + surge circles as **confirmation**, not a standalone entry/exit:
* Combine with trend, support/resistance, and candle structure.
* The surge circle says **“participation surged”**—price action tells you **whether it’s accumulation (support) or distribution (supply).**
*(Educational use only. Not financial advice.)*
Rateofchangestrategy

AJFFRSI+QQEROC Uses Jurik RSI for smooth, responsive momentum measurement
Incorporates QQE features for trend strength and dynamic trailing stop signals
Designed for clearer, more reliable overbought/oversold and reversal signals on TradingView
Suitable for intraday, swing, and longer-term analysis
Not a financial advice. DYOR

Multi Rate of Change (ROC) - 3 LinesMulti Rate of Change (ROC) - 3 Lines
This custom indicator displays three Rate of Change (ROC) lines, each with independently adjustable lookback periods (default: 7, 30, and 100 days). It allows you to quickly compare short-, mid-, and long-term price momentum on the same chart.
All ROC lines show the percent change of the close price compared to N bars ago.
The color, thickness, and style (solid, dotted, dashed) of each ROC line can be customized in the settings.
A zero reference line is included and can also be customized.
Suitable for momentum analysis and identifying trend acceleration or deceleration at multiple timeframes.
Designed for easy use: simply add the indicator to your chart and adjust the settings as needed.
How to use:
Add the indicator to your chart.
Set each ROC period (e.g., 7, 30, 100 days) as desired.
Adjust colors, line widths, and styles for better visibility.
Interpret positive ROC values as upward momentum, negative values as downward momentum.
No repainting. All calculations use close prices only.
If you need more ROC lines or additional features, let me know!

PRO Investing - Apex EnginePRO Investing - Apex Engine
1. Core Concept: Why Does This Indicator Exist?
Traditional momentum oscillators like RSI or Stochastic use a fixed "lookback period" (e.g., 14). This creates a fundamental problem: a 14-period setting that works well in a fast, trending market will generate constant false signals in a slow, choppy market, and vice-versa. The market's character is dynamic, but most tools are static.
The Apex Engine was built to solve this problem. Its primary innovation is a self-optimizing core that continuously adapts to changing market conditions. Instead of relying on one fixed setting, it actively tests three different momentum profiles (Fast, Mid, and Slow) in real-time and selects the one that is most synchronized with the current price action.
This is not just a random combination of indicators; it's a deliberate synthesis designed to create a more robust momentum tool. It combines:
Volatility analysis (ATR) to generate adaptive lookback periods.
Momentum measurement (ROC) to gauge the speed of price changes.
Statistical analysis (Correlation) to validate which momentum measurement is most effective right now.
Classic trend filters (Moving Average, ADX) to ensure signals are only taken in favorable market conditions.
The result is an oscillator that aims to be more responsive in volatile trends and more stable in quiet periods, providing a more intelligent and adaptive signal.
2. How It Works: The Engine's Three-Stage Process
To be transparent, it's important to understand the step-by-step logic the indicator follows on every bar. It's a process of Adapt -> Validate -> Signal.
Stage 1: Adapt (Dynamic Length Calculation)
The engine first measures market volatility using the Average True Range (ATR) relative to its own long-term average. This creates a volatility_factor. In high-volatility environments, this factor causes the base calculation lengths to shorten. In low-volatility, they lengthen. This produces three potential Rate of Change (ROC) lengths: dynamic_fast_len, dynamic_mid_len, and dynamic_slow_len.
Stage 2: Validate (Self-Optimizing Mode Selection)
This is the core of the engine. It calculates the ROC for all three dynamic lengths. To determine which is best, it uses the ta.correlation() function to measure how well each ROC's movement has correlated with the actual bar-to-bar price changes over the "Optimization Lookback" period. The ROC length with the highest correlation score is chosen as the most effective profile for the current moment. This "active" mode is reflected in the oscillator's color and the dashboard.
Stage 3: Signal (Normalized Velocity Oscillator)
The winning ROC series is then normalized into a consistent oscillator (the Velocity line) that ranges from -100 (extreme oversold) to +100 (extreme overbought). This ensures signals are comparable across any asset or timeframe. Signals are only generated when this Velocity line crosses its signal line and the trend filters (explained below) give a green light.
3. How to Use the Indicator: A Practical Guide
Reading the Visuals:
Velocity Line (Blue/Yellow/Pink): The main oscillator line. Its color indicates which mode is active (Fast, Mid, or Slow).
Signal Line (White): A moving average of the Velocity line. Crossovers generate potential signals.
Buy/Sell Triangles (▲ / ▼): These are your primary entry signals. They are intentionally strict and only appear when momentum, trend, and price action align.
Background Color (Green/Red/Gray): This is your trend context.
Green: Bullish trend confirmed (e.g., price above a rising 200 EMA and ADX > 20). Only Buy signals (▲) can appear.
Red: Bearish trend confirmed. Only Sell signals (▼) can appear.
Gray: No clear trend. The market is likely choppy or consolidating. No signals will appear; it is best to stay out.
Trading Strategy Example:
Wait for a colored background. A green or red background indicates the market is in a tradable trend.
Look for a signal. For a green background, wait for a lime Buy triangle (▲) to appear.
Confirm the trade. Before entering, confirm the signal aligns with your own analysis (e.g., support/resistance levels, chart patterns).
Manage the trade. Set a stop-loss according to your risk management rules. An exit can be considered on a fixed target, a trailing stop, or when an opposing signal appears.
4. Settings and Customization
This script is open-source, and its settings are transparent. You are encouraged to understand them.
Synaptic Engine Group:
Volatility Period: The master control for the adaptive engine. Higher values are slower and more stable.
Optimization Lookback: How many bars to use for the correlation check.
Switch Sensitivity: A buffer to prevent frantic switching between modes.
Advanced Configuration & Filters Group:
Price Source: The data source for momentum calculation (default close).
Trend Filter MA Type & Length: Define your long-term trend.
Filter by MA Slope: A key feature. If ON, allows for "buy the dip" entries below a rising MA. If OFF, it's stricter, requiring price to be above the MA.
ADX Length & Threshold: Filters out non-trending, choppy markets. Signals will not fire if the ADX is below this threshold.
5. Important Disclaimer
This indicator is a decision-support tool for discretionary traders, not an automated trading system or financial advice. Past performance is not indicative of future results. All trading involves substantial risk. You should always use proper risk management, including setting stop-losses, and never risk more than you are prepared to lose. The signals generated by this script should be used as one component of a broader trading plan.

rate_of_changeLibrary "rate_of_change"
// @description: Applies ROC algorithm to any pair of values.
// This library function is used to scale change of value (price, volume) to a percentage value, just as the ROC indicator would do. It is good practice to scale arbitrary ranges to set boundaries when you try to train statistical model.
rateOfChange(value, base, hardlimit)
This function is a helper to scale a value change to its percentage value.
Parameters:
value (float)
base (float)
hardlimit (int)
Returns: per: A float comprised between 0 and 100

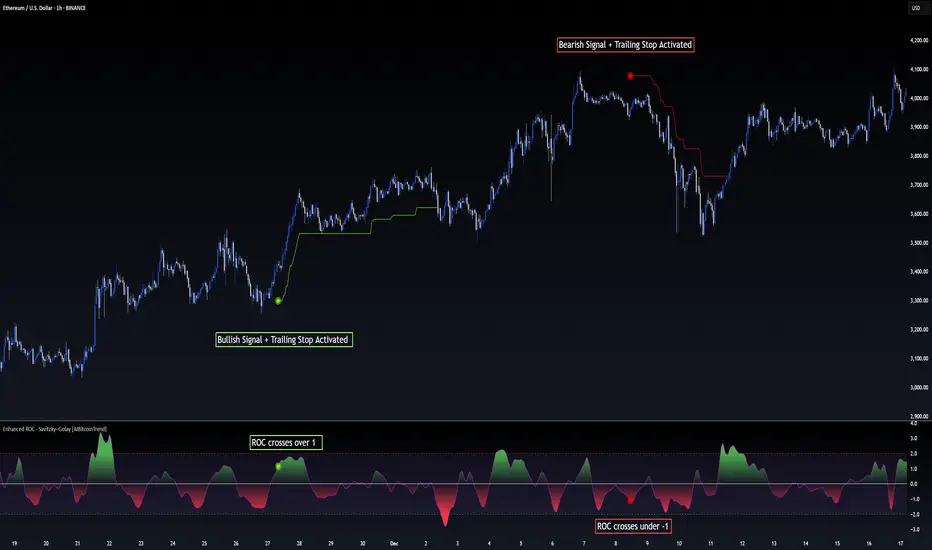
Enhanced ROC - Savitzky–Golay [AIBitcoinTrend]👽 Adaptive ROC - Savitzky–Golay (AIBitcoinTrend)
The Adaptive ROC - Savitzky–Golay redefines traditional Rate of Change (ROC) analysis by integrating Savitzky–Golay smoothing with volatility-adaptive normalization, allowing it to dynamically adjust across different market conditions. Unlike the standard ROC, which reacts rigidly to price changes, this advanced version refines trend signals while maintaining responsiveness to volatility.
Additionally, this indicator features real-time divergence detection and an ATR-based trailing stop system, equipping traders with a powerful toolset for momentum analysis, reversals, and trend-following strategies.
👽 What Makes the Adaptive ROC - Savitzky–Golay Unique?
Unlike conventional ROC indicators, this enhanced version leverages volatility-adjusted scaling and Z-score normalization to improve signal consistency across different timeframes and assets.
✅ Savitzky–Golay Smoothing – Reduces noise while preserving trend structure for clearer signals.
✅ Volatility-Adaptive Normalization – Ensures that overbought and oversold thresholds remain consistent across different markets.
✅ Real-Time Divergence Detection – Identifies early bullish and bearish divergence signals for potential reversals.
✅ Crossovers & ATR-Based Trailing Stops – Implements intelligent trade management with dynamic stop levels.
👽 The Math Behind the Indicator
👾 Savitzky–Golay Smoothing
The indicator applies a Savitzky–Golay filter to the raw ROC data, creating a smoother curve while preserving key inflection points. This technique prevents excessive lag while maintaining the integrity of price movements.
sg_roc = (roc_raw + 3*roc_raw + 5*roc_raw + 7*roc_raw + 5*roc_raw + 3*roc_raw + roc_raw ) / 25
👾 Volatility-Adaptive Scaling
By dynamically adjusting the smoothed ROC using standard deviation, the indicator ensures that momentum readings remain relative to the market’s current volatility.
volatility = ta.stdev(close, rocLength)
dynamicFactor = 1 / (1 + volatility / 100)
advanced_sg_roc = sg_roc * dynamicFactor
👾 Z-Score Normalization
To maintain a stable Overbought/Oversold structure across different markets, the ROC is normalized using a Z-score transformation, ensuring its values remain statistically relevant.
rocMean = ta.wma(advanced_sg_roc, lenZ)
rocStdev = ta.stdev(advanced_sg_roc, lenZ)
zRoc = (advanced_sg_roc - rocMean) / rocStdev
👽 How Traders Can Use This Indicator
👾 Divergence Trading Strategy
Bullish Divergence Setup:
Price makes a lower low, while the ROC forms a higher low.
A buy signal is confirmed when the ROC starts rising.
Bearish Divergence Setup:
Price makes a higher high, while the ROC forms a lower high.
A sell signal is confirmed when the ROC starts declining.
👾 Buy & Sell Signals with Trailing Stop
Bullish Setup:
✅ ROC crosses above the bullish trigger level → Buy Signal.
✅ A bullish trailing stop is placed at Low - (ATR × Multiplier).
✅ Exit if price crosses below the stop.
Bearish Setup:
✅ ROC crosses below the bearish trigger level → Sell Signal.
✅ A bearish trailing stop is placed at High + (ATR × Multiplier).
✅ Exit if price crosses above the stop.
👽 Why It’s Useful for Traders
Savitzky–Golay Filtering – Retains essential trend details while eliminating excessive noise.
Volatility-Adjusted Normalization – Makes overbought/oversold levels universally reliable across markets.
Real-Time Divergence Alerts – Identifies early reversal signals for optimal entries and exits.
ATR-Based Risk Management – Ensures stops dynamically adapt to market conditions.
Works Across Markets & Timeframes - Suitable for stocks, forex, crypto, and futures trading.
👽 Indicator Settings
ROC Period – Defines the number of bars used for ROC calculation.
Smoothing Strength – Adjusts the degree of Savitzky–Golay filtering.
Volatility Scaling – Enables or disables the adaptive volatility factor.
Enable Divergence Analysis – Turns on real-time divergence detection.
Lookback Period – Specifies the pivot detection period for divergences.
Enable Crosses Signals – Activates trade signals based on ROC crossovers.
ATR Multiplier – Controls the sensitivity of the trailing stop.
Disclaimer: This indicator is designed for educational purposes and does not constitute financial advice. Please consult a qualified financial advisor before making investment decisions.