Inflation CorrelationHeyo fellas,
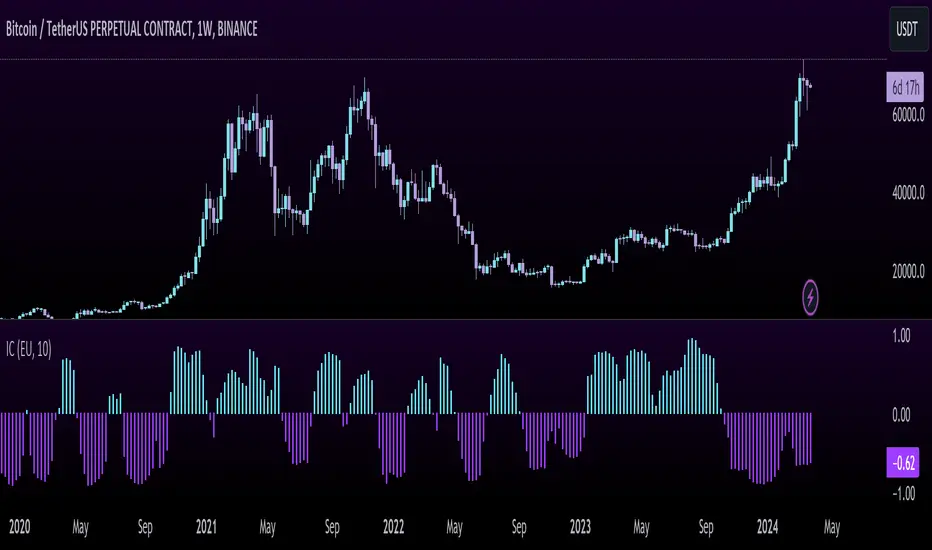
In today’s dynamic economic landscape, understanding the relationship of market prices to other economical factors like inflation rate is crucial. The Inflation Correlation Indicator is designed to provide traders with a clear visualization of this relationship. By correlating average inflation rates from selected countries with market closing prices, this indicator offers a unique perspective on potential market movements influenced by inflationary trends.
Features:
Country Selection: Choose from the European Union (EU), Germany (DE), or the United States (US) to tailor the correlation analysis to your specific market interest.
Correlation Length Customization: Adjust the correlation length to refine the sensitivity of the indicator to recent inflation data.
Visual Clarity: The correlation histogram changes color based on the direction of the correlation, providing an intuitive understanding of the inflation correlation.
Whether you’re a fundamental analyst seeking to incorporate macroeconomic indicators into your strategy or a trader looking for an edge in inflation-sensitive markets, the Inflation Correlation Indicator is an indispensable tool in your TradingView arsenal.
Thanks for checking this out!
Best regards,
simwai
Relationship
NET BSP NET BSP derived from Buying & Selling Pressure which is a volatility indicator that monitors average metrics of green and red candles separately.
We could navigate more confidently through market with projected market balance.
BSP allowed us to track and analyze the ongoing performance of bullish and bearish impulsive waves and their corrections.
Due to unintuitive way of measuring decline with SP going up, I decided to remake it into more intuitive version with better precision.
When we encounter the fall it's better to have declining values of tool to be able to cover it visually with ease.
One of the solutions was to create a sense of balance of Buying Pressure against Selling Pressure.
Since we are oriented by growth, it'd be more logical to summarize the market balance with BP - SP
Comparison:
When Buying and Selling Pressure are equal, NET BSP would be at 0.
NETBSP > 0 and NETBSP > NETBSP = 🟢
NETBSP > 0 and NETBSP < NETBSP = 🟡
NETBSP < 0 and NETBSP < NETBSP = 🔴
NETBSP < 0 and NETBSP > NETBSP = 🟡
Hence, we get visualized stages of uptrends and downtrends which allows to evaluate chances and estimations of upcoming counter-waves.
Also, it is worth to note that output clearly shows how one wave is derived from another in terms of sizing.
Feel free to adjust NET BSP arguments to adapt sensitivity to the timeframe you're working on.

[blackcat] L1 Close Histogram OscillatorLevel: 1
Background
A histogram is a special chart that is applied to statistical data that is divided into numerically ordered groups. For example groups with close relationships in the vicinity like "Close-ref(Close ,1)", "Close-ref(Close,2)" and so on. A histogram provides a snapshot of all the data so that you can quickly get an overview of the historical data, especially its general shape.In a histogram, the bars are linked - in contrast to a bar chart for categorical data, in which the bars represent categories that are in no particular order and are separated. The height of each bar in a histogram indicates either the number of individuals (called the frequency) in each group or the percentage of individuals (the relative frequency) in each group. Each individual in the data set falls into exactly one bar.
Function
L2 Close Histogram Oscillator is a novel overbought and oversold indicator that estimate the trend state by counting a specific bar relationship nearby. Once nearby bars reach consensus, it may spread to global quickly. The reason why I got this inspiration is because I have been engaged in the research of blockchain consensus mechanism. The market is a complex system, and its consensus depends on the common human characteristics: greed and fear. The trend of the market often also conforms to sociological characteristics. Maybe it's a bit complicated for me to say that. However, if you understand the principle of the spread of rumors and viruses, you can understand the situation where some individuals in the market have local consensus and gradually spread to the overall situation. This is the process of trend formation.
Key Signal
fastcounter --> fast close histogram counters
slowcounter --> slow close histogram counters
attention --> bottom price appears, with height of 10 in white
readybuy --> a small position buy opportunity after first bottom detected, with height of 20 in yellow
buylow --> a small position buy at low price, with height of 30 in lime
longentry --> a confirmed long entry signal by close histogram counter, with height of 40 in green
risk --> oscillator top is reached and trend reversal may happen, with height drop from 100 to 80 in red
Pros and Cons
Pros:
1. since this is based on consensus formation principle, i think this is a leading indicator by spreading local consensus to global
2. it is an oscillator, overbought and oversold can be easily observed.
Cons:
1. the model is not complex enough to depict market behavior exactly.
2. sideways and chop market will make this indicator's output hard to read.
Remarks
This is rare! I combined my previous theory of developing cellular automata with the market to produce such a weird indicator. I hope to inspire everyone and study market behavior in a deeper level.
Readme
In real life, I am a prolific inventor. I have successfully applied for more than 60 international and regional patents in the past 12 years. But in the past two years or so, I have tried to transfer my creativity to the development of trading strategies. Tradingview is the ideal platform for me. I am selecting and contributing some of the hundreds of scripts to publish in Tradingview community. Welcome everyone to interact with me to discuss these interesting pine scripts.
The scripts posted are categorized into 5 levels according to my efforts or manhours put into these works.
Level 1 : interesting script snippets or distinctive improvement from classic indicators or strategy. Level 1 scripts can usually appear in more complex indicators as a function module or element.
Level 2 : composite indicator/strategy. By selecting or combining several independent or dependent functions or sub indicators in proper way, the composite script exhibits a resonance phenomenon which can filter out noise or fake trading signal to enhance trading confidence level.
Level 3 : comprehensive indicator/strategy. They are simple trading systems based on my strategies. They are commonly containing several or all of entry signal, close signal, stop loss, take profit, re-entry, risk management, and position sizing techniques. Even some interesting fundamental and mass psychological aspects are incorporated.
Level 4 : script snippets or functions that do not disclose source code. Interesting element that can reveal market laws and work as raw material for indicators and strategies. If you find Level 1~2 scripts are helpful, Level 4 is a private version that took me far more efforts to develop.
Level 5 : indicator/strategy that do not disclose source code. private version of Level 3 script with my accumulated script processing skills or a large number of custom functions. I had a private function library built in past two years. Level 5 scripts use many of them to achieve private trading strategy.
