Real Relative Strength Indicator (Multi-Index Comparison)The Real Relative Strength (RRS) indicator implements the "Real Relative Strength" equation, as detailed on the Real Day Trading subreddit wiki. This equation measures whether a stock is outperforming a benchmark (such as SPY or any preferred ETF/index) by calculating price change normalized by the Average True Range (ATR) of both the stock and the indices it’s being compared to.
The RRS metric often highlights potential accumulation by institutional players. For example, in this chart, you can observe accumulation in McDonald’s beginning at 1:25 pm ET on the 5-minute chart and continuing until 2:55 pm ET. When used in conjunction with other indicators or technical analysis, RRS can provide valuable buy and sell signals.
This indicator also supports multi-index analysis, allowing you to plot relative strength against two indices simultaneously—defaulting to SPY and QQQ—to gain insights into the "real relative strength" across different benchmarks. Additionally, this indicator includes an EMA line and background coloring to help automatically identify relative strength trends, providing a clearer visualization than typical Relative Strength Comparison indicators.
相對強弱比較(RSC)

Weekly RSI Buy/Sell SignalsWeekly RSI Buy/Sell Signal Indicator
This indicator is designed to help traders identify high-probability buy and sell opportunities on the weekly chart by using the Relative Strength Index (RSI). By utilizing weekly RSI values, this indicator ensures signals align with broader market trends, providing a clearer view of potential price reversals and continuation.
How It Works:
Weekly RSI Calculation: This script calculates the RSI using a 14-period setting, focusing on the weekly timeframe regardless of the user’s current chart view. The weekly RSI is derived using request.security, allowing for consistent signals even on intraday charts.
Signal Conditions:
Buy Signal: A buy signal appears when the RSI crosses above the oversold threshold of 30, suggesting that price may be gaining momentum after a potential bottom.
Sell Signal: A sell signal triggers when the RSI crosses below the overbought threshold of 70, indicating a possible momentum shift downwards.
Visual Cues:
Buy/Sell Markers: Clear green "BUY" and red "SELL" markers are displayed on the chart when buy or sell conditions are met, making it easy to identify entry and exit points.
RSI Line and Thresholds: The weekly RSI value is plotted in real time with color-coded horizontal lines at 30 (oversold) and 70 (overbought), providing a visual reference for key levels.
This indicator is ideal for traders looking for reliable, trend-based signals on higher timeframes and can be a helpful tool for filtering out shorter-term market noise.

Industry Group Strength - IndiaPresenting the Industry Group Strength Indicator for India market, designed to help traders identify top-performing stocks within specific industry groups that are predefined.
⦿ Identifies Leading Stocks in Industry Groups
⦿ Analyses the following metrics
YTD Return : Measures stock performance from the start of the year.
RS Rating : Relative Strength rating for user-selected periods.
% Return : Percentage return over a user-selected lookback period.
Features
This indicator dynamically recognises the industry group of the current stock on the chart and ranks stocks within that group based on predefined data points. Traders can add this indicator to focus on top-performing stocks relative to their industry.
⦿ Color-coded for Easy Visualisation
You can choose from the following key metrics to rank stocks:
YTD Return
RS Rating
% Return
⦿ Table Format with Performance Metrics Compact mode
Vertical View
Horizontal View
All of the three metrics are shown in the compact mode and the current stock that is viewed is highlighted!
Vertical view
Horizontal view
Stock Ranking
Stocks are ranked based on their performance within industry groups, enabling traders to easily spot leaders and laggards in each sector. Color-coded gradients visually represent the stocks’ performance rankings, with higher percentile rankings indicating better performance.
Relative Strength (RS)
Relative Strength (RS) compares a stock’s performance against the benchmark index. The RS value is normalized from 1 to 99, making it easier to compare across different stocks. A rising RS value indicates that the stock is outperforming the market, helping traders quickly gauge relative performance within industry groups.
Limitations
At the time of developing this indicator, Pine requests are limited to 40 per script so the predefined symbols had to be filtered to 40 per Industry group
Stocks Filters
Filters that are used to filter the stocks in an Industry group to have maximum of 40 stocks
⦿ Auto, Chemical, Engineering, Finance, Pharma
Market Cap >= 1000 Crores and Market Cap <= 60000 Crores
Price >= 30 and Price <= 6000
50 Days Average ( Price * Volume ) >= 6 Crores
⦿ For rest of the Industry groups
Market Cap >= 1000 Crores and Market Cap <= 100000 Crores
Price >= 20 and Price <= 10000
50 Days Average ( Price * Volume ) >= 3 Crores
Credits
This indicator is forked from the Script for US market by @Amphibiantrading Thanks Brandon for the beginning of this indicator.
This indicator is built on TradingView’s new dynamic requests feature, thanks to @PineCoders for making this possible!

OutperformX VCPSwingDesigned to measure and visualize the relative strength and outperformance of a stock compared to a benchmark. Here’s a feature-by-feature breakdown
Credits to Eeshan for all the help
—————-
Alpha Calculation: What's it About?
The key component of this indicator is the Alpha calculation, which measures a stock's outperformance relative to a base index (e.g., Nifty Midsmall 400) while accounting for risk-free returns. By comparing the stock's performance with the base and risk-free rates, we get the Alpha.
The Alpha logic has been slightly modified, not strictly following the textbook approach
——————
Customizable Inputs: Tailored for You
You can choose whether to display Alpha.
Change the Base Index (e.g., NiftyMidsmall400).
Adjust the Performance Period (Days) for custom Alpha/Outperformance calculations.
Performance options range from 5 to 252 days, helping to fine-tune the outperformance tracking.
—————
Highlighting Performance Peaks: Short-Term & Long-Term
The indicator automatically highlights Short-Term Peak Performance over customizable short-term windows (e.g., 21 days).
It also detects Long-Term Performance Peaks, spanning up to 52 weeks. These peaks are represented as dots on the Alpha line.
——————
Color-Coded Alpha: Clear Visuals
To make the indicator visually intuitive:
Positive Alpha (outperformance) is marked in green.
Negative Alpha (underperformance) is shown in red. These are customizable so you can adjust colors to your preference!
—————
Outperformance Before Price Peaks
One cool feature is tracking whether Alpha outperforms before the price hits new highs. If Alpha breaks out but price lags, a “dot” is drawn, giving a heads-up on potential upcoming price moves.
——————
Background Color Highlighting
Background colors change dynamically based on performance:
Green for positive Alpha (outperformance).
Red for negative Alpha (underperformance). This gives a quick visual reference of the stock’s performance at a glance.
——————-
Filling the Alpha Zone
The indicator fills the area between the Alpha line and zero. This shading helps highlight the magnitude of outperformance (or underperformance) and provides a quick visual cue about trends.
———————
Get Started
With all these features combined, the Outperformance indicator becomes a powerful tool for spotting leading stocks, tracking risk-adjusted performance, and identifying performance peaks before price catches up.

Relative Strength Price Oscillator Indicator (RS PPO)Percentage Price Oscillator (PPO)
The Percentage Price Oscillator (PPO) is a momentum oscillator that measures the difference between two moving averages as a percentage of the larger moving average. As with its cousin, MACD, the Percentage Price Oscillator is shown with a signal line, a histogram and a centerline. Signals are generated with signal line crossovers, centerline crossovers, and divergences.
PPO readings are not subject to the price level of the security and the PPO values for different securities can be compared, regardless of the price of the security.
Relative Strength (RS)
Relative strength is a strategy used in momentum investing and focuses on investing in stocks or other securities that have performed well relative to the market as a whole or to a relevant benchmark.
Chart
In the chart, Microsoft stock (MSFT) is plotted against the VanEck Semiconductor ETF (SMH).
In the example on the left, from the negative values of the RS PPO it can be seen that MSFT, although trending upward, is losing out in negative terms to the SMH etf.
In the example on the right, during a correction phase with a downward price trend, Microsoft held up relatively well compared to the Van Eck Semiconductor etf.

Smart Momentum Relative StrengthSmart Momentum Relative Strength
Creator Journey
The Smart Momentum Relative Strength indicator is
created by Vishal R. Janjire , inspired by BharatTrader sir, and parameters guided by mentor stockedge founder Vivek Bajaj sir.
Reason? ...Why choose Smart Momentum Relative Strength.
1.Simple to Trade: This indicator simplifies trading decisions. You just need to follow the background color displayed on the chart. When the background is green, it signals a bullish trend, and when it turns red, it signals a bearish trend. For an even cleaner experience, you can untick the Relative Strength (RS) toggle in the indicator settings and focus purely on trading based on these background colors, making the process straightforward and efficient.
2.Unlock the power to compare any stock, share, commodity, forex or cryptocurrency against major indices like Nasdaq Composite, NYSE Composite, Bitcoin, NG, Gold, Silver, Crude oil, Nasdaq-100, Nifty 50, Hang Seng Index, FTSE 100, and many more! With the Comparative Relative Strength (RS) indicator,
You can easily change the default Nifty 50 comparative symbol to any index or asset of your choice, such as Gold, Silver, Crude Oil, or global benchmarks like the Dow Jones Industrial Average, DAX, Euronext 100, and SSE Composite.
This versatile tool allows traders to measure how well a base symbol (e.g., stock or crypto) performs relative to a chosen benchmark over a specified period. Whether you're analyzing the relative strength of Bitcoin against the Nasdaq-100 or comparing stocks to the S&P 500, this indicator provides valuable insights into market trends and outperforming assets.
The Smart Momentum Relative Strength combines several advanced technical analysis tools into one comprehensive Pine Script indicator designed to provide a nuanced view of market strength and trends. This script integrates Relative Strength (RS), Commodity Channel Index (CCI), and additional trend confirmation mechanisms to deliver actionable insights for traders.
Below are key points to understand before using this indicator:
Important Parameters:
1. Green Line: Represents stocks outperforming the comparative index, which is Nifty 50. However, do not apply this result directly to Nifty 50 itself, as it will not work exclusively on the Nifty 50 index.
2. Red Line: Indicates that the stock is underperforming relative to the Nifty 50 index.
3. Green Background: Signifies that both the current time momentum and higher time momentum are aligned, indicating an upward trend.
4. Red Background: Signifies that both the current time momentum and higher time momentum are aligned, indicating a downward trend.
5. Blank Space: This occurs when the two timeframes are not aligned, indicating market uncertainty and signaling a potential change in market direction, it means short time frame or current time frame changed its direction to opposite side.
Multi-Time Frame (MTF) Settings:
This indicator incorporates a default multi-time frame setup, as follows:
1 and 2 Minute chart = 5 Minute higher time frame
3 Minute chart = 15 Minute higher time frame
5 Minute chart = 15 Minute higher time frame
10 Minute chart = 60 Minute higher time frame
15 Minute chart = 60 Minute higher time frame
20 and 30 Minute chart = 120 Minute higher time frame
1 Hour chart = 4 Hour higher time frame
2 Hour chart = 4 Hour higher time frame
4 Hour chart = 1 Day higher time frame
1 Day chart = 1 Week higher time frame
1 Week chart = 1 Month higher time frame
1 Month chart = 12 Month higher time frame
For any other chart time frame = Day time is default time frame
1. Relative Strength (RS) Analysis:
Calculation: Measures the performance of the base symbol relative to a comparative symbol over a specified period.
Visualization: The RS value is plotted with color-coded lines to indicate bullish (green) or bearish (red) conditions based on crossovers. Users can customize the color based on value or trend direction.
Trend Analysis: A simple moving average (SMA) of RS is displayed to visualize trend strength and direction, with color changes to reflect rising or falling trends.
2. Commodity Channel Index (CCI):
- Current Timeframe CCI: Calculates the CCI for the current timeframe to assess price momentum.
- Higher Timeframe CCI: Computes the CCI for a higher timeframe to provide a broader market perspective.
- Background Color: Highlights the chart background in green or red based on whether both current and higher timeframe CCIs are above or below zero, respectively.
-Blank Space: This occurs when the two timeframes are not aligned, indicating market uncertainty and signaling a potential change in market direction, it means short time frame or current time frame changed its direction to opposite side.

The Adaptive Pairwise Momentum System [QuantraSystems]The Adaptive Pairwise Momentum System
QuantraSystems guarantees that the information created and published within this document and on the Tradingview platform is fully compliant with applicable regulations, does not constitute investment advice, and is not exclusively intended for qualified investors.
Important Note!
The system equity curve presented here has been generated as part of the process of testing and verifying the methodology behind this script.
Crucially, it was developed after the system was conceptualized, designed, and created, which helps to mitigate the risk of overfitting to historical data. In other words, the system was built for robustness, not for simply optimizing past performance.
This ensures that the system is less likely to degrade in performance over time, compared to hyper-optimized systems that are tailored to past data. No tweaks or optimizations were made to this system post-backtest.
Even More Important Note!!
The nature of markets is that they change quickly and unpredictably. Past performance does not guarantee future results - this is a fundamental rule in trading and investing.
While this system is designed with broad, flexible conditions to adapt quickly to a range of market environments, it is essential to understand that no assumptions should be made about future returns based on historical data. Markets are inherently uncertain, and this system - like all trading systems - cannot predict future outcomes.
Introduction
The Adaptive Pairwise Momentum System is not just an indicator but a comprehensive asset rotation and trend-following system. In short, it aims to find the highest performing asset from the provided range.
The system dynamically optimizes capital allocation across up to four high-performing assets, ensuring that the portfolio adapts swiftly to changing market conditions. The system logic consists of sophisticated quantitative methods, rapid momentum analysis, and robust trend filtering. The overarching goal is to ensure that the portfolio is always invested in the highest-performing asset based on dynamic market conditions, while at the same time managing risk through broader market filters and internal mechanisms like volatility and beta analysis.
Legend
System Equity Curve:
The equity curve displayed in the chart is dynamically colored based on the asset allocation at any given time. This color-coded approach allows traders to immediately identify transitions between assets and the corresponding impact on portfolio performance.
Highlighting of Current Highest Performer:
The current bar in the chart is highlighted based on the confirmed highest performing asset. This is designed to give traders advanced notice of potential shifts in allocation even before a formal position change occurs. The highlighting enables traders to prepare in real time, making it easier to manage positions without lag, particularly in fast-moving markets.
Highlighted Symbols in the Asset Table:
In the table displayed on the right hand side of the screen, the current top-performing symbol is highlighted. This clear signal at a glance provides immediate insight into which asset is currently being favored by the system. This feature enhances clarity and helps traders make informed decisions quickly, without needing to analyze the underlying data manually.
Performance Overview in Tables:
The left table provides insight into both daily and overall system performance from inception, offering traders a detailed view of short-term fluctuations and long-term growth. The right-hand table breaks down essential metrics such as Sharpe ratio, Sortino ratio, Omega ratio, and maximum drawdown for each asset, as well as for the overall system and HODL strategy.
Asset-Specific Signals:
The signals column in the table indicates whether an asset is currently held or being considered for holding based on the system's dynamic rankings. This is a critical visual aid for asset reallocation decisions, signaling when it may be appropriate to either maintain or change the asset of the portfolio.
Core Features and Methodologies
Flexibility in Asset Selection
One of the major advantages of this system is its flexibility. Users can easily modify the number and type of assets included for comparison. You can quickly input different assets and backtest their performance, allowing you to verify how well this system might fit different tokens or market conditions. This flexibility empowers users to adapt the system to a wide range of market environments and tailor it to their unique preferences.
Whole System Risk Mitigation - Macro Trend Filter
One of the features of this script is its integration of a Macro-level Trend Filter for the entire portfolio. The purpose of this filter is to ensure no capital is allocated to any token in the rotation system unless Bitcoin itself is in a positive trend. The logic here is that Bitcoin, as the cryptocurrency market leader, often sets the tone for the entire cryptocurrency market. By using Bitcoins trend direction as a barometer for overall market conditions, we create a system where capital is not allocated during unfavorable or bearish market conditions - significantly reducing exposure to downside risk.
Users have the ability to toggle this filter on and off in the input menu, with five customizable options for the trend filter, including the option to use no filter. These options are:
Nova QSM - a trend aggregate combining the Rolling VWAP, Wave Pendulum Trend, KRO Overlay, and the Pulse Profiler provides the market trend signal confirmation.
Kilonova QSM - a versatile aggregate combining the Rolling VWAP, KRO Overlay, the KRO Base, RSI Volatility Bands, NNTRSI, Regression Smoothed RSI and the RoC Suite.
Quasar QSM - an enhanced version of the original RSI Pulsar. The Quasar QSM refines the trend following approach by utilizing an aggregated methodology.
Pairwise Momentum and Strength Ranking
The backbone of this system is its ability to identify the strongest-performing asset in the selected pool, ensuring that the portfolio is always exposed to the asset showing the highest relative momentum. The system continually ranks these assets against each other and determines the highest performer by measure of past and coincident outperformance. This process occurs rapidly, allowing for swift responses to shifts in market momentum, which ensures capital is always working in the most efficient manner. The speed and precision of this reallocation strategy make the script particularly well-suited for active, momentum-driven portfolios.
Beta-Adjusted Asset Selection as a Tiebreaker
In the circumstance where two (or more) assets exhibit the same relative momentum score, the system introduces another layer of analysis. In the event of a strength ‘tie’ the system will preference maintaining the current position - that is, if the previously strongest asset is now tied, the system will still allocate to the same asset. If this is not the case, the asset with the higher beta is selected. Beta is a measure of an asset’s volatility relative to Bitcoin (BTC).
This ensures that in bullish conditions, the system favors assets with a higher potential for outsized gains due to their inherent volatility. Beta is calculated based on the Average Daily Return of each asset compared to BTC. By doing this, the system ensures that it is dynamically adjusting to risk and reward, allocating to assets with higher risk in favorable conditions and lower risk in less favorable conditions.
Dynamic Asset Reallocation - Opposed to Multi-Asset Fixed Intervals
One of the standout features of this system is its ability to dynamically reallocate capital. Unlike traditional portfolio allocation strategies that may rebalance between a basket of assets monthly or quarterly, this system recalculates and reallocates capital on the next bar close (if required). As soon as a new asset exhibits superior performance relative to others, the system immediately adjusts, closing the previous position and reallocating funds to the top-ranked asset.
This approach is particularly powerful in volatile markets like cryptocurrencies, where trends can shift quickly. By reallocating swiftly, the system maximizes exposure to high-performing assets while minimizing time spent in underperforming ones. Moreover, this process is entirely automated, freeing the trader from manually tracking and measuring individual token strength.
Our research has demonstrated that, from a risk-adjusted return perspective, concentration into the top-performing asset consistently outperforms broad diversification across longer time horizons. By focusing capital on the highest-performing asset, the system captures outsized returns that are not achievable through traditional diversification. However, a more risk-averse investor, or one seeking to reduce drawdowns, may prefer to move the portfolio further left along the theoretical Capital Allocation Line by incorporating a blend of cash, treasury bonds, or other yield-generating assets or even include market neutral strategies alongside the rotation system. This hybrid approach would effectively lower the overall volatility of the portfolio while still maintaining exposure to the system’s outsized returns. In theory, such an investor can reduce risk without sacrificing too much potential upside, creating a more balanced risk-return profile.
Position Changes and Fees/Slippage
Another critical and often overlooked element of this system is its ability to account for fees and slippage. Given the increased speed and frequency of allocation logic compared to the buy-and-hold strategy, it is of vital importance that the system recognises that switching between assets may incur slippage, especially in highly volatile markets. To account for this, the system integrates realistic slippage and fee estimates directly into the equity curve, simulating expected execution costs under typical market conditions and gives users a more realistic view of expected performance.
Number of Position Changes
Understanding the number of position changes in a strategy is critical to assessing its feasibility in real world trading. Frequent position changes can lead to increased costs due to slippage and fees. Monitoring the number of position changes provides insight into the system’s behavior - helping to evaluate how active the strategy is and whether it aligns with the trader's desired time input for position management.
Equity Curve and Performance Calculations
To provide a benchmark, the script also generates a Buy-and-Hold (or "HODL") equity curve that represents an equal split across the four selected assets. This allows users to easily compare the performance of the dynamic rotation system with that of a more traditional investment strategy.
The script tracks key performance metrics for both the dynamic portfolio and the HODL strategy, including:
Sharpe Ratio
The Sharpe Ratio is a key metric that evaluates a portfolio’s risk-adjusted return by comparing its ‘excess’ return to its volatility. Traditionally, the Sharpe Ratio measures returns relative to a risk-free rate. However, in our system’s calculation, we omit the risk-free rate and instead measure returns above a benchmark of 0%. This adjustment provides a more universal comparison, especially in the context of highly volatile assets like cryptocurrencies, where a traditional risk-free benchmark, such as the usual 3-month T-bills, is often irrelevant or too distant from the realities of the crypto market.
By using 0% as the baseline, we focus purely on the strategy's ability to generate raw returns in the face of market risk, which makes it easier to compare performance across different strategies or asset classes. In an environment like cryptocurrency, where volatility can be extreme, the importance of relative return against a highly volatile backdrop outweighs comparisons to a risk-free rate that bears little resemblance to the risk profile of digital assets.
Sortino Ratio
The Sortino Ratio improves upon the Sharpe Ratio by specifically targeting downside risk and leaves the upside potential untouched. In contrast to the Sharpe Ratio (which penalizes both upside and downside volatility), the Sortino Ratio focuses only on negative return deviations. This makes it a more suitable metric for evaluating strategies like the Adaptive Pairwise Momentum Strategy - that aim to minimize drawdowns without restricting upside capture. By measuring returns relative to a 0% baseline, the Sortino ratio provides a clearer assessment of how well the system generates gains while avoiding substantial losses in highly volatile markets like crypto.
Omega Ratio
The Omega Ratio is calculated as the ratio of gains to losses across all return thresholds, providing a more complete view of how the system balances upside and downside risk even compared to the Sortino Ratio. While it achieves a similar outcome to the Sortino Ratio by emphasizing the system's ability to capture gains while limiting losses, it is technically a mathematically superior method. However, we include both the Omega and Sortino ratios in our metric table, as the Sortino Ratio remains more widely recognized and commonly understood by traders and investors of all levels.
Case Study
Notes
For the sake of brevity, the Important Notes section found in the header of this text will not be rewritten. Instead, it will be highlighted that now is the perfect time to reread these notes. Reading this case study in the context of what has been mentioned above is of key importance.
As a second note, it is worth mentioning that certain market periods are referred to as either “Bull” or “Bear” markets - terms I personally find to be vague and undefinable - and therefore unfavorable. They will be used nevertheless, due to their familiarity and ease of understanding in this context. Substitute phrases could be “Macro Uptrend” or “Macro Downtrend.”
Overview
This case study provides an in-depth performance analysis of the Adaptive Pairwise Momentum System , a long-only system that dynamically allocates to outperforming assets and moves into cash during unfavorable conditions.
This backtest includes realistic assumptions for slippage and fees, applying a 0.5% cost for every position change, which includes both asset reallocation and moving to a cash position. Additionally, the system was tested using the top four cryptocurrencies by market capitalization as of the test start date of 01/01/2022 in order to minimize selection bias.
The top tokens on this date (excluding Stablecoins) were:
Bitcoin
Ethereum
Solana
BNB
This decision was made in order to avoid cherry picking assets that might have exhibited exceptional historical performance - minimizing skew in the back test. Furthermore, although this backtest focuses on these specific assets, the system is built to be flexible and adaptable, capable of being applied to a wide range of assets beyond those initially tested.
Any potential lookahead bias or repainting in the calculations has been addressed by implementing the lookback modifier for all repainting sensitive data, including asset ratios, asset scoring, and beta values. This ensures that no future information is inadvertently used in the asset allocation process.
Additionally, a fixed lookback period of one bar is used for the trend filter during allocations - meaning that the trend filter from the prior bar must be positive for an allocation to occur on the current bar. It is also important to note that all the data displayed by the indicator is based on the last confirmed (closed) bar, ensuring that the entire system is repaint-proof.
The study spans the 2022 cryptocurrency bear market through the subsequent bull market of 2023 and 2024. The stress test highlights how the system reacted to one of the most challenging market downturns in crypto history - which includes events such as:
Luna and TerraUSD crash
Three Arrows Capital liquidation
Celsius bankruptcy
Voyager Digital bankruptcy
FTX collapse
Silicon Valley + Signature + Silvergate banking collapses
Subsequent USDC deppegging
And arguably more important, 2022 was characterized by a tightening of monetary policy after the unprecedented monetary easing in response to the Covid pandemic of 2020/2021. This shift undeniably puts downward pressure on asset prices, most probably to the extent that this had a causal role to many of the above events.
By incorporating these real-world challenges, the backtest provides a more accurate and robust performance evaluation that avoids overfitting or excessive optimization for one specific market condition.
The Bear Market of 2022: Stress Test and System Resilience
During the 2022 bear market, where the overall crypto market experienced deep and consistent corrections, the Adaptive Pairwise Momentum System demonstrated its ability to mitigate downside risk effectively.
Dynamic Allocation and Cash Exposure:
The system rotated in and out of cash, as indicated by the gray period on the system equity curve. This allocation to cash during downtrending periods, specifically in late 2022, acted as the systems ‘risk-off’ exposure - the purest form of such an exposure. This prevented the system from experiencing the magnitude of drawdown suffered by the ‘Buy-and-Hold (HODL) investors.
In contrast, a passive HODL strategy would have suffered a staggering 75.32% drawdown, as it remained fully allocated to chosen assets during the market's decline. The active Pairwise Momentum system’s smaller drawdown of 54.35% demonstrates its more effective capital preservation mechanisms.
The Bull Market of 2023 and 2024: Capturing Market Upside
Following the crypto bear market, the system effectively capitalized on the recovery and subsequent bull market of 2023 and 2024.
Maximizing Market Gains:
As trends began turning bullish in early 2023, the system caught the momentum and promptly allocated capital to only the quantified highest performing asset of the time - resulting in a parabolic rise in the system's equity curve. Notably, the curve transitions from gray to purple during this period, indicating that Solana (SOL) was the top-performing asset selected by the system.
This allocation to Solana is particularly striking because, at the time, it was an asset many in the market shunned due to its association with the FTX collapse just months prior. However, this highlights a key advantage of quantitative systems like the one presented here: decisions are driven purely from objective data - free from emotional or subjective biases. Unlike human traders, who are inclined (whether consciously or subconsciously) to avoid assets that are ‘out of favor,’ this system focuses purely on price performance, often uncovering opportunities that are overlooked by discretionary based investors. This ability to make data-driven decisions ensures that the strategy is always positioned to capture the best risk-adjusted returns, even in scenarios where judgment might fail.
Minimizing Volatility and Drawdown in Uptrends
While the system captured substantial returns during the bull market it also did so with lower volatility compared to HODL. The sharpe ratio of 4.05 (versus HODL’s 3.31) reflects the system's superior risk-adjusted performance. The allocation shifts, combined with tactical periods of cash holding during minor corrections, ensured a smoother equity curve growth compared to the buy-and-hold approach.
Final Summary
The percentage returns are mentioned last for a reason - it is important to emphasize that risk-adjusted performance is paramount. In this backtest, the Pairwise Momentum system consistently outperforms due to its ability to dynamically manage risk (as seen in the superior Sharpe, Sortino and Omega ratios). With a smaller drawdown of 54.35% compared to HODL’s 75.32%, the system demonstrates its resilience during market downturns, while also capturing the highest beta on the upside during bullish phases.
The system delivered 266.26% return since the backtest start date of January 1st 2022, compared to HODL’s 10.24%, resulting in a performance delta of 256.02%
While this backtest goes some of the way to verifying the system’s feasibility, it’s important to note that past performance is not indicative of future results - especially in volatile and evolving markets like cryptocurrencies. Market behavior can shift, and in particular, if the market experiences prolonged sideways action, trend following systems such as the Adaptive Pairwise Momentum Strategy WILL face significant challenges.

Stock vs Custom Symbol OutperformanceStock vs Custom Symbol Outperformance" is a powerful technical analysis indicator designed to help traders and investors gauge the relative performance of a stock against a selected benchmark symbol. This tool enables users to easily visualize how a stock is performing in comparison to another asset, such as an index or another stock.
Key Features:
Custom Symbol Comparison: Input any symbol to compare against the stock of interest, allowing for flexible analysis tailored to specific market conditions.
Outperformance Calculation: The indicator calculates the percentage change in price for both the stock and the selected benchmark, providing a clear view of relative performance.
Moving Average Smoothing: A customizable moving average smooths the outperformance data, helping to identify trends and reduce noise in the signals.
Threshold Lines: Set upper and lower threshold lines to visualize significant levels of outperformance or underperformance, aiding in decision-making.
Dynamic Color Coding: The outperformance bars are color-coded—green indicates that the stock is outperforming the benchmark, while red indicates underperformance.
How to Use:
Select a Benchmark: Use the input field to choose the symbol against which you want to compare the stock.
Adjust Parameters: Modify the moving average length and set your desired thresholds for easier identification of performance metrics.
Interpret Results: Analyze the plot for insights into the stock's performance relative to the benchmark, with the moving average providing additional context for trends.
This indicator is ideal for traders looking to refine their strategies by understanding how individual stocks measure up against key benchmarks in the market.

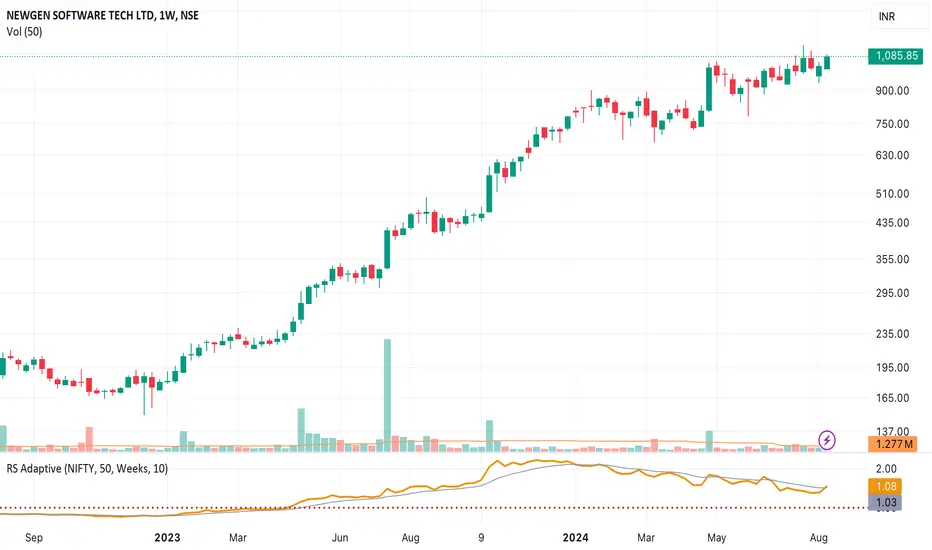
CANSLIM IBD Relative Strength NIFTYSMLCAP250 (Daily & Weekly)This Pine Script (written in version 5) is designed to calculate the IBD Relative Strength for both daily and weekly timeframes, comparing the current chart's security to the NIFTY SMLCAP 250 index. Here's a breakdown of the code:
1. Indicator Initialization: This line sets up the indicator with both a short and full title. The overlay=true means the plot will be drawn on top of the price chart.
2. Fetching Data: This fetches the daily ("D") and weekly ("W") close prices for the NIFTY SMLCAP 250 index.
3. Relative Strength Calculation: Relative strength is calculated as the ratio of the security's current close price to the close price of the NIFTY SMLCAP 250, multiplied by 100 for both daily and weekly timeframes.
4. Timeframe-Based Selection: Here, the script checks whether the chart is in daily or weekly mode and selects the corresponding relative strength value.
5. Scaling with Multiplier: This section ensures there are at least 60 bars of data and scales the relative strength by using a multiplier derived from the 60th previous bar's close price.
6. Plotting: Finally, the scaled relative strength is plotted on the chart in black.
Improvements :
Dynamic Timeframe Handling: You might want to extend this for other timeframes, e.g., monthly.
Customization: You can add user input parameters to adjust the timeframe, scale factor, or period dynamically.
Color Enhancements: You can add color variation to indicate strength/weakness more clearly.

Saral Relative Strength ComparisonRelative Strength Comparison
### Overview
The Relative Strength (RS) Indicator is a robust tool designed to measure the performance of sectors or stocks relative to a benchmark index. This indicator provides a comprehensive way to compare the relative strength of different sectors or stocks, with the default selection being the major sectors of the National Stock Exchange (NSE). It allows traders to analyze which sectors or stocks are outperforming or underperforming the benchmark over a specific period.
The RS compares how much a security's price has changed over a given period relative to the change in price of a benchmark over the same period. The result is expressed as a percentage, showing whether the security has outperformed or underperformed the benchmark. Positive RS values indicate outperformance, while negative values signal underperformance.
This indicator provides a dual representation of the data. RS values are displayed in both line charts and a table. The line charts provide a visual representation of trends, while the table offers a clear numerical comparison of the current, previous, and earlier RS values along with the rank of the sector/stock.
### Key Features
Benchmark & Sectors/Stocks Comparison:
Users can select a benchmark index (default: NIFTY 50) and up to 20 sectors or stocks for comparison. By default, the indicator includes the major sectors of NSE, but users can customize the selection as needed.
Customizable RS Calculation:
Users can set the period for RS calculation, with a default of 22 periods, providing flexibility to match different trading strategies.
Flexible Time Frame:
RS calculations are based on the time frame of the main chart, allowing users to seamlessly switch between different periods, from minutes to hours, days, weeks, or even months depending on their analysis needs.
Customizable Line Chart:
Users can adjust the width and color of the RS lines for each sector, making it easier to distinguish between different sectors on the chart.
Dynamic Table Display:
The indicator includes a toggle to display a table of RS values, with customizable position, toggle for background color coding, and selection for text color & size. This makes it easy to compare the RS values across multiple sectors at a glance.
Sorting Options:
The table can be sorted either by alphabetical order of sector/stock names or by their rank. The default sorting is by rank, but switching to alphabetical order helps to identify data of specific sector with ease.
Ranking System:
The table includes a column displaying the rank of each sector or stock based on their RS, with the top-performing items listed first by default. This helps users quickly identify market leaders and laggards.
Color-Coded Backgrounds:
The background color of the sector/stock names in the table corresponds to the colors of their RS lines on the chart, making it easy to correlate table data with the visual plots. Also, the table uses a color-coding system which shows ranks of RS Positive sectors with Green background and RS Negative sectors with Red background. Similarly, the maximum RS value of individual sector is highlighted in Navy Blue, the minimum in Aqua and other in Blue background. This visual aid helps users quickly identify the performance trend of individual sector.
Table Positioning:
The table can be positioned at different locations on the chart (Top Right, Middle Right, Bottom Right, Top Left, Middle Left, Bottom Left), ensuring it doesn't obstruct important chart data.
### Input - RS Parameters:
Benchmark: Ticker ID of the comparative security. The default benchmark is the NIFTY 50 index, but users can select any other ticker as the benchmark for comparison.
Period-RS: The period for calculating the RS line. The default period is 22, but users can adjust this to suit their trading strategy and to analyze different time horizons for sector performance.
Line Width: Determines the thickness of the RS line in the chart. The default width is 2, providing a clear visual distinction between different sectors.
### Input - Table Parameters:
Show Table: Toggle to display or hide the table, allowing users to switch between graphical and tabular data representations.
Table Sorting: Users can sort the table alphabetically or by RS rank. The default sorting is by rank.
Table Position: Allows users to select the position of the table on the chart. Options include Top Right, Middle Right, Bottom Right, Top Left, Middle Left, and Bottom Left. The default position is Middle Right.
Color Code for Background: The background of the sector/stock names corresponds to their plot colors for easy mapping between plot and table values. Rank of RS Positive sectors will be highlighted with Green background and RS Negative sectors will be highlighted with Red color. The background color of the RS values in the table will change based on their magnitude. The highest RS value is Navy Blue, the lowest is Aqua, and other is Blue. This visual aid helps users quickly identify the performance of which sectors are improving or deteriorating.
Text Color: Users can select the color of the text displayed in the table. The default text color is White, ensuring readability against various background colors.
Text Size: Allows users to choose the size of the text in the table. Options include Auto, Tiny, Small, Medium, and Large, with the default being Small. This customization ensures that the table remains legible on different chart sizes.
### Input - Sectors/Stocks:
Sector/Stock Selection: Users can select which sectors to include as well as how many sectors to include in the analysis. The default sectors are major sectors of the National Stock Exchange, India. The selected sectors will be plotted as RS lines on the chart and will also appear in the table.
Color: Allows users to choose the color for each sector's RS line, making it easy to distinguish between them on the chart.
### Acknowledgement
This indicator is developed based on the concept discussed by Mr. Subhadip Nandy in Trader's Talk with Mr. Rohit Katwal.

Relative Strength and MomentumRelative Strength and Momentum Indicator
Unlock deeper market insights with the Relative Strength and Momentum Indicator—a powerful tool designed to help traders and investors identify the strongest stocks and sectors based on relative performance. This custom indicator displays essential information on relative strength and momentum for up to 15 different symbols, compared against a benchmark index, all within a clear and organized table format.
Key Features:
1. Customizable Inputs: Choose up to 15 symbols to compare, along with a benchmark index, allowing you to tailor the indicator to your trading strategy. The 'Lookback Period' input defines how many weeks of data are analyzed for relative strength and momentum.
2. Relative Strength Calculation: For each selected symbol, the indicator calculates the Relative Strength (RS) against the chosen benchmark. This RS is further refined using an exponential moving average (EMA) to smooth the results, providing a more stable trend overview.
3. Momentum Analysis: Momentum is determined by analyzing the rate of change in relative strength. The indicator calculates a momentum rank for each symbol, based on its relative strength’s improvement or deterioration.
4. Percentile Ranking System: Each symbol is assigned a percentile rank (from 1 to 100) based on its relative strength compared to the others. Similarly, momentum rankings are also assigned from 1 to 100, offering a clear understanding of which assets are outperforming or underperforming.
5. Visual Indicators:
a. Green: Signals improving or stable relative strength and momentum.
b. Red: Indicates declining relative strength or momentum.
c. Aqua: Highlights symbols performing well on both relative strength and momentum—ideal candidates for further analysis.
6. Two Clear Tables:
a. Relative Strength Rank Table: Displays weekly rankings of relative strength for each symbol.
b. Momentum Table: Shows momentum trends, helping you identify which symbols are gaining or losing strength.
7. Color-Coded for Easy Analysis: The tables are color-coded to make analysis quick and straightforward. A green color means the symbol is performing well in terms of relative strength or momentum, while red indicates weaker performance. Aqua marks symbols that are excelling in both areas.
Use Case:
a. Sector Comparison: Identify which sectors or indexes are showing both relative strength and momentum to pick high-potential stocks. This allows you to align with broader market trends for improved trade entries.
b. Stock Selection: Quickly compare symbols within the same sector to find the stronger performers.

RSI TreeRSI Tree is a simple way to compare the strength of several different instruments against each other.
The default is to compare MSFT, NVDA, TSLA, GOOG, META, AMZN, AAPL and NASDAQ. You could do the same for currency pairs and any other instruments available in Trading View. However, it makes the most sense to compare seven instruments to an eighth underlying instrument. As you can see in the default values, we included the NASDAQ as the eighth instrument since the other seven are part of the NASDAQ composite index. If you were to trade major currency pairs, then your eighth instrument would most likely be the U.S. Dollar (DXY).
The chart setup is important as well. You need to split your chart horizontally into 4 plots. Each plot would be at a different timing interval. The example shows 4 hr, 1 hr, 15 min and 5 min (left to right) charts. Now not only can we compare the instruments against each other, but we can do it across time to get an idea of the motion of each instrument.
Note, the instrument used on the chart is somewhat important. If the chart is set to a currency pair, but you have the RSI Tree setup for equities (as in the default) then you will get some odd behavior due to the times when these are open. Equities are 0930 to 1600 EST, whereas something like a currency would be open 24 hours a day.
Layout for default settings: www.tradingview.com
Bugs?
Kindly report any issues and I'll try to fix them promptly.
Thank you!

Saral Relative StrengthRelative Strength Indicator
### Overview
The Relative Strength (RS) Indicator is a robust tool designed to measure the performance of a security relative to a benchmark or another security. Unlike traditional indicators, this RS Indicator calculates the outperformance or underperformance in percentage terms, providing a clear and concise comparison.
The equation for calculation can be found in the code itself. This equation compares how much a security's price has changed over a given period (len) relative to the change in price of a benchmark over the same period. The result is expressed as a percentage, showing whether the security has outperformed or underperformed the benchmark. A positive RS value indicates outperformance, while a negative value signals underperformance.
Basically, this indicator is an enhanced version of 'Relative Strength' indicator of 'BharatTrader' Sir with added features like automatic divergence plotting, color-coded filled area and sector names for NSE F&O securities. Default values for some of the parameters are based on discussion by Subhadip Nandy Sir in Trader's Talk with Mr. Rohit Katwal.
### Input Parameters:
Source: The price of a security used in the calculation, with the default being the 'close' price.
Comparative Symbol: Ticker ID of the comparative security, with the default set to NIFTY 50.
Period-RS: The period for calculating the RS line, with a default of 22. The RS line measures the relative performance of the security against the benchmark, helping to identify outperformance or underperformance over time.
Period-MA: The period for calculating the Simple Moving Average (SMA) overlay on the RS line, with a default of 11. The SMA provides a smoothed view of the RS line, helping to identify trends more clearly.
Lookback - Zero Line Trend: Zero Line Trend look-back period, used to determine the angle of the RS line, with a default of 5. This parameter influences the color of the Zero Line based on whether the RS line’s angle is positive or negative.
Lookback - Divergence: Divergence look-back period, with a default of 2, used to detect divergence between the price and the RS line.
Display MA Line: Controls the display of the SMA line. When enabled, the SMA line is plotted over the RS line to indicate trend strength.
Toggle RS Color on MA Crossovers: Controls the color of the RS line. If disabled, the RS line is purple. If enabled, the RS line changes color based on its position relative to the SMA: green for RS > MA, red for RS < MA.
Display Zero Line Trend: Controls the display of the Zero Line. If disabled, the Zero Line is black. If enabled, the Zero Line’s color changes to green or maroon based on the RS line’s angle over time.
Display Divergence: Controls the display of divergence dots on the RS line, indicating potential reversal points.
Display Filled Area: Controls whether the area between the Zero Line and the RS line is filled with color. The fill color changes based on the relationship of the RS line with the SMA & Zero Line as given below.
- Dark Green: RS > 0 and RS > MA, indicating strong outperformance.
- Light Green: RS > 0 and RS < MA, indicating weakening outperformance.
- Dark Red: RS < 0 and RS < MA, indicating strong underperformance.
- Light Red: RS < 0 and RS > MA, indicating weakening underperformance.
Display Sector Name: Controls the display of sector names for NSE F&O securities, helping to plot RS with sectoral indices.
### Key Features:
RS Line:
The RS line represents the relative performance of a security against a benchmark over a specified period (default 22). It helps traders identify whether the security is outperforming or underperforming the benchmark.
SMA Overlay:
A Simple Moving Average (SMA) line is plotted over the RS line, with a default period of 11. The SMA provides a smoothed trend of the RS, making it easier to identify consistent performance trends.
Trend-Sensitive Zero Line:
The Zero Line’s color adapts based on the RS line’s trend:
- Green: Positive angle of the RS line, indicating upward momentum.
- Maroon: Negative angle, indicating downward momentum.
The color can be toggled, with an option to display the Zero Line in black.
Divergence Detection:
Automatically detects and highlights divergences.
- Positive Divergence: RS line rises while the price falls, marked by blue dots.
- Negative Divergence: RS line falls while the price rises, marked by black dots.
Color-Coded Fill Area:
The area between the RS line and the Zero Line is filled with color to visually distinguish different market conditions, with Dark and Light colors providing insight into the strength of the performance:
- Dark Green: Indicates strong outperformance (RS > 0 and RS > MA), suggesting the security is showing significant strength compared to the benchmark.
- Light Green: Indicates weakening outperformance (RS > 0 and RS < MA), signaling that while the security is still outperforming, its strength is diminishing.
- Dark Red: Indicates strong underperformance (RS < 0 and RS < MA), showing the security is significantly weaker than the benchmark.
- Light Red: Indicates weakening underperformance (RS < 0 and RS > MA), suggesting the security is still underperforming but may be regaining some strength.
Sectoral Strength:
Displays sector names for NSE F&O securities, helping users to compare the RS of individual securities with their respective sectoral indices. Comparative Security can be changed easily based on this sector name. Users need not to remember sector names for individual securities.
If any security is not categorized in a specific sector, CNX500 has been considered as a default sector for NSE F&O securities. For other securities, NIFTY50 has been considered as a default sector.

Comparative Relative Strength - HongQuanTraderThis script is designed to enhance your trading strategy by comparing the current symbol with another comparative symbol. The goal is to trade a symbol only when its Relative Strength (RS) value surpasses the long moving average of the RS value, ensuring more informed and strategic trading decisions.
Default Mode
In the default mode, the RS value is calculated by simply dividing the base symbol by the comparative symbol:
RS_SIMPLE = baseSymbol / comparativeSymbol
Period Mode
When you enable the “use period” option, the script uses the RS_PERIOD equation. This mode is particularly useful for comparing multiple symbols against the same comparative symbol, with the output normalized around 1.0 for easier comparison:
RS_PERIOD = baseSymbol / baseSymbol / (comparativeSymbol / comparativeSymbol )
By leveraging these calculations, you can gain deeper insights into the relative performance of different symbols, allowing you to make more precise and confident trading decisions. Whether you’re comparing stocks, currencies, or any other assets, this script provides a robust framework for enhancing your trading strategy.

Relative Strength NSE:Nifty for TF CommunityThis is a modified version of the Relative Strength Indicator (No confusion with RSI) originally by in.tradingview.com/u/modhelius/ based on The indicator calculates the relative strength between a selected stock and a comparative symbol (typically a market index like NSE:NIFTY).
Relative strength (RS) compares the performance of two assets, typically a stock and a market index, by dividing their percentage changes over a specific period. This indicator oscillates around zero:
- Greater than 0: Indicates the stock has outperformed the comparative symbol.
- Less than 0: Indicates the stock has underperformed the comparative symbol.
Key Enhancements:
This Relative Strength Indicator offers practical features to automatically adjusts the comparison period based on the chart’s timeframe, whether daily, weekly, or monthly, so you don’t have to make manual changes.
Secondly, if the selected stock has fewer bars than the comparison period, the indicator uses the shorter period to ensure accurate results. The default colors are hardcoded so they look fine for both dark and white themes, but of course can be changed.
You can customise the settings to fit your needs. The default period is set to 50/52, and the comparative symbol is NSE:NIFTY, but both can be changed. There’s also an option to toggle a moving average on or off, providing a smoother visual representation.
Relative Strength (Volatility Adjusted)The volatility adjusted relative strength indicator offers a more precise approach to traditional RS indicators by incorporating volatility adjustments into its calculations. This will provide traders with a more nuanced view of relative performance between a selected instrument and a comparison index.
Identifying Relative Strength (RS) and Weakness (RW) against a benchmark like the SPY is crucial for traders, as it highlights institutional activity in an equity, which retail traders rarely achieve on their own. However, the traditional method of simply comparing the rate of change of a stock to the rate of change for the SPY can be flawed. This method often fails to account for the inherent volatility of each stock, leading to misleading RS/RW readings.
Consider two stocks that both move in response to SPY's movements. If SPY moves significantly more than its average (measured by its ATR), and the stock does the same, traditional RS calculations might show strength when, in fact, the stock is just mirroring SPY's increased volatility. For instance, if SPY typically moves $0.25 an hour but suddenly moves $1, and a stock typically moves $0.50 but moves $2, the stock's apparent RS might be overstated, when in reality there is no relative strength for the stock.
By adjusting for volatility using the ATR (Average True Range), we normalize these movements and get a clearer picture of true RS/RW. For example, if SPY moves 5 times its average rate and a stock moves the same multiple of its own ATR, the RS should be considered neutral rather than strong. Similarly if a stock in absolute terms moves $1 while the SPY also moves $1 but the stock usually moves at twice the rate of the SPY, the stock should be considered relatively weak - not neutral.
Usage
Use this to identify stocks with actual strength or weakness compared to the market.
When the RS line is above 0 and above the moving average it indicates a stock with relative strength that is still gaining more strength.
When the RS line is above 0 but above the moving average it indicates a stock with relative strength that is currently losing strength.
When the RS line is below 0 and below the moving average it indicates a stock with relative weakness that is still losing strength.
When the RS line is below 0 but above the moving average it indicates a stock with relative weakness that is starting to gain back some strength.

Relative Strength according to Oster (RSO)Overview:
Relative Strength according to Oster (RSO) is an innovative tool that redefines how traders assess an asset's market strength. Moving beyond traditional indicators, RSO offers a sophisticated and highly responsive measure of an asset's potential to continue performing well. By integrating groundbreaking methodologies, RSO equips traders with unparalleled insights into market dynamics, making it an essential tool for anyone looking to stay ahead in today's fast-paced trading environment.
Understanding RSL (Relative Strength according to Levy):
At its core, Relative Strength according to Levy (RSL) is a powerful concept rooted in the idea that an asset currently exhibiting strength is more likely to maintain or even enhance that strength in the future. RSL calculates this by comparing an asset's current price to its moving average, providing a clear picture of its relative performance over time. The further its value is above 1, the higher the market momentum and vice versa. This relationship to the moving average is crucial, as it indicates not just where the asset stands today but also its trajectory in the context of historical performance. The ability to identify assets that consistently outperform is a game-changer for traders, and RSL has long been a cornerstone in this pursuit.
RSO vs. Traditional RSL: A Leap Forward
The RSO takes the traditional RSL concept and propels it into new territory with its innovative correlation-based approach. This is where RSO truly shines, offering a unique and sophisticated analysis that goes far beyond the basics.
Why RSO is Revolutionary:
Correlation Adjustment: The RSO doesn’t just measure an asset’s strength in isolation. Instead, it adjusts its readings based on how closely the asset's price movements correlate with a chosen benchmark. This groundbreaking feature ensures that the RSO is not just reactive to past performance but also predictive of how the asset might behave relative to the broader market, adding a layer of precision that is unparalleled in traditional strength indicators.
Superior Strength Option: With the RSO, traders have the option to include superior strength factors, adding another dimension of insight. This feature allows for more stable and reliable long-term signals. On the flip side, those who prefer a more dynamic trading style can opt to exclude this factor for more frequent, shorter-term signals. This level of customization is rare and sets the RSO apart as a truly adaptable tool.
Enhanced Market Insights: RSO’s correlation-based approach doesn’t just show how strong an asset is—it reveals how that strength is likely to develop in relation to the benchmark's underlying trends. This isn’t merely about comparing performance; it’s about understanding the asset’s potential trajectory in a much broader market context. Such insight is invaluable for making informed, strategic trading decisions.
Practical Application:
The RSO isn’t just innovative in theory; it’s designed for practical, real-world trading. Traders can set customized alerts based on RSO’s readings, ensuring they’re always aware of key buy or sell signals as they occur. The flexibility to include or exclude superior strength factors means that RSO can be tailored to fit any trading style, whether focused on long-term investments or short-term opportunities.
Conclusion:
In conclusion, the Relative Strength according to Oster (RSO) is more than just an indicator; it’s a breakthrough in market analysis. By integrating correlation adjustments and offering unparalleled customization options, RSO provides traders with insights that are both deeper and more actionable than ever before. This innovative tool is designed to empower traders, giving them the edge they need to succeed in an increasingly complex market landscape. Whether you’re a seasoned trader or just starting out, the RSO is a must-have tool for navigating market trends with confidence and precision.

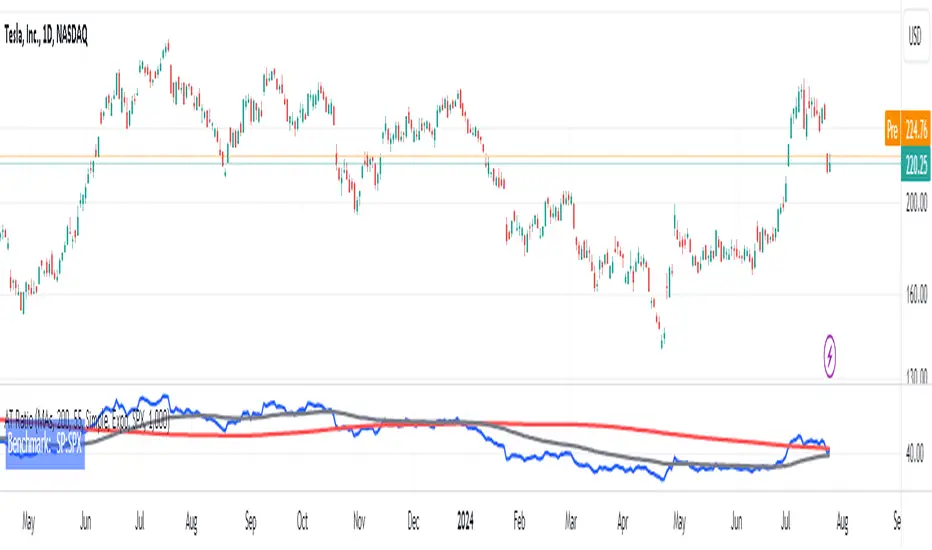
AT RatioAT Ratio
This indicator plots a ratio chart of 2 symbols, calculated as symbol1/symbol2.
The current chart symbol is used as symbol1.
A ratio chart allows to determine the relative strength of an asset compared to another asset.
It can be used for example to compare two stocks or a stock to its benchmark index, thus showing,
- if a stock has strength on its own (climbing ratio chart)
- if a stock just moves with the index (sideways ratio chart)
- if a stock is weaker than the index (falling ratio chart)
Inputs:
Style:
Plain: Only the ratio chart is plotted
MAs: Additional Moving Averages of the ratio chart are plotted
Perdiod Long: The period for the long MA
Perdiod Short: The period for the long MA
MA Type Long:
Simple: A simple MA is used
Expo: An exponential MA is used
MA Type Short:
Simple: A simple MA is used
Expo: An exponential MA is used
Ratio Symbol: The symbol to be used for symbol2
Factor: A factor the ratio value is multiplied by
Open-source script
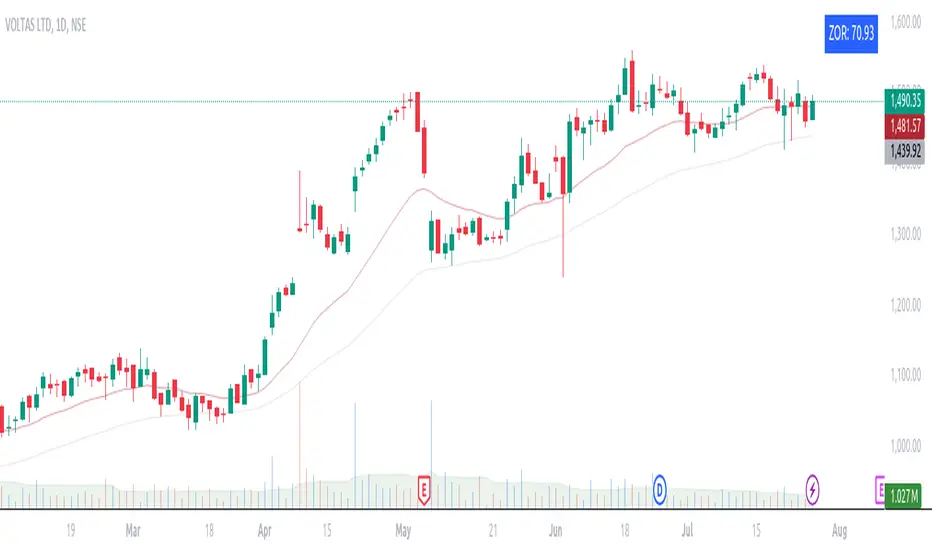
ZORZOR (Zone of Outperformance Ratio) with Supporting Indicators
This custom indicator introduces an approach to measuring asset performance through the Zone of Outperformance Ratio (ZOR), complemented by two supporting indicators for comprehensive market analysis.
1. ZOR (Zone of Outperformance Ratio)
The ZOR is the cornerstone of this indicator, offering a unique perspective on an asset's performance across multiple time zones:
Measures the degree of an asset's outperformance against a benchmark (default: NSE:NIFTY) across different time zones
Utilizes a weighted multi-timeframe approach for a holistic performance view
Combines performance ratios from 63, 126, 189, and 252-day zones and results in a score between 0-99, with higher scores indicating stronger outperformance across zones
Key Features:
Fully configurable weights for each timeframe (63, 126, 189, 252 days)
Customizable benchmark symbol
Color-coded display: Blue for scores ≥60 (strong performance), Red for scores <60 (weaker performance)
2. Supporting Indicators
To enhance analysis and provide context to the ZOR score, two additional indicators are included:
a) Distance to 52-week High:
Calculates the percentage distance between current price and 52-week high
Color-coded for quick interpretation:
Yellow-green when price is above 52-week high
Dark green when price is below 52-week high
Helps identify potential overbought conditions or breakout scenarios
b) Distance to EMA:
Shows percentage distance from current price to a user-defined EMA (default: 21-day)
Helps gauge short-term momentum relative to the trend
Useful for identifying potential mean reversion opportunities
Originality and Usefulness
The ZOR indicator offers a fresh perspective on relative performance by:
Combining multiple timeframes into a single, easy-to-interpret score
Applying a non-linear transformation to emphasize recent performance
Providing a flexible framework for comparing assets against any chosen benchmark
The supporting indicators complement the ZOR by offering additional context:
Distance to 52-week High helps identify potential trend strength and breakout scenarios
Distance to EMA provides insights into short-term momentum and potential mean reversion
This combination allows traders to:
Quickly identify outperforming assets across multiple timeframes
Assess whether an asset is extended from its long-term highs or short-term average
Make more informed decisions by considering relative performance, trend strength, and momentum in a single view
How to Use
1. Add the indicator to your chart
2. Customize settings in the indicator properties:
- Set benchmark symbol
- Toggle visibility of supporting indicators
- Customize EMA length for Distance to EMA
- Adjust ZOR calculation weights(Optional)
3. Interpret the color-coded labels:
- ZOR: Blue (strong performance) or Red (weaker performance)
- Distance to High: Yellow-green (above 52-week high) or Dark green (below)
- Distance to EMA: Purple label showing percentage
4. Use in conjunction with other technical and fundamental analysis for comprehensive trading decisions
This indicator provides a unique, multi-faceted approach to performance analysis, combining relative strength measurement with trend and momentum indicators for a holistic market view.
Ratio Chart with GMMA■About this indicator
This indicator divides the selected stocks by any stocks you specify and plots the result in a new pane.
At the same time, it plots the GMMA against the result of the division.
This allows you to see the relative chart and trend of the selected stock and the arbitrary stock.
Quote Symbol: Specify the denominator of the division. The default is TOPIX. Feel free to change it.
EMA Days: 5 to 30 days are indicated in green, and 75 to 200 days in red. Change the number of days and color freely.
Explanation of Effective Usage
It is recommended to enter an index for stocks specified in the Quote Symbol.
By entering the index, you can check the superiority of the selected issue and the index at a glance.
Example: By dividing AAPL by SP500, you can see on the chart whether AAPL is stronger or weaker relative to SP500.
(Similar concept to the Relative Strength Comparison RSC.)
At the same time, by plotting GMMA, you can confirm the trend of strength or weakness of the selected issue divided by the index. This is useful for swing trading and mid- to long-term trading.
The greater the distance between the short-term and long-term EMAs of the GMMA, the more the selected stocks outperform the index, and when the short-term and long-term EMAs cross, the trend ends and the stock underperforms the index.
■About the Chart
The screen below shows a chart plotted using this indicator.
For comparison with the regular chart, the upper screen shows only the GMMA plotted for the selected stocks.
From the red circle in the lower screen, a trend begins where the selected stocks outperform the index, and the trend ends at the blue circle.
When the trend ends, the selected stocks will underperform the index and it can be determined that it is more efficient to invest in another stock.
■このインジケーターについて
このインジケーターは選択している銘柄を、指定した任意の銘柄で割り算し、その結果を新規ペインにプロットします。
同時に、割り算の結果に対してGMMAをプロットします。
これにより選択した銘柄と、任意の銘柄の相対チャートとトレンドを把握することが出来ます。
Quote Symbol:割り算の分母を指定します。デフォルトはTOPIXです。自由に変更して下さい。
EMA日数:5~30日が緑、75~200日を赤で表記しています。日数と色は自由に変更して下さい。
■有効な使い方の説明
Quote Symbolで指定する銘柄は、指数を入力することを推奨します。
指数を入力することによって、選択した銘柄と指数の優位性を一目で確認出来ます。
例)AAPLをSP500で割ることで、SP500に比べてAAPLが相対的に強いのか、弱いのかをチャートで把握できます。
(相対力比較RSCと似たような考え方です。)
同時にGMMAをプロットすることで、選択した銘柄÷指数の強弱のトレンドを確認できます。これはスイングトレードや中長期トレードに役立ちます。
GMMAの短期EMAと長期EMAの距離が開いていくほど、指数より選択した銘柄がアウトパフォームしていると考えられ、短期EMAと長期EMAが交わるとトレンドは終了し、指数をアンダーパフォームします。
■チャートについて
下の画面がこのインジケーターを使用してプロットしたチャートです。
通常のチャートとの比較のため、上画面には選択した銘柄にGMMAだけをプロットしたものを表示しています。
下の画面の赤い丸から、選択した銘柄が指数をアウトパフォームするトレンドが始まり、青い〇でトレンドは終了します。
トレンドが終了した場合、選択した銘柄は指数をアンダーパフォームするので、別の銘柄に投資する方が効率的と判断できます。

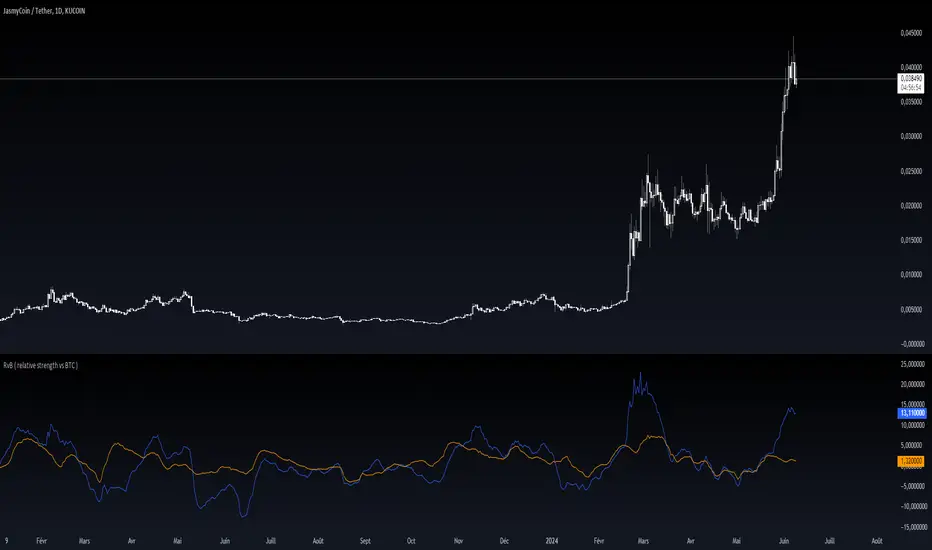
RvB ( relative strength vs BTC ) Overview
The "Coin vs BTC" indicator is designed to compare the performance of a selected cryptocurrency against Bitcoin (BTC) using Exponential Moving Averages (EMAs). By plotting the difference in EMA values as a percentage, this indicator helps traders visualize the relative strength of a cryptocurrency compared to Bitcoin over specified periods.
How It Works
EMA Calculation: The indicator calculates two EMAs (lengths specified by the user) for both the selected cryptocurrency and Bitcoin (BTC).
Length 1: Fast EMA (default: 9)
Length 2: Slow EMA (default: 21)
Score Calculation:
For both the selected coin and Bitcoin, it computes a score representing the percentage difference between the fast and slow EMAs relative to the previous closing price. This is done using the following steps:
Calculate the difference between the fast and slow EMAs.
Compute the percentage of this difference relative to the previous closing price.
Round the percentage to two decimal places for clarity.
Plotting: The scores for both the selected cryptocurrency and Bitcoin are plotted on the same chart:
Coin Score: Displayed in blue.
BTC Score: Displayed in orange.
Potential Uses
Relative Strength Analysis:
This indicator helps traders compare the strength of a cryptocurrency against Bitcoin. A higher score for the selected coin compared to Bitcoin indicates it is performing better relative to its moving averages.
Trend Confirmation:
By observing the EMA differences, traders can confirm trends and potential reversals. Consistently higher scores may indicate a strong upward trend, while lower scores could suggest a weakening trend.
Market Comparison:
This tool is particularly useful for those looking to understand how their selected cryptocurrency is performing in the broader market context, especially in relation to Bitcoin, which is often considered a market benchmark.
Correlated Movement Indicator V2Hello!
This script was briefly known as as Bing Chilling. I converted this to Pine Script V5 to ensure compliance with publishing requirements.
This script tracks RSI and inserts an indicator when correlated movement is detected. Proximity of current tick to indicator origin tick determines freshness of the indicator.
DO NOT sit on the indicator for a long time. This is not a magic solution. It is very accurate but, not always precise. Ensure that you use other factors to determine the relevance of the indicator on current tick. This script can technically be used on any security/commodity/currency. Your Mileage May Vary! Proceed with caution as always.
General Workflow:
Look at proximity to where the flag is placed, general volatility, and other indicators and you can potentially determine the direction/strength. Not always the duration. The indicator could be for 30s, 1hr, 1 day, or whatever the market feels like. It depends on precision/quantity of pricing data. ex. 30min tick rate pricing vs. 1 day tick rate pricing will change the scope.
So if the time scope shows all sell from 1 week -> 3 months except for a couple recent buy indicators on the day, then it may be a bad call long term but, might be good for a short term play. Very volatile. Careful.
If it was all green with long term indicators such as 1 month -> 1 year, then it looks more like a buy and forget type strategy.
If it's all green with a recent red then you can try and figure out what the relative the bottom is so you can buy for long term at a slightly more favorable price.
Flip all that for shorting. I highly recommend AGAINST shorting since the stakes are very different and usually involves taking out what is essentially a loan to bet against the market.
This script pairs nicely with the top pick indicator when you search "Heiken Ashi". I use that to determine peaks and pits to better guess a good time to open a position.
This should be used alongside other indicators. Good for short term day trading and long term hold and forget. (Don't actually forget. Set some alerts periodically.)
Please use caution. Please do not take what I've said here as fact and diamond pepe hands bet all on green to the moon. This, like all the other strategies and indicators on this site, are used as tools to inform you about potential and to categorize/depict data in a more human recognizable way. If you have access to a paper account try there first.
Happy trading!
- Zetsu

Relative Strength Universal
Relative strength is a ratio between two assets, generally it is a stock and a market average (index). RS implementation details are explained here .
This script automatically decides benchmark index for RS calculation based on market cap input values and input benchmark indices values.
Relative strength calculation:
"To calculate the relative strength of a particular stock, divide the percentage change over some time period by the percentage change of a particular index over the same time period". This indicator value oscillates around zero. If the value is greater than zero, the investment has been relatively strong during the selected period; if the value is less than zero, the investment has been relatively weak.
In this script, You can input market cap values and all are editable fields. If company market cap value is grater than 75000(Default value) then stock value will be compared with Nifty index. If company market cap is between 75000 and 25000 then stock value will be compared with midcap 150 to calculate RS. If marketcap is greater than 5000 and less than 25000 then RS will be calculated based on smallcap250. If marketcap is less than 5000 and greater than 500 then it will be compared with NIFTY_MICROCAP250
