RSI Multi Time FrameWhat it is
A clean, two-layer RSI that shows your chart-timeframe RSI together with a higher-timeframe (HTF) RSI on the same pane. The HTF line is drawn as a live segment plus frozen “steps” for each completed HTF bar, so you can see where the higher timeframe momentum held during your lower-timeframe bars.
How it works
Auto HTF mapping (when “Auto” is selected):
Intraday < 30m → uses 60m (1-hour) RSI
30m ≤ tf < 240m (4h) → uses 240m (4-hour) RSI
240m ≤ tf < 1D → uses 1D RSI
1D → uses 1W RSI
1W or 2W → uses 1M RSI
≥ 1M → keeps the same timeframe
The HTF series is requested with request.security(..., gaps_off, lookahead_off), so values are confirmed bar-by-bar. When a new HTF bar begins, the previous value is “frozen” as a horizontal segment; the current HTF value is shown by a short moving segment and a small dot (so you can read the last value easily).
Visuals
Current RSI (chart TF): solid line (color/width configurable).
HTF RSI: same-pane line + tiny circle for the latest value; historical step segments show completed HTF bars.
Guides: dashed 70 / 30 bands, dotted 60/40 helpers, dashed 50 midline.
Inputs
Higher Time Frame: Auto or a fixed TF (1, 3, 5, 10, 15, 30, 45, 60, 120, 180, 240, 360, 480, 720, D, W, 2W, M, 3M, 6M, 12M).
Length: RSI period (default 14).
Source: price source for RSI.
RSI / HTF RSI colors & widths.
Number of HTF RSI Bars: how many frozen HTF segments to keep.
Reading it
Alignment: When RSI (current TF) and HTF RSI both push in the same direction, momentum is aligned across frames.
Divergence across frames: Current RSI failing to confirm HTF direction can warn about chops or early slowdowns.
Zones: 70/30 boundaries for classic overbought/oversold; 60/40 can be used as trend bias rails; 50 is the balance line.
This is a context indicator, not a signal generator. Combine with your entry/exit rules.
Notes & limitations
HTF values do not repaint after their bar closes (lookahead is off). The short “live” segment will evolve until the HTF bar closes — this is expected.
Very small panels or extremely long histories may impact performance if you keep a large number of HTF segments.
Credits
Original concept by LonesomeTheBlue; Pine v6 refactor and auto-mapping rules by trading_mura.
Suggested use
Day traders: run the indicator on 5–15m and keep HTF on Auto to see 1h/4h momentum.
Swing traders: run it on 1h–4h and watch the daily HTF.
Position traders: run on daily and watch the weekly HTF.
If you find it useful, a ⭐ helps others discover it.
相對強弱指標(RSI)

Adaptive Convergence Divergence### Adaptive Convergence Divergence (ACD)
By Gurjit Singh
The Adaptive Convergence Divergence (ACD) reimagines the classic MACD by replacing fixed moving averages with adaptive moving averages. Instead of a static smoothing factor, it dynamically adjusts sensitivity based on price momentum, relative strength, volatility, fractal roughness, or volume pressure. This makes the oscillator more responsive in trending markets while filtering noise in choppy ranges.
#### 📌 Key Features
1. Dual Adaptive Structure: The oscillator uses two adaptive moving averages to form its convergence-divergence line, with EMA/RMA as signal line:
* Primary Adaptive (MA): Fast line, reacts quickly to changes.
* Following Adaptive (FAMA): Slow line, with half-alpha smoothing for confirmation.
2. Adaptive MA Types
* ACMO: Adaptive CMO (momentum)
* ARSI: Adaptive RSI (relative strength)
* FRMA: Fractal Roughness (volatility + fractal dimension)
* VOLA: Volume adaptive (volume pressure)
3. PPO Option: Switch between classic MACD or Percentage Price Oscillator (PPO) style calculation.
4. Signal Smoothing: Choose between EMA or Wilder’s RMA.
5. Visuals: Colored oscillator, signal line, histogram with adaptive transparency.
6. Alerts: Bullish/Bearish crossovers built-in.
#### 🔑 How to Use
1. Add to chart: Works on any timeframe and asset.
2. Choose MA Type: Experiment with ACMO, ARSI, FRMA, or VOLA depending on market regime.
3. Crossovers:
* Bullish (🐂): Oscillator crosses above signal → potential long entry.
* Bearish (🐻): Oscillator crosses below signal → potential short entry.
4. Histogram: expansion = strengthening trend; contraction = weakening trend.
5. Divergences:
* Bullish (hidden strength): Price pushes lower, but ACD turns higher = potential upward reversal.
* Bearish (hidden weakness): Price pushes higher, but ACD turns lower = potential downward reversal.
6. Customize: Adjust lengths, smoothing type, and PPO/MACD mode to match your style.
7. Set Alerts:
* Enable Bullish or Bearish crossover alerts to catch momentum shifts in real time.
#### 💡 Tips
* PPO mode normalizes values across assets, useful for cross-asset analysis.
* Wilder’s smoothing is gentler than EMA, reducing whipsaws in sideways conditions.
* Adaptive smoothing helps reduce false divergence signals by filtering noise in choppy ranges.

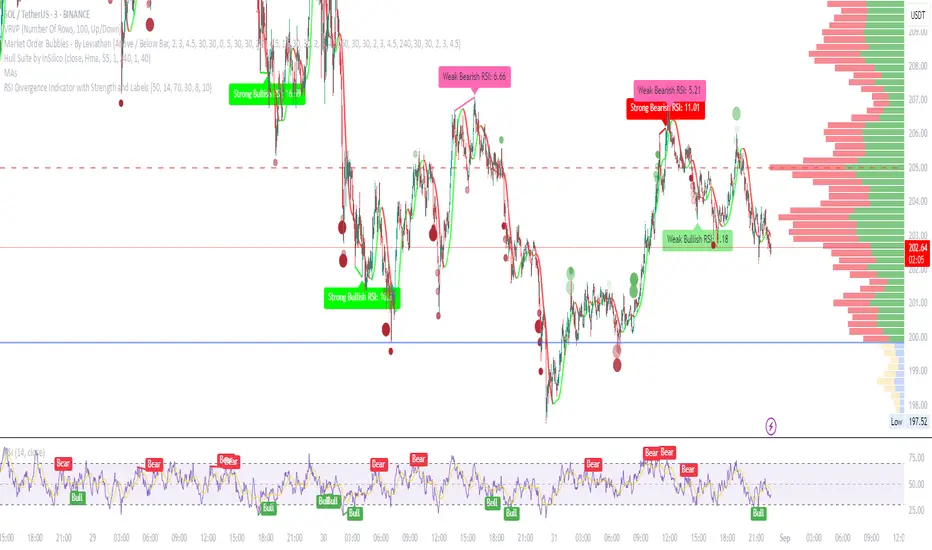
RSI Divergence Indicator with Strength and LabelsHere's a complete Pine Script (version 5) for a TradingView indicator that detects and plots bullish and bearish RSI divergences. This is based on a proven method that tracks price and RSI swings while RSI is in oversold/overbought territories, then checks for mismatched highs/lows within a configurable bar distance.
Divergence & Volume ThrustThis document provides both user and technical information for the "Divergence & Volume Thrust" (DVT) Pine Script indicator.
Part 1: User Guide
1.1 Introduction
The DVT indicator is an advanced tool designed to automatically identify high-probability trading setups. It works by detecting divergences between price and key momentum oscillators (RSI and MACD).
A divergence is a powerful signal that a trend might be losing strength and a reversal is possible. To filter out weak signals, the DVT indicator includes a Volume Thrust component, which ensures that a divergence is backed by significant market interest before it alerts you.
🐂 Bullish Divergence: Price makes a new low, but the indicator makes a higher low. This suggests selling pressure is weakening.
🐻 Bearish Divergence: Price makes a new high, but the indicator makes a lower high. This suggests buying pressure is weakening.
1.2 Key Features on Your Chart
When you add the indicator to your chart, here's what you will see:
Divergence Lines:
Bullish Lines (Teal): A line will be drawn on your chart connecting two price lows that form a bullish divergence.
Bearish Lines (Red): A line will be drawn connecting two price highs that form a bearish divergence.
Solid lines represent RSI divergences, while dashed lines represent MACD divergences.
Confirmation Labels:
"Bull Div ▲" (Teal Label): This label appears below the candle when a bullish divergence is detected and confirmed by a recent volume spike. This is a high-probability buy signal.
"Bear Div ▼" (Red Label): This label appears above the candle when a bearish divergence is detected and confirmed by a recent volume spike. This is a high-probability sell signal.
Volume Spike Bars (Orange Background):
Any price candle with a faint orange background indicates that the volume during that period was unusually high (exceeding the average volume by a multiplier you can set).
1.3 Settings and Configuration
You can customize the indicator to fit your trading style. Here's what each setting does:
Divergence Pivot Lookback (Left/Right): Controls the sensitivity of swing point detection. Lower numbers find smaller, more frequent divergences. Higher numbers find larger, more significant ones. 5 is a good starting point.
Max Lookback Range for Divergence: How many bars back the script will look for the first part of a divergence pattern. Default is 60.
Indicator Settings (RSI & MACD):
You can toggle RSI and MACD divergences on or off.
Standard length settings for each indicator (e.g., RSI Length 14, MACD 12, 26, 9).
Volume Settings:
Use Volume Confirmation: The most important filter. When checked, labels will only appear if a volume spike occurs near the divergence.
Volume MA Length: The lookback period for calculating average volume.
Volume Spike Multiplier: The core of the "Thrust" filter. A value of 2.0 means volume must be 200% (or 2x) the average to be considered a spike.
Visuals: Customize colors and toggle the confirmation labels on or off.
1.4 Strategy & Best Practices
Confluence is Key: The DVT indicator is powerful, but it should not be used in isolation. Look for its signals at key support and resistance levels, trendlines, or major moving averages for the highest probability setups.
Wait for Confirmation: A confirmed signal (with a label) is much more reliable than an unconfirmed divergence line.
Context Matters: A bullish divergence in a strong downtrend might only lead to a small bounce, not a full reversal. Use the signals in the context of the overall market structure.
Set Alerts: Use the TradingView alert system with this script. Create alerts for "Confirmed Bullish Divergence" and "Confirmed Bearish Divergence" to be notified of setups automatically.

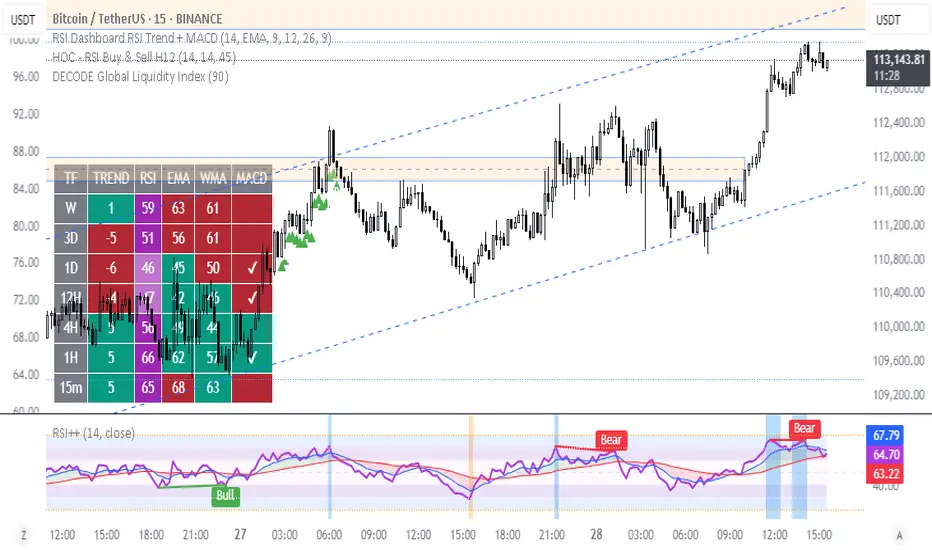
RSI Divergence + MTF PanelRSI Divergence + MTF Panel
📊 Short Description
A powerful indicator for detecting RSI divergences with a multi-timeframe panel that helps traders find high-quality trading opportunities across different time intervals.
✨ Key Features
🎯 Automatic Divergence Detection
- **Bullish Divergence**: Price makes lower lows while RSI makes higher lows
- **Bearish Divergence**: Price makes higher highs while RSI makes lower highs
- Visual divergence marking with lines on the chart
- Customizable colors and line styles
📈 Multi-Timeframe Panel (MTF)
- Displays RSI from 4 fixed timeframes simultaneously (5m, 15m, 1H, 4H)
- Color-coded RSI levels:
- 🔴 Red: RSI > 70 (overbought)
- 🟢 Green: RSI < 30 (oversold)
- ⚪ White: RSI between 30-70 (neutral zone)
⚙️ Flexible Settings
- RSI period (default 14)
- Divergence detection threshold
- Data source selection (close, hl2, hlc3, ohlc4)
- Color and transparency customization
- Enable/disable indicator components
📋 How to Use
1. **Add the indicator to your chart** - it will automatically start scanning for divergences
2. **Adjust parameters** to match your trading style
3. **Monitor the MTF panel** for overall market condition overview
4. **Look for divergences** combined with other signals for confirmation
🎯 Perfect for:
- Swing trading
- Intraday trading
- Finding reversal points
- Confirming trading signals
- Multi-timeframe analysis
⚡ Advantages
- **Automation**: No need to manually search for divergences
- **Multi-functionality**: RSI analysis + MTF overview in one indicator
- **Visual clarity**: Clear signals and color coding
- **Performance**: Optimized code for fast operation
- **Flexibility**: Wide customization options
📊 Technical Details
- Uses standard RSI with customizable period
- Divergence detection algorithm based on peaks and valleys
- MTF panel updates in real-time
- Supports all asset types (stocks, forex, crypto, commodities)
🔧 Usage Recommendations
- Combine with other indicators for signal confirmation
- Consider overall market trend
- Use risk management rules
- Test settings on historical data
👥 Suitable for:
- Beginners (easy to use)
- Experienced traders (flexible settings)
- All trading styles and timeframes
---
*This indicator is designed to enhance trading efficiency and help make informed trading decisions. Always follow risk management rules and don't rely on just one indicator.*

RSI Divergence ProjectionRSI Divergence Projection
Go beyond traditional, lagging indicators with this advanced RSI Divergence tool. It not only identifies four types of confirmed RSI divergence but also introduces a unique, forward-looking engine. This engine spots potential divergences as they form on the current candle and then projects the exact price threshold required to validate them.
Our core innovation is the Divergence Projection Line, a clean, clutter-free visualization that extends this calculated price target into the future, providing a clear and actionable level for your trading decisions.
The Core Logic: Understanding RSI Divergence
For those new to the concept, RSI Divergence is a powerful tool used to spot potential market reversals or continuations. It occurs when the price of an asset is moving in the opposite direction of the Relative Strength Index (RSI). This indicator automatically detects and plots four key types:
Regular Bullish Divergence: Price prints a lower low, but the RSI prints a higher low. This often signals that bearish momentum is fading and a potential reversal to the upside is near.
Hidden Bullish Divergence: Price prints a higher low, but the RSI prints a lower low. This is often seen in an uptrend and can signal a continuation of the bullish move.
Regular Bearish Divergence: Price prints a higher high, but the RSI prints a lower high. This suggests that bullish momentum is weakening and a potential reversal to the downside is coming.
Hidden Bearish Divergence: Price prints a lower high, but the RSI prints a higher high. This is often seen in a downtrend and can signal a continuation of the bearish move.
Confirmed divergences are plotted with solid-colored lines on the price chart and marked with a "B" (Bearish/Bullish) or "HB" (Hidden Bearish/Hidden Bullish) label.
The Core Innovation: The Divergence Projection
This is where the indicator truly shines and sets itself apart. Instead of waiting for a pivot point to be confirmed, our engine analyzes the current, unclosed candle.
Potential Divergence Detection: When the indicator notices that the current price and RSI are setting up for a potential divergence against the last confirmed pivot, it will draw a dashed line on the chart. This gives you a critical head-start before the signal is confirmed.
The Projection Line (Our Innovation): This is the game-changer. Rather than cluttering your chart with messy labels, the indicator calculates the exact closing price the next candle needs to achieve to make the current RSI level equal to the RSI of the last pivot.
It then projects a clean, horizontal dashed line at this price level into the future.
Attached to the end of this line is a single, consolidated label that tells you the type of potential divergence and the exact threshold price.
This unique visualization transforms a vague concept into a precise, actionable price target, completely free of chart clutter.
How to Use This Indicator
1. Trading Confirmed Divergences:
Look for the solid lines and the "B" or "HB" labels that appear after a candle has closed and a pivot is confirmed.
A Regular Bullish divergence can be an entry signal for a long position, often placed after the confirmation candle closes.
A Regular Bearish divergence can be an entry signal for a short position.
Hidden Divergences can be used as confirmation to stay in a trade or to enter a trade in the direction of the prevailing trend.
2. Using the Divergence Projection for a Tactical Advantage:
When a dashed line appears on the current price action, you are seeing a potential divergence in real-time.
Look to the right of the current candle for the Projection Line. The price level of this line is your key level to watch.
Example (Potential Bullish Divergence): You see a dashed green line forming from a previous low to the current lower low. To the right, you see a horizontal line projected with a label: "Potential Bull Div | Thresh: 10,750.50".
Interpretation: This means that if the next candle closes below 10,750.50, the RSI will not be high enough to form a divergence. However, if the price pushes up and the next candle closes above 10,750.50, the bullish divergence remains intact and is more likely to be confirmed. This gives you a concrete price level to monitor for entry or exit decisions.
How the Projection Engine Works: A Deeper Dive
To fully trust this tool, it's helpful to understand the logic behind it. The projection engine is not based on guesswork or repainting; it's based on a precise mathematical reverse-engineering of the RSI formula.
The Concept: The engine calculates the "tipping point." The Threshold Price is the exact closing price at which the new RSI value would be identical to the RSI value of the previous pivot point. It answers the question: "For this potential divergence to remain valid, where does the next candle need to close?"
The Technicals: The script takes the target RSI from the last pivot, reverse-engineers the formula to find the required average gain/loss ratio, and then solves for the one unknown variable: the gain or loss needed on the next candle. This required price change is then added to or subtracted from the previous close to determine the exact threshold price.
This calculation provides the precise closing price needed to hit our target, which is then plotted as the clean and simple Projection Line on your chart.
Features and Customization
- RSI Settings: Adjust the RSI period and source.
- Divergence Detection: Fine-tune the pivot lookback periods and the min/max range for detecting divergences.
- Price Source: Choose whether to detect divergences using candle Wicks or Bodies.
- Display Toggles: Enable or disable any of the four divergence types, as well as the entire projection engine, to keep your chart as clean as you need it.
Summary of Advantages
- Proactive Signals: Get ahead of the market by seeing potential divergences before they are confirmed.
- Unprecedented Clarity: Our unique Projection Line eliminates chart clutter from overlapping labels.
- Actionable Data: The threshold price provides a specific, objective level to watch, removing guesswork.
- Fully Customizable: Tailor the indicator's settings to match any timeframe or trading strategy.
- All-in-One Tool: No need for a separate RSI indicator; everything you need is displayed directly and cleanly on the price action.
We hope this tool empowers you to make more informed and timely trading decisions. Happy trading

RSI Plus – Divergence + EMA/WMARSI Plus – Divergence + EMA/WMA
This is an advanced RSI indicator designed for traders who want to maximize the power of RSI.
Beyond the standard RSI plot, this tool adds extra features to help analyze trends and identify better entry signals.
Key Features:
Standard RSI with highlighted zones (20–30, 30–40, 40–60, 60–70, 70–80)
Multiple smoothing options: SMA, EMA, SMMA, WMA, VWMA
Bullish/Bearish divergence detection with labels and alerts
WMA(45) on RSI for mid-term trend confirmation
EMA vs WMA45 color-fill (green for bullish, red for bearish)
Multi-timeframe support (Daily, H4, H1)
How to use:
Spot potential reversals with RSI divergence
Confirm trend direction when RSI EMA > WMA45 (bullish) or EMA < WMA45 (bearish)

RSI Plus – Divergence + EMA/WMAThis is an advanced RSI indicator with multi-timeframe dashboard support.
Features:
Customizable Moving Averages (EMA, WMA, SMA, VWMA, SMMA)
Divergence detection
RSI zones with background highlights
Clear buy/sell signals with visual alerts
Perfect for traders who want both classic RSI analysis and cross-timeframe confirmation in one tool.
Mean Reversion IndicatorMean Reversion Indicator
This indicator generates buy and sell signals based on a mean reversion framework.
Buy signals appear when price conditions suggest oversold levels with confirmation filters applied.
Sell signals appear when price conditions suggest overbought levels or profit-taking opportunities.
Includes background shading to highlight the backtest window.
Alerts are available for both Buy and Sell signals, so users can receive notifications in real-time.
⚠️ This indicator is for analysis and alerts only. It does not include strategy backtesting or trade execution.

SExI - Super Exhaustion Indicator [Da_Prof]As we know, the RSI can remain at "overbought" or "oversold" levels for long periods of time while the price continues in that direction. The SExI (Super Exhaustion Indicator) is an indicator designed to help detect exhaustion of strong moves.
The SExI is a combination of the RSI and "upper" Aroon. For the indicator to trigger, the RSI has to be above or below a top/bottom trigger line when the Aroon has had a set number of drives up or down correspondingly. An Aroon top drive is defined as the Aroon hitting 100% on the current candle when the previous candle was below 100%. An Aroon bottom drive is defined as the Aroon hitting 0% on the current candle when the previous candle was above 0%. Consecutive top or bottom drives are counted and exhaustion triggers when these drives hit a setpoint (default is 5 drives = the Aroon exhaustion trigger). When Aroon exhaustion is triggered and the RSI is correspondingly above/below a trigger line, the overall indicator signals exhaustion. There are two lines for bottoms and tops, one each for a "normal" trigger and and an "extreme" trigger.
The Aroon drives are visualized at the top and bottom of the indicator. The RSI is plotted as a line that crosses top and bottom trigger lines. There are extreme trigger values for both the bottom and top exhaustion triggers.
--Da_Prof

cd_RSI_Divergence_CxGeneral:
The Relative Strength Index (RSI) is a momentum oscillator widely used by traders in price analysis. In addition to showing overbought/oversold zones, divergences between RSI and price are also tracked to identify trading opportunities.
The general consensus is that oscillators alone are not sufficient for entries and should be evaluated together with multiple confirmations.
This oscillator is designed as an additional confirmation/compatible tool for strategies that already use higher time frame (HTF) sweeps and lower time frame (LTF) confirmations such as Change in State Delivery (CISD) or Change of Character (CHOCH).
Features:
While RSI oscillators are commonly displayed in line format (classic), this indicator also offers candlestick-style visualization.
Depending on the selected source, period length, and EMA length, RSI can be displayed as lines and/or candlesticks.
Divergence detection & tracking:
Price and RSI values are monitored on the chosen higher time frame (from the menu) to determine highs and lows. For divergence display, the user can choose between two modes:
1- Alignment with HTF Sweep
2- All
1 - Alignment with HTF Sweep:
First, the price must sweep the previous high/low of the candle on the HTF (i.e., break it) but fail to continue in that direction and return inside (sweep).
If this condition is met, RSI values are checked:
If price makes a high sweep but RSI fails to make a new high → divergence is confirmed.
If price makes a low sweep but RSI fails to make a new low → divergence is confirmed.
Divergence is then displayed on the chart.
2 - All:
In this mode, sweep conditions are ignored. Divergence is confirmed if:
Price makes a new high on HTF but RSI does not.
RSI makes a new high on HTF but price does not.
Price makes a new low on HTF but RSI does not.
RSI makes a new low on HTF but price does not.
Menu & Settings:
RSI visualization (source + period length + EMA period length)
Option to choose classic/candlestick style display
Color customization
Higher time frame selection
Adjustable HTF boxes and table display
Final notes:
This oscillator is designed as an additional confirmation tool for strategies based on HTF sweep + LTF CISD/CHOCH confirmation logic. The chosen HTF in the oscillator should match the time frame where sweeps are expected.
Divergence signals from this oscillator alone will not make you profitable.
For spot trades, monitoring sweeps and divergences on higher time frames is more suitable (e.g., Daily–H1 / Weekly–H4).
My personal usage preferences:
Entry TF: 3m
HTF bias: Daily + H1
Sweep + CISD: 30m / 3m
Market Structure: 3m
RSI divergence: HTF = 30m
If all of them align bullish or bearish ( timeframe alignment ), I try to take the trade.
I’d be glad to hear your feedback and suggestions for improvement.
Happy trading!

Combined RSI EnsembleRip from TrendSipider so all cred to them for the idea:
A combined RSI Ensemble indicator that colors candles based on both overbought (≥80) and oversold (≤30) conditions using three RSI lengths (14, 9, 5). It assigns distinct colors for varying levels of overbought (gray, yellow, orange, red) and oversold (gray, light green, dark green, neon green) signals. The script also registers "Surely Overbought/Oversold" and "Probably Overbought/Oversold" signals for use in scanning, backtesting, and alerts.

Dynamic Value Zone Oscillator (DVZO) - @CRYPTIK1Dynamic Value Zone Oscillator (DVZO) @CRYPTIK1
Introduction: What is the DVZO?
The Dynamic Value Zone Oscillator (DVZO) is a powerful momentum indicator that reframes the classic "overbought" and "oversold" concept. Instead of relying on a fixed lookback period like a standard RSI or Stochastics, the DVZO measures the current price relative to a significant, higher-timeframe Value Zone (e.g., the previous week's entire price range).
This gives you a more contextual and structural understanding of price. The core question it answers is not just "Is the price moving up or down quickly?" but rather, "Where is the current price in relation to its recently established area of value?"
This allows traders to identify true "premium" (overbought) and "discount" (oversold) levels with greater accuracy, leading to higher-probability reversal and trend-following signals.
The Core Concept: Price vs. Value
The market is constantly trying to find equilibrium or "fair value." The DVZO is built on the principle that the high and low of a significant prior period (like the previous day, week, or month) create a powerful area of perceived value.
The Value Zone: The range between the high and low of the selected higher timeframe. The midpoint of this zone is the equilibrium (0 line on the oscillator).
Premium Territory (Distribution Zone): When price breaks above the Value Zone High (+100 line), it is trading at a premium. This is an area where sellers are more likely to become active and buyers may be over-extending.
Discount Territory (Accumulation Zone): When price breaks below the Value Zone Low (-100 line), it is trading at a discount. This is an area where buyers are more likely to see value and sellers may be exhausted.
By anchoring its analysis to these significant structural levels, the DVZO filters out much of the noise from lower-timeframe price fluctuations.
Key Features
The Oscillator:
The main blue line visualizes exactly where the current price is within the context of the Value Zone.
+100: The high of the Value Zone.
0: The midpoint/equilibrium of the Value Zone.
-100: The low of the Value Zone.
Automatic Divergence Detection:
The DVZO automatically identifies and plots bullish and bearish divergences on both the price chart and the oscillator itself.
Bullish Divergence: Price makes a new low, but the DVZO makes a higher low. This is a strong signal that downside momentum is fading and a reversal to the upside is likely.
Bearish Divergence: Price makes a new high, but the DVZO makes a lower high. This indicates that upside momentum is waning and a pullback is probable.
Value Migration Histogram:
The purple histogram in the background visualizes the width of the Value Zone.
Expanding Histogram: Volatility is increasing, and the accepted value range is getting wider.
Contracting Histogram: Volatility is decreasing, and the price is coiling in a tight range, often in anticipation of a major breakout.
How to Use the DVZO: Trading Strategies
1. Reversion Trading
This is the most direct way to use the indicator.
Look for Buys: When the DVZO line drops below -100, the price is in the "Accumulation Zone." Wait for the price to show signs of strength (e.g., a bullish candle pattern) and the DVZO line to start turning back up towards the -100 level. This is a high-probability mean reversion setup.
Look for Sells: When the DVZO line moves above +100, the price is in the "Distribution Zone." Look for signs of weakness (e.g., a bearish engulfing candle) and the DVZO line to start turning back down towards the +100 level.
2. Divergence Trading
Divergences are powerful confirmation signals.
Entry Signal: When a Bullish Divergence appears, it provides a strong entry signal for a long position, especially if it occurs within the Accumulation Zone (below -100).
Exit/Short Signal: When a Bearish Divergence appears, it can serve as a signal to take profit on long positions or to look for a short entry, especially if it occurs in the Distribution Zone (above +100).
3. Best Practices & Settings
Timeframe Synergy: The DVZO is most effective when your chart timeframe is lower than your selected Value Zone Source.
For Day Trading (e.g., 1H, 4H chart): Use the "Previous Day" Value Zone.
For Swing Trading (e.g., 1D, 12H chart): Use the "Previous Week" or "Previous Month" Value Zone.
Confirmation is Key: The DVZO is a powerful tool, but it should not be used in isolation. Always combine its signals with other forms of analysis, such as market structure, support/resistance levels, and candlestick patterns, for confirmation.
DK RSI [NMTUAN]The RSI Lines in RSI DK
A basic RSI DK indicator typically consists of the following components:
The Main RSI Line: Usually set to a period of 14, this is the most common line for most traders. It provides an overall view of market momentum.
The Short-Term RSI Line: Usually set to a period of 7, 5, or even 3. This line moves faster and is more sensitive to short-term fluctuations. It can be used to identify early entry/exit points.
The Long-Term RSI Line: Typically set to a period of 21, 28, or 30. This line moves more slowly, providing a stable view of the long-term trend. It helps filter out "noise" and confirm the main trend.
How to Use RSI DK
Combining multiple RSI lines offers several advantages:
Signal Confirmation: When different RSI lines confirm a signal (e.g., all are in the overbought or oversold zone), the reliability of that signal increases significantly.
Divergence: This is one of the strongest signals of the RSI. With RSI DK, traders can easily spot potential divergence signals when a short-term RSI line diverges from price, while the long-term RSI line is still confirming the trend.
Crossovers: Similar to other momentum indicators, crossovers between RSI lines in RSI DK are also very useful. For example, when the short-term RSI line crosses above the long-term one, it could be a signal that upward momentum is gaining strength.
Multi-Timeframe Analysis: RSI DK lets you analyze momentum across different timeframes right on one chart, which saves time and improves analysis efficiency.

RSI Multi Length + Normalized BBW (Butrait)RSI + BB: este indicador muestra cuando el valor esta en sobre venta o sobre compra.

BTC Dominance & Price RSI Analyzer by Sajad BagheriThis indicator analyzes the Relative Strength Index (RSI) for three key cryptocurrency metrics:
Bitcoin Price (BTC/USDT)
Bitcoin Dominance (BTC.D)
Tether Dominance (USDT.D)
It provides a comprehensive view of market momentum by displaying three RSI lines in a single pane, allowing traders to identify overbought and oversold conditions across these important metrics simultaneously.
RSI with Moving Averages[UO] EnhancedWhat This Indicator Does
Displays the RSI (Relative Strength Index) with two customizable moving averages to help identify trend direction and momentum shifts.
Key Features
RSI Line: Shows momentum (overbought above 70, oversold below 30)
Two Moving Averages: Smooth RSI signals and show trend direction
Color-Coded Fills: Visual areas between lines indicate bullish/bearish conditions
Support/Resistance Lines: Bull market support (40) and bear market resistance (60)
Customization Options
Moving Average Types: Choose SMA or EMA for each line
Periods: Adjust RSI (14), First MA (13), Second MA (33)
Visual Elements: Toggle background shading and fills on/off
Colors & Styles: Customize all line colors and widths in Style tab
How to Read It
Green Fill: Second MA below first MA (bullish momentum)
Red Fill: Second MA above first MA (bearish momentum)
RSI Above 70: Potentially overbought
RSI Below 30: Potentially oversold
Perfect for traders wanting enhanced RSI analysis with flexible moving average confirmation signals.

Inside Candle DivergenceStudy Material: Inside Candle Divergence Indicator (aiTrendview)
1. Introduction
The Inside Candle Divergence Indicator is a custom tool built on TradingView using Pine Script. It is designed to help traders identify potential reversal points or trend continuations using a mix of candlestick analysis, RSI (Relative Strength Index), VWAP (Volume Weighted Average Price), Pivot Points, and Volume analytics. The tool also provides a dashboard table on the chart, summarizing all key values in a single glance for traders and analysts.
This indicator is not just a signal generator but also an educational framework—explaining how different concepts in technical analysis combine to build a systematic approach for market entries and exits.
________________________________________
2. Core Concepts Behind the Tool
A. Inside Candle Pattern
An Inside Candle forms when the current candle’s high is lower than or equal to the previous candle’s high, and the low is higher than or equal to the previous candle’s low.
• This means the entire price action of the current candle is "inside" the range of the previous candle.
• A bullish inside candle occurs when the close is higher than the open.
• A bearish inside candle occurs when the close is lower than the open.
This pattern shows market indecision but also sets up potential breakouts or trend reversals.
________________________________________
B. RSI (Relative Strength Index)
The indicator calculates RSI using the formula from the ta.rsi() function in TradingView. RSI helps measure momentum in the market.
• A low RSI (below 25) signals an oversold zone → possible buy.
• A high RSI (above 75) signals an overbought zone → possible sell.
By combining RSI with the Inside Candle, the indicator ensures that signals are triggered only when momentum and price patterns confirm each other.
________________________________________
C. Buy & Sell Signals
• Buy Signal: Triggered when RSI < Buy Level (default 25) and a bullish inside candle forms.
• Sell Signal: Triggered when RSI > Sell Level (default 75) and a bearish inside candle forms.
When triggered, the chart displays a BUY (green label below candle) or SELL (red label above candle) marker. The indicator also saves the entry price and signal bar for future reference inside the dashboard.
________________________________________
D. VWAP (Volume Weighted Average Price)
VWAP is calculated using the typical price (H+L+C)/3 and weighting it by volume.
• VWAP shows the average trading price weighted by volume, widely used by institutions.
• The tool calculates the distance of price from VWAP in % terms.
• If price is far above VWAP, the market may be overheated (overbought). If far below, it may be undervalued (oversold).
________________________________________
E. Volume Analysis
The tool splits volume into Buy Volume and Sell Volume:
• Buy Volume: If close > open.
• Sell Volume: If close ≤ open.
• Cumulative totals are maintained, and percentages are calculated to show what proportion of total market volume is bullish vs bearish.
• A progress bar style visual (using blocks █) shows the dominance of buyers or sellers.
This allows traders to quickly measure whether buyers or sellers are controlling the market trend.
________________________________________
F. Daily Pivot Points
Pivot Points are calculated using the previous day’s high, low, and close:
• Pivot = (High + Low + Close) / 3
• R1, S1, R2, S2, R3, S3 levels are derived from this pivot.
• These levels act as support and resistance zones.
The script plots Pivot, R1, and S1 lines on the chart for easy reference.
________________________________________
G. Trend Direction
The indicator checks where the price is compared to R1 and S1:
• If price > R1 → Bullish Trend
• If price < S1 → Bearish Trend
• Otherwise → Neutral Trend
The trend direction is displayed in the dashboard with arrows (↑, ↓, →).
________________________________________
H. Price Change Calculation
The tool calculates:
• Price Change = Current Close – Previous Close
• Percentage Change = (Change / Previous Close) × 100
• Displays ▲ (green upward) or ▼ (red downward) with the exact percentage.
This gives traders a quick snapshot of intraday price movement.
________________________________________
I. Dashboard Table
One of the most powerful features is the real-time dashboard table shown on the chart. It contains:
1. Symbol & Price Info (Current ticker, price, change %)
2. RSI Reading (with color coding: green for oversold, red for overbought)
3. VWAP and Distance from VWAP
4. Volume Analysis with Progress Bar (Buy vs Sell %)
5. Pivot Levels (Pivot, R1, S1)
6. Trend Direction (Bullish, Bearish, Neutral)
7. Signal Status (Last Buy/Sell signal with entry price)
This reduces the need for multiple indicators and gives traders a command-center view directly on the chart.
________________________________________
J. Alerts
The tool generates alerts whenever a Buy or Sell condition is met. Traders can set up TradingView alerts to be notified instantly when:
• Buy Signal Alert → RSI oversold + Bullish inside candle
• Sell Signal Alert → RSI overbought + Bearish inside candle
This ensures no opportunity is missed even if you’re not actively monitoring the chart.
________________________________________
K. Background Highlights
The chart background also changes faintly (light green or light red) when a Buy or Sell condition is triggered. This gives traders visual confirmation along with signals and alerts.
________________________________________
3. Practical Use of This Tool
• Scalpers & Intraday Traders can use it for quick momentum-based entries.
• Swing Traders can use the RSI + Inside Candle + Pivot Points to find medium-term reversals.
• Analysts can use the dashboard for real-time summaries in reports.
• Volume Analysis helps understand institutional activity.
Remember: This is not a standalone holy grail. It must be used with proper risk management and confirmation from higher timeframes.
________________________________________
4. Strict Disclaimer (aiTrendview)
⚠️ Disclaimer from aiTrendview:
This indicator is designed for educational and analytical purposes only. It is not financial advice or a guaranteed trading strategy. Markets are inherently risky and unpredictable; past performance of indicators does not ensure future results. Trading involves risk of financial loss, and traders must use proper risk management, stop-loss, and independent judgment.
aiTrendview strictly follows TradingView.com rules and compliance guidelines.
Any misuse of this tool, its code, or analytical features for unauthorized commercial purposes, false promises, or misleading activities is strictly discouraged. The creators of this script and aiTrendview will not be responsible for any losses, damages, or misuse arising from its application. Always trade responsibly and only with money you can afford to lose.
________________________________________

MACD Bullish Divergence + Multi-TF RSI Buy SignalsNew script to overlap MACD Bullish Divergence and RSI signals to give confluence.

Penguin Trend with RSI on DiffVisualizes volatility regime via the percent spread between the upper Bollinger Band and the upper Keltner Channel, with bar colors from a lightweight trend engine and an RSI computed on the Diff signal. Supports SMA/EMA/WMA/RMA/HMA/VWMA/VWAP and an optional calculation timeframe. Defaults preserve the original look and behavior.
Penguin Trend with RSI on Diff shows expansion vs. compression in price action by comparing two classic volatility envelopes. It computes:
Diff% = (UpperBB − UpperKC) / UpperKC × 100
• Diff > 0: Bollinger Bands are wider than Keltner Channels → expansion / momentum regime
• Diff < 0: BB narrower than KC → compression / squeeze regime
A white “Average Diff” line smooths Diff% (default: SMA(5)) to highlight regime shifts. Bars are colored only when Diff > 0 to focus on expansion phases. A lightweight trend engine defines four states from a fast/slow MA bias and a short “thrust” MA on ohlc4:
• Green: Bullish bias and thrust > fast MA (healthy upside thrust)
• Red: Bearish bias and thrust < fast MA (healthy downside thrust)
• Yellow: Bullish bias but thrust ≤ fast MA (pullback/weakness)
• Blue: Bearish bias but thrust ≥ fast MA (bear rally/short squeeze)
RSI on Diff:
The indicator adds an RSI applied to Diff% to gauge momentum of the expansion/compression signal itself. Choose between Built-in RSI or a manual RMA-based computation, and optionally smooth it. Default OB/OS lines are 70/30.
How it works:
• Bollinger Bands (BB): Basis = selected MA of src (default SMA(20)); Width = StdDev × Mult (default 2.0)
• Keltner Channels (KC): Basis = selected MA of src (default SMA(20)); Width = ATR(kcATR) × Mult (defaults 20 and 2.0)
• Diff%: Safe division guards against division-by-zero
• MA engine: Select SMA / EMA / WMA / RMA / HMA / VWMA / VWAP for BB/KC bases, Average Diff, and trend components (VWAP is session-anchored)
• Calculation timeframe: Compute internals on a chosen TF via request.security() while viewing any chart TF
Inputs (key):
• Calculation timeframe: Empty = chart TF; set e.g., 60/240 to compute on that TF
• BB: Length, StdDev Mult, MA Type
• KC: Basis Length, ATR Length, Multiplier, MA Type
• Average Diff: Length and MA Type
• RSI on Diff: RSI Length, Method (Built-in or Manual RMA), Smoothing Length, OB/OS levels, show/hide
• Trend Engine: Fast/Slow lengths & MA type, Signal (kept for completeness), Thrust MA length & type
• Display/Visibility: Paint bars only when Diff > 0; show zero line; “true Blue” color toggle; show/hide Diff columns and Average Diff
How to use:
1. Regime changes: Watch Diff% or Average Diff crossing 0. Above zero favors momentum/continuation setups; below zero suggests compression and potential breakout conditions.
2. State confirmation: During expansion (Diff > 0), prioritize Green/Red for aligned thrust; treat Yellow/Blue as cautionary/contrarian.
3. RSI on Diff: Use OB/OS and crossovers for timing entries/exits or for confirming/negating expansion strength.
Alerts:
• Diff crosses above/below 0
• Average Diff crosses above/below 0
• RSI(Diff) crosses above OB / below OS
• State changes: GREEN / RED / YELLOW / BLUE
Notes & limitations:
• VWAP is session-anchored and best on intraday data. If not applicable on the selected calculation TF, the script automatically falls back to EMA.
• Defaults (SMA(20) for BB/KC, multipliers 2.0, SMA(5) Average Diff, original trend coloring and bar painting) preserve the original appearance.
• RSI on Diff is plotted in the same pane for a compact workflow; you can hide it or split into a separate indicator if desired.
Release notes:
v6.0 — Upgraded to Pine v6. Added multi-MA options (SMA/EMA/WMA/RMA/HMA/VWMA/VWAP), calculation timeframe, RSI on Diff (Built-in or Manual RMA) with smoothing, safe division guard, optional zero line, and optional true Blue color. Defaults retain the original behavior.
License / disclaimer:
© waranyu.trkm — MIT License. Educational use only; not financial advice.

Reverse RSI Signals [AlgoAlpha]🟠 OVERVIEW
This script introduces the Reverse RSI Signals system, an original approach that inverts traditional RSI values back into price levels and then overlays them directly on the chart as dynamic bands. Instead of showing RSI in a subwindow, the script calculates the exact price thresholds that correspond to common RSI levels (30/70/50) and displays them as upper, lower, and midline bands. These are further enhanced with an adaptive Supertrend filter and divergence detection, allowing traders to see overbought/oversold zones translated into actionable price ranges and trend signals. The script combines concepts of RSI inversion, volatility envelopes, and divergence tracking to provide a context-driven tool for spotting reversals and regime shifts.
🟠 CONCEPTS
The script relies on inverting RSI math: by solving for the price that would yield a given RSI level, it generates real chart levels tied to oscillator conditions. These RSI-derived price bands act like support/resistance, adapting each bar as RSI changes. On top of this, a Supertrend built around the RSI midline introduces directional bias, switching regimes when the midline is breached. Regular bullish and bearish divergences are detected by comparing RSI pivots against price pivots, highlighting early reversal conditions. This layered approach means the indicator is not just RSI on price but a hybrid of oscillator translation, volatility-tracking midline envelopes, and divergence analysis.
🟠 FEATURES
Inverted RSI bands: upper (70), lower (30), and midline (50), smoothed with EMA for noise reduction.
Supertrend overlay on the RSI midline to confirm regime direction (bullish or bearish).
Gradient-filled zones between outer and inner RSI bands to visualize proximity and exhaustion.
Non-repainting bullish and bearish divergence markers plotted directly on chart highs/lows.
🟠 USAGE
Apply the indicator to any chart and use the plotted RSI price bands as adaptive support/resistance. The midline defines equilibrium, while upper and lower bands represent classic RSI thresholds translated into real price action. In bullish regimes (green candles), long trades are stronger when price approaches or bounces from the lower band; in bearish regimes (red candles), shorts are favored near the upper band. Divergence markers (▲ for bullish, ▼ for bearish) flag potential reversal points early. Traders can combine the band proximity, divergence alerts, and Supertrend context to time entries, exits, or to refine ongoing trend trades. Adjust smoothing and Supertrend ATR settings to match the volatility of the instrument being analyzed.
