RSI and Smoothed RSI Bull Div Strategy [BigBitsIO]This strategy focuses on finding a low RSI value, then targeting a low Smoothed RSI value while the price is below the low RSI in the lookback period to trigger a buy signal.
Features Take Profit, Stop Loss, and Plot Target inputs. As well as many inputs to manage how the RSI and Smoothed RSI are configured within the strategy.
Explanation of all the inputs
Take Profit %: % change in price from position entry where strategy takes profit
Stop Loss %: % change in price from position entry where strategy stops losses
RSI Lookback Period: # of candles used to calculate RSI
Buy Below Lowest Low In RSI Divergence Lookback Target %: % change in price from lowest RSI candle in divergence lookback if set
Source of Buy Below Target Price: Source of price (close, open, high, low, etc..) used to calculated buy below %
Smoothed RSI Lookback Period: # of candles used to calculate RSI
RSI Currently Below: Value the current RSI must be below to trigger a buy
RSI Divergence Lookback Period: # of candles used to lookback for lowest RSI in the divergence lookback period
RSI Lowest In Divergence Lookback Currently Below: Require the lowest RSI in the divergence lookback to be below this value
RSI Sell Above: If take profit or stop loss is not hit, the position will sell when RSI rises above this value
Minimum SRSI Downtrend Length: Require that the downtrend length of the SRSI be this value or higher to trigger a buy
Smoothed RSI Currently Below: Value the current SRSI must be below to trigger a buy
相對強弱指標(RSI)

BO - RSI - M5 BacktestingBO - RSI - M5 Backtesting -Rule of Strategy
A. Data
1. Chart M5 IDC
2. Symbol: EURJPY
B. Indicator
1. RSI
2. Length: 12 (adjustable)
3. Extreme Top: 75 (adjustable)
4. Extreme Bottom: 25 (adjustable)
C. Rule of Signal
1. Put Signal
* Rsi create a temporary peak over Extreme Top
row61: peak_rsi= rsi >rsi and rsi >rsi and rsi rsi_top
2. Call Signal
* Rsi create a temporary bottom under Extreme Bottom
row62: bott_rsi= rsi rsi and rsi

GMS: RSI & ROC StrategyThis is a basic strategy like the RSI one I posted. This one adds in the Rate of Change indicator as well.
You can separate the two for RSI only and ROC only. Everything else is the same as the RSI strategy.
- Simple moving average trend filter.
- Simple moving average trade exit.
- Both long and short or each on it's own.
The source code should be open if you want to see it or modify it for your own project. I hope it helps!
Andre
Global Market Signals

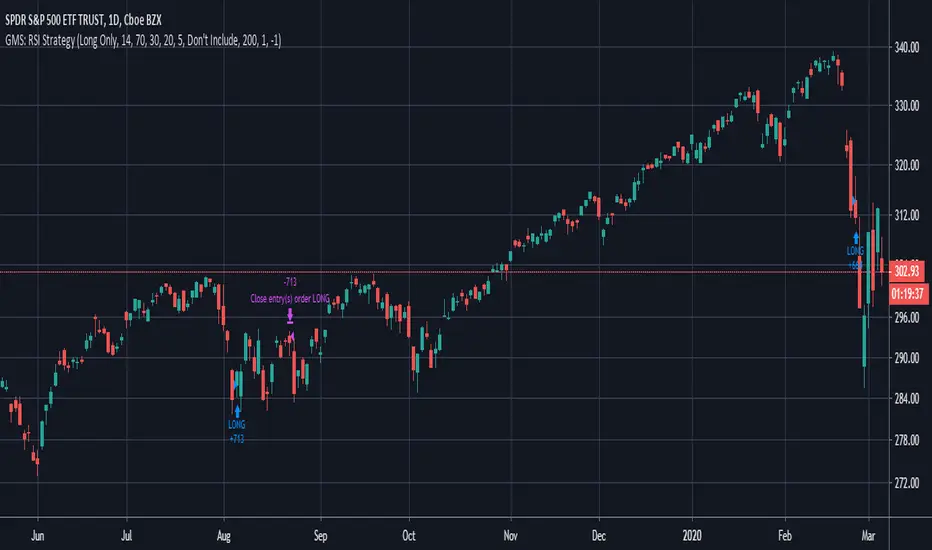
GMS: RSI StrategyThis is just a basic RSI strategy that it easy to use and quite comprehensive so you can quickly test out an idea based on RSI.
- I made it comprehensive in that you can select long, short, or both.
- There is a simple moving average trend filter. You can filter for trades above, below, or don't include it at all.
- The exit is based on a simple moving average.
The source code should be open if you want to see it or modify it for your own project. I hope it helps!
Andre
Global Market Signals
kurdistan MACD & RSI & EMA Hello friends
This indicator can help you to combine the three indicators together
EMA (20), MACD (12, 26, 20), RSI (14)
Apply ema20 to rsi as the signal line
Long arrival time
Price above EMA20, MACD above signal line and RSI above signal line
Short arrival time
Price below EMA20, MACD below signal line and RSI below signal line

2 Emas and RSI simple system (Malverti) - long onlyThis system originates from many articles by Enrico Malverti on 2015, 09 : "i-trading-systems-parte-5".
Many trading systems are more stable if you use simple and not so innovative indicators, like exponential moving averages and Relative Strengthe index.
Differently by the original article:
- there is no ATR Filter, but we have introduced a Schaff Indicator. If you have multiple shares/commodities to choose, prefer what has a better value of Schaff;
- there is no fixed stop loss but a second moving average (fast), used as target. There are also Emas on lows (trailing stop loss for long) and a Emas on highs (trailing stop loss for short position).
Be careful, in the system only long case, because being short is not the reverse of being long (also indicators have a different behaviour - sauciusfinance altervista: see article: why-going-short-is-immoral-and-dangerous)
Emas oh highs are only graphically put.
BUY when prices crosses over Ema on long period (we suggest, however, Ema long = Ema fast period = no. 14)
SELL when
- prices go under Ema on lows (7 period), or under on Ema fast!
- RSI crosses under level 70 or is higher than 75 (or 80, but in code there is 75)

Relative Strength Index - 200 EMA CrossoversThis version of RSI uses (RSI, 200) as the signal and color codes the background as well as the RSI/200 line. For the same results as my post use a Length of 5 on RSI, as well as the "area with breaks" as a representation of RSI.
MACD_RSI strategyUse three indicator to entry a position
EMA (20), MACD (12, 26, 20), RSI (14)
apply ema20 on rsi as signal line
Entry long when
price above EMA20, MACD above signal line and RSI above signal line
Entry short when
price below EMA20, MACD below signal line and RSI below signal line
Study only, use it under your own risk.

MA 12, MA 24, RSI OB-OS, CCI by WP@SITechDeveloped by Worachart Pirunruk, MD - Siam Intelligence Technology
This is the signal that generates based on 4 Technical Analysis Tools:
1. SMA 12,
2. SMA 26,
3. RSI 14,3,3
4. CCI
Signal to Buy/Long when the RSI below Dynamic oversold line based on close price back 60 bars.
Parameter. This signal doesn't have to best TP point, I'm working on improvement, now. Btw, don't forget to calculate you Margin Level. I'll teach you guys later of how to calculate.
Have fun Trading guys, and don't forget to give back to others. Because, Giving is Receiving."
WP@SITech

inwCoin Bullish/Bearish Divergence - Risk% StrategyEnglish
=========
inwCoin RSI Bullish/ Bearish Divergence Startegy.
RSI Bullish and Bearish divergence is a popular strategy that most people use to find the "reversal pattern" and bet on it.
...But is it really profitable in long run?
To find the answer, I write this strategy to test this hypothesis and the result is interesting.
------
How it work?
------
As you know, the main logic of bullish / bearish divergence are..
Buy Signal : RSI higher low in Oversold zone and price lower low
Sell Signal : RSI lower high in Overbought zone and price lower high
I also add some parameters to my strategy
1) Use stop loss + specific stop loss level
2) lookback period = RSI / Price lookback period to find divergence
----------
The result
----------
Not working at all.
It working ok in some period of time like in sideway market
But when uptrend established, it can't make any profit ( well, it's mean reversion strategy after all haha )
Also, when market keep crashing like in Nov 2018.
This strategy got stop out so many times before you can make 1 profitable trade....
But that trade won't last long because you have to take profit when you got bearish divergence signal.
----------
Conclusion
----------
Combine with trend following strategy.
This strategy might be able to fill the gap of sideway market.
But don't depend solely on this strategy because in long run, it can't beat the market.

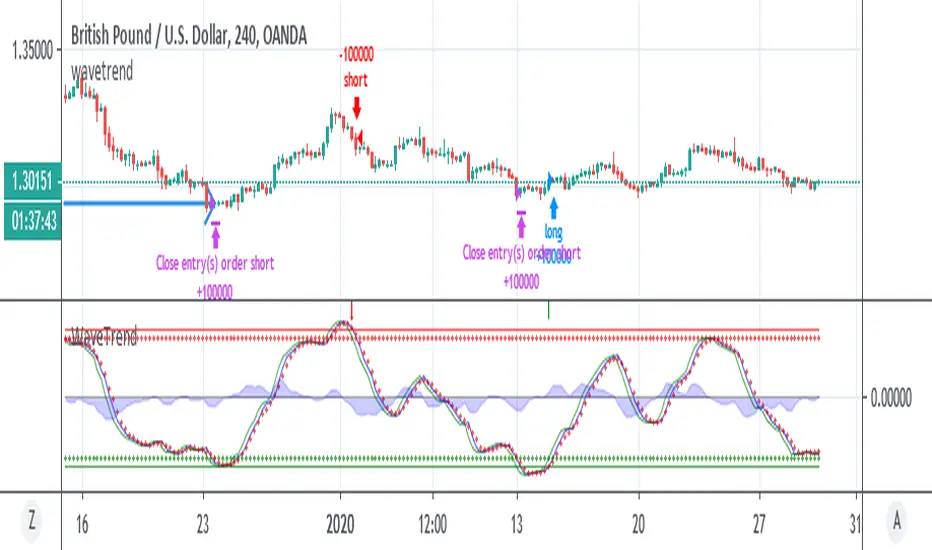
WaveTrend High Risk StrategyI am looking for critique on this strategy based on LazyBear's Wavetrend indicator. The drawdown is high but profits are pretty impressive.
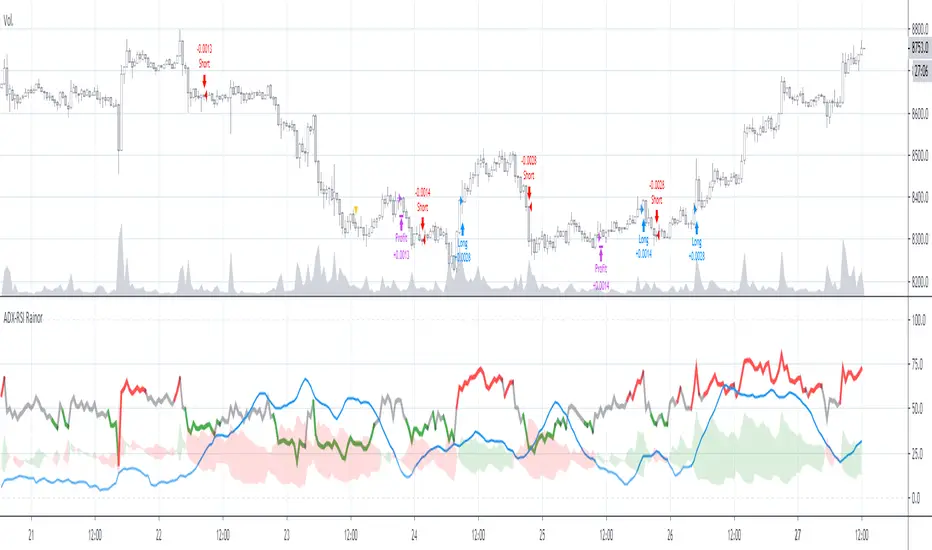
ADX-RSI RainorThis is a strategy based on the RSI and ADX indicators, used together to output an input and output signal from the trade.
Within the parameters we can identify the length and tolerance of each indicator separately, the length is due to the basic parameter in each of the indicators, on the other hand the tolerance is a threshold where it is determined when it is overbought / oversold in RSI and in ADX is the minimum value for the strategy to consider strength in the trend
the entry strategy is when it is above the thresholds in the 2 indicators and the exit with profit is when the force is less than the ADX threshold
As a note on the RSI threshold, it is considered as follows: oversold is from 0 to the threshold and overbought is from 100 to 100-threshold. Therefore if we take the default value (42) the neutral zone is from 42 to 58
I hope you liked it, if so you can support me with some observation or a like
AllinStrategy v5.0 ::: Allin® MarketEnergy™You need two indicators for it to work: AllinTension 5.0 and AllinStrategy 5.0 and use them in synergy.
They measure and gather information and then present them in an intuitive way for better opportunity spotting and a better and quicker decision making about buy or sell entries in certain markets.
In works with crypto, stock, fiat and futures market.
I will explain how it works o a page but as a thumb rule: the more GREEN you see turning up like an energy the more LONG situation is and the more RED you see turning up like en energy the more SHORT the situation is.
The best thing about a product of mine is that it can be backtested. Results of backtesting yields up to 85% of accuracy and risk-reward ratio up to 5X or more.
Indicator - AllinTension 5.0
This indicator will enable you to actually feel the market on several levels. Exploiting informations from different timeframes and different oscillators with different setting and average them out.
With this indicator you will either confirm the sensed direction or you will skip the opportunity because signals are not properly aligned. To be able to resist FOMO is really crucial here. Opportunities are in abundance. There will be more. A lot more. Really.
How to read it and properly use it?
For more in depth understanding on how it works and proper usage of it. There is lot of information on the page.
Strategy: AllinStrategy 5.0
This strategy indicator is used as a backtesting platform for different types of various settings for a selected pair.
Backtesting means you can test each TimeFrame (best 1-9min) with various AllinTension indicator settings. You will get a result for profitability in the last period (but it is not that important anything but for maybe feeling bad you missed it), success rate in percent (anything above 70% is good enough) and you have to watch the ratio of the max dropdown and average trade size (least acceptable is -5x, better is 2x or less).
So you will learn which strategy (TF and indicator setting) has steadily preformed best while being profitable in the past and assume it will do that in the same manner with same accuracy in the future. It sometimes changes so you need to preform rutine testing after some bigger market movements.
With this you will find the best preforming TImeFrame for each window. You will adjust settings for each window differently to diversify view on the market. My personal best setting are for the first window 4-16-64, second window 3-9-27, third window 2-8-32 and forth last window 5-20-80.
So ALLinStrategy is a visual representation of the market and the most important thing, it includes a feature "Strategy Tester" to backtest chosen strategy. The results may surprise you and they can all be proven!:) So what do you do in this case? :):)
But to really understand the market and given signals from this Strategy, you will need indicator ALLinTension or you are going blindfolded guess trading.
How to read it and properly use it?
For more in depth understanding on how it works and proper usage of it There is lot of information on the page.
For strategy to work you first have to find profitable and accurate enough TF (more than 70% should do the trick)and indicator settings (there are some favourites) and apply it to your executing strategy.

RSI+MA_Scalping_StrategyOANDA:USDJPY
This strategy is based on Larry Connors' 2-period RSI strategy. I applied this for scalping(5Minutes) in the forex market based on his strategy.
Best use for YEN Crosses (High liquidity) trading such as USD/JPY and EUR/JPY.
Notes:
1. This strategy doesn't work well if volatility is low.
2. Don't go against Long-term trends. This strategy has practically no stop loss during rapid trends, so if going against trends can be devastating.(Especially GBP/JPY)
3. Don't martingale trading with this strategy. Based on my research, At first glance, it seems to work, but lose in the long run.


Multi RIS Length RSI Strategy calibrated to 20min timeframeI have been working on many itterations of this script, on multiple time frames, with multiple settings.
It's not exactly how I want it, but if used on the 20 min timeframe (I chose this one to publish, not because it's the most profitable, or percent profitable , but for multiple other reasons.
1) From my back testing, this seems to be the most stable (gives the greatest margin for error). By that I mean, I am not a bot, I am a human trader, so I actually have to sleep, and work, and can't always trade all the time when I when I get my signals. So I need some margin of error.
The 20min time frame gives me this, it's still decently profitable (52K), and allows me some margin of error for being human.
2) It not exactly how I want it, because you have to use it in conjunction with the strategy tester to see if it is in longs or shorts (open trades). You can't see that on the app, or even if you are logged in to TV on a browser on a smart phone. At least I cant, I can only see the strategy tester when I am logged in on my computer, which obviously I can not be all the time.
3) It's also not exactly how I want it because it doesn't tell you when it is switching from buying additional longs (or shorts), and closing them out, and reversing. You can figure this out from the strategy tester, but I would like my script to make it more clear in real time.
4) The alerts on the script only fire after the current bar is closed. So really to use this you need to be a non free member or TV, because then you can add the appropriate RSIs to your chart, and set up real time alerts on them that will fire in real time, as opposed to displaying on the chart after the bar closes (a lot can happen in 20 minutes). Which is sad, and not my intent, I want this to be useful to free members, I just don't know how to do that given they don't have custom time frames (like 20 min), and multiple real time alerts. I can't fix that, that's a limitation of TV.

FearsAndHopesA strategy based on the assumption that if you buy in a panic and sell on the euphoria of the crowd, then in the long run you get a profit. The strategy is symmetrical, that is, we assume that FOMO and FUD have an equal impact on the crowd. Never make different paired parameters. Do not try to get a perfect result on the backtest. The setup is symmetrical, the program does not use EMA, requests to larger timeframes, and other things that can cause repaintings. However, if you use the value 1 in the Fast Sma Length field, repaintings is possible, use with caution. This algorithm makes me profit 2600% profit per year, which, of course, does not mean that the next year will bring the same. API history on Bitmex on request in PM. Use it as an indicator with pleasure. Access to the script and help in setting up costs 0.5 btc

Simple EMA_Hull_RSI StrategyAnother simple strategy. Crossing EMA & Hull MA and the level of RSI (overbought/oversold) defines long or short.
Can be improved by varying the parameters and adding take profit / stop loss.
Backtest: ETHUSD (Bitmex): 5m

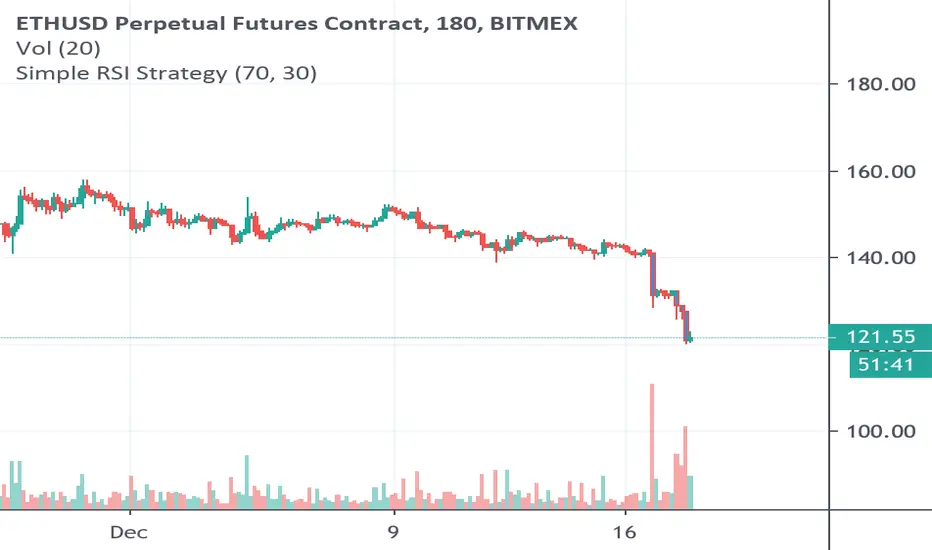
Simple RSI Strategy Buy/Sell at a certain levelSimple Strategy based on RSI, using overbought or oversold levels, defined by us, sell or buy an asset.
Backtest: ETHUSD (Bitmex) - 3h
Ichimoku Kinko Hyo Cloud - no offset - no repaint - strategyIchimoku Kinko Hyo Cloud - no offset - no repaint - RSI filter - strategy
The indicator contains both the standard Ichimoku Cloud , as well as the one without the visual offset.
The Strategy Tester indicates good backtest results when the Ichimoku Cloud is paired with the RSI .
However, it seems it likes to work more as a standalone system.
The indicator can be easily converted to the study() mode by commenting/uncommenting a few lines,
then the alarms can be configured.
There are entry and exit signals ready to be used by the alert system.
The coloring of the cloud without offset contains all 3 conditions: Uptrend , Downtrend , Transition .

[STRATEGY] Jurik RSXA private strategy from the Profitable Jurik RSX preview for backtesting purposes.

DELTA7 StrategyStrategy Tester Script for DELTA7. It includes all strategies in main scripts.
However, be aware that DELTA7's main purpose was designed to be an analysis tool system and not a signal bot.
DELTA7 System is a full-featured system with advanced chart-overlay and one augmented RSI oscillator that doesn't require any further indicators.
It's a complete solution focused on being simple and minimal for a traders/investors that want to make decisions based on momentum, trend, price and market structure.
Main scripts are found at
These indicators have been published for private-use and paid customers. Access cannot be granted to anyone else.
Thanks.
