相對強弱指標(RSI)

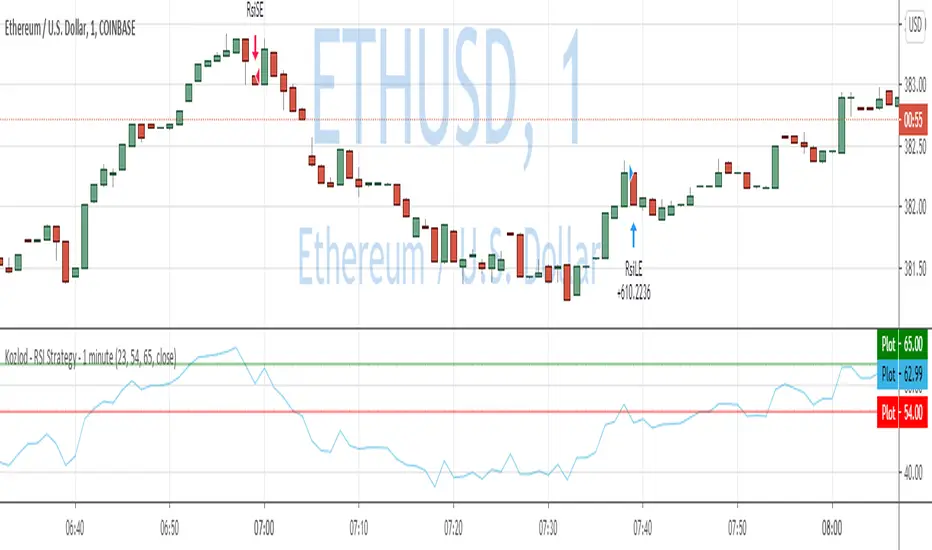
Kozlod - RSI Strategy - 1 minute - ETHUSDTrying to find simple strategies with optimal parameters which work well for certain symbols/timeframe.
Found that basic RSI strategy without any position management works pretty good for 1m chart for BTCUSDT.
It might not work very good on it's not but can give you a pretty good base for more complicated indicators.
Also, some position management as simple as static SL and PT can improve performance quite a lot.
And remember:
Past performance does not guarantee future results.
Kozlod - RSI Strategy - 1 minuteStarted to play with very simple strategies. Trying to find ones with optimal parameters which work well for certain symbols/timeframe.
Found that basic RSI strategy without any position management with high RSI length (65 in this script) works pretty good for 1m chart for few stocks.
It's also not bad for AAPL , SPY .
It might not work very good on it's not but can give you a pretty good base for more complicated indicators.
And remember:
Past performance does not guarantee future results.

STOP-LOSS-RSI with Edge-Preserving Filter Strategy V2Modified RSI strategy with entry and exit points.
I have allowed for High and Low risk for anyone interested in using it (NO GUARANTEES. DO YOUR OWN RESEARCH).
I will later consider incorporating the standard RSI for exit points. I am sure returns will increase based on current test runs :)
Returns look good based on the strategy result.

Simple Relative Strength IndexCreated this script to simply let us predict buy and sell for RSI 15 and 85 (configurable).
It is best use for ETH and monthly chart.
Good for people who can not stay for daily trade and only able to trade few times a month.
The earning is quite lucrative while ETH is on up trend. However, this will not work when ETH on side way.
This only work when ETH is excited!!!
Happy sharing..
Credit to anonymous-es that i used their codes.

BB + RSI testThis is a back-test tool for the BB + RSI indikator
- Set your gain percentage and the rest of your parameters and see how does it work on a chart.
- The pyramid buying is on by default you can turn it off in indicator settings/properties

TradersVenue RSI+OHL StrategyTradersVenue RSI+OHL strategy generates buy/sell signals basis the open=high, open=low, RSI crossover above 60 and RSI crossunder 60 logic. Back testing results are good. However since it uses HeikinAshi charts exact profit will vary. But basis my trading experience its highly profitable and can be used for intraday and positional trading. This will benefit option writers to maximum as the results are quite consistent.
TradersVenue RSI+OHL StrategyThis is one fantastic trading strategy which works on RSI and OHL metrices. Go long when RSI crosses above 60 and go short when RSI crosses below 60. Apart from that in 15 mins candle if open = high in Heikin-Ashi charts then go short and if open = low then go long.

Carlos_Setup: IFR&BB 5 MinIndicador com entrada para compra e venda no DOL e WDO. Tempo gráfico de 5 minutos e alvo de 4 pontos.

Carlos_Setup_DOL_Compra_5minO script foi realizado para ser utilizado apenas para os papéis DOL e WDO (não fiz testes com outros ativos, embora talvez possa ser aproveitado em mais algum). Ele utiliza as Bandas de Bolinger e o IFR para realizar as entradas. As indicações são apenas para COMPRA e o alvo inicial a ser buscado é de 5 pontos. O tempo gráfico que apresentou o melhor resultado para as configuração padrão foi o de 5 minutos.

RSI_Strategy_TradersVenueGo long if RSI crosses over 30 or 60. Go Short when RSI falls below 60. Back testing gives good amount of success and can be used in 3/5/15/30/60 minutes time frame with HeikinAshi charts. Don't use normal candles to reduce noise.


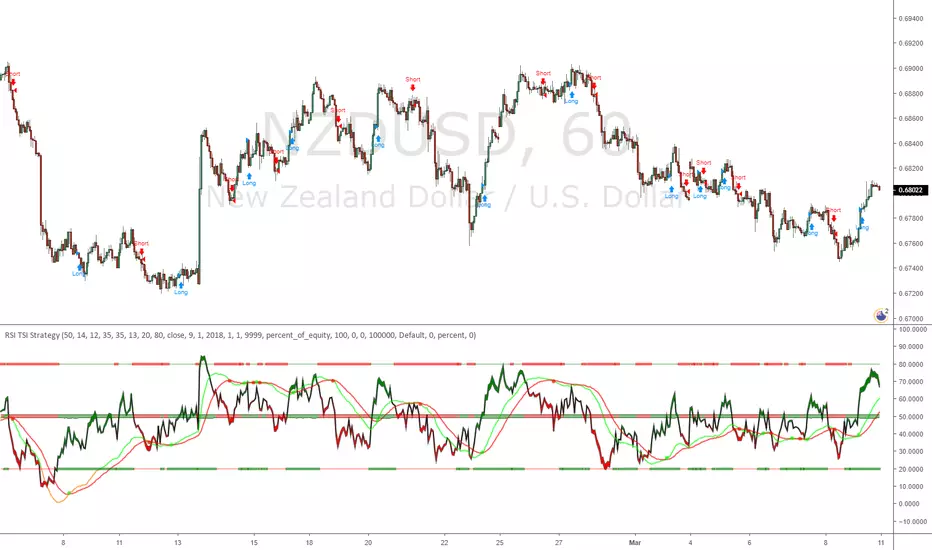
RSI TSI StrategyRSI & TSI combination, with Hull MA for a center Line.
Order entry with either RSI TSI or Hull MA
Experimental strategy for possible use as bot
Flow Trend Indicator StrategyImplemented the trend indication part of the CHOP_LRSI indicator as a strategy.

Tangram Bot 2 - SmartbotPrimeira Versão do Script Tangram Bot 2 da Smartbot para tradingview.
A intenção é agilizar e fazer um teste prévio e rápido do setup.
O resultado indicado aqui jamais corresponderá a um resultado real. É apenas uma ferramenta de estudo.
Ainda falta fazer e melhorar a parte de gestão de risco.
Caso queria fazer alguma sugestão ao cógido para melhorar a gestão de risco ou caso tenha encontrado algum erro, favor comunicar.
O tangram bot 2 combina o uso de até dez Indicadores de Análise Técnica com Gerenciamento de Risco (stop gain, stop loss, stop móvel, realização parcial, bloqueio de reversões, lucro máximo por dia e prejuízo máximo por dia) e Filtros Diversos (sentido das operações, uso do after-market, bloqueio de nova entrada após saída, hora inicial e hora final para negociação). São utilizados os indicadores Médias Móveis, HiLo Activator, MACD, ADX, Estocástico, VWAP, IFR, Bandas de Bollinger, Stop ATR e SAR Parabólico

RSI-ATR Divine Strategy (Backtesting)Live, non-repainting strategy using ATR and RSI mixed together to multiple types of long and short positions.
- Features -
Live entry direction with trade warnings and alerts
Live trade building buy and sell stops (for buy/sell stop limits)
Entry location icons as well as pyramid entries (to add to existing position)
2 separate targets based on the ATR setting and entry location
1 scalp target based on the ATR setting and entry location
2 separate trailing stops, 1 for "absolute stop" and 1 for "scalp trades"
Alert conditions for every update and condition change of the strategy (Provided by indicator study )
4 pre-built color themes, including candlestick coloring
This strategy is best used with my RSI Shaded Indicator using the identical RSI settings.
The linked script is identical and used solely for alerts, because Trading View still after 3 years of requesting does not provide the ability to use alert conditions inside a strategy script, only an indicator script. This strategy should be used to backtest your settings.
The approach to this strategy uses several parallel trades of different types. In order to generate multiple trade types the "pyramid trades" setting of the strategy (second tab of the settings that lets you adjust the number of pyramid contracts) should be used.
- Trade Types -
Swing: This trade is entered on the solid arrows after the RSI has become oversold or overbought. It is key that all trades wait for some degree of pullback before entering, even after the trend flips between positive and negative. This trade is held until stopped out or an opposite trade is triggered that reverses the position.
Target: These trades are entered at both the initial swing trade, or any subsequent pyramid/greedy trades that present themselves along the way while the trend remains in the same direction. The difference between these trades and the swing trade is that they have targets calculated as: Target = +/- * ATR. Until the target price is reached it does not change. When exceeded the next target trade will have a new target price.
Scalp: These trades have a limit buy/sell entry and a target. The target is very similar to the ATR Multiplier calculation for Target trades, but uses the instead.
Turning on/off the different trade types (strategy only) is simple done by decreasing the number of contracts used for that trade type to zero. When the quantity is set to zero, that trade is not considered.
- Session -
The session filter is used to narrow trade executions by only allowing trades that are inside the session boundaries. This can be used to isolate the London or New York session for example. The default is 24 x 7 which filters no trades (Trading View has a bug when resetting this, so simply reset the indicator to get it back to 24x7).
All feature requests or bug reports are welcome either by direct messaging or comments on this page or the linked indicator page.
Please PM for access. Cheers.

Simple Buy and Sell SignalsUpdated from version 10.4 to version 12
Feel free to use this. I made this for my own strategy and to make my life easier spotting entries. I'm still currently learning pine script so it's not perfect. Currently the exits are based on trend reversal (not recommended) so I suggest you pick your own exits and bank those pips.
Criteria; (Tested on these Settings)
NZDJPY
5 Min Timeframe

IFTSTOCH + RSI 1.0IFTSTOCH Strategy with 50% exits and full stops.
This strategy was developed for a backtest-rookies services customer. I has been published only for testing and acceptance. Access cannot be granted to anyone else sorry!
Other open source scripts are available on the Backtest Rookies profile.

Cryptocurrency trend following EMA Ribbon LONG only strategyThis strategy is based on EMA Ribbon and uses multiple indicators to find optimal time to enter/exit the trade and filter out false signals. The script with default setting is developed mainly for trading altcoins/stable coin pair such as ADA/USDT etc on 4h timeframe but it can be applied to any pair/any timeframe with some settings adjustments.
For plot on chart features make sure that you have both study and strategy scripts on chart with same settings.
Strategy settings description:
1. Signal EMA Length - Value for exponencial moving average (slowest from EMA Ribbon)
1a. Buy price toleration (%) - Price deviation for filtering bounces of EMA - price must close defined percents above EMA to open long trade
1b. Sell price toleration (%) - Price deviation for filtering bounces of EMA - price must close defined percents bellow EMA to close long trade
1c. EMA deelay - EMA id delayed by defined bars for smoothening
2. Filter by Fast EMA - Strategy filters signals to prevent buy while coin is dropping
2a. Fast EMA Length - Value for fast exponencial moving average
3. Filter by SMA - Strategy filters signals to confirm trend change
3a. SMA Length - Value for simple moving average
4. Filter by RSI - Strategy filters signals to prevent buing/selling overbought/oversold coins
4a. RSI Length - Length of RSI identificator
4b. RSI Source candle - What price of candle is used for RSI calculation (open, close, high, low)
4c. RSI Long condition - When buy, RSI indicator must be below this value to prevent of buying already overbought coin
4d. RSI Short condition - When sell, RSI indicator must be above this value to prevent of selling already oversold coin
5. RSI Close Trade Condition - Strategy sell coin once RSI reach defined value
5a. RSI close trade condition - Sell once RSI indicator acquires defined value
6. Close trade by Take Profit or Stop Loss Condition (STRATEGY ONLY) - Strategy sell coin once defined take profit / stoploss level is reached
6a. Take Profit (%) - Take profit value in percent
6b. Stop Loss (%) - Stop loss value in percent
6c. Plot targets on chart - defined targets will be plotted as lines on chart
7. Date range from
7a From Year - To run strategy in interval
7b From Month - To run strategy in interval
7c From Day - To run strategy in interval
8. Date range to
8a To Year - To run strategy in interval
8b To Month - To run strategy in interval
8c To Day - To run strategy in interval
9. Wait to confirm the signal
9a Wait candless to buy - strategy will wait defined candless to confirm the signal before buy
9b Wait candless to sell - strategy will wait defined candless to confirm the signal before sell
10. Plotting on chart (STUDY ONLY)
10a Plot signal line channel with bows on chart
10b Plot simple moving average on chart
10c Plot EMA Ribbon on chart
10d Plot recent support and resistance levels on chart
11. Show Every signal (STUDY ONLY) - Unchecked shows only first signal based on strategy. But if you use take profit/stoploss settings within your bot, you might want to rebuy on next signal. Checked shows signal on each candle.
Throw on chart also buld-in RSI indicator and set the same as strategy
Notice that there might be false signals, especially when the coin is not trending or is strongly manipulated. Overall strategy is profitable though. You just take some minor loses and wont miss the big move.
You may also consider to compare buy&hold return vs profit from trading this strategy. In downtrend as we have seen recently, profit may not be as high as you expect but it is still much better than just hold and hope.
You can use the strategy script for fine tunning settings and find best settings for yourself.
Study script helps you to automate trading with use of alerts perharps with 3commas bot or even trade manually based on email/sms notification setted by tradingview
Notice that study script does not handle takeprofit/stoploss order. That is why sell arrows could be plotted by study script later than strategy script. To rebuy after takeprofit/stop-loss use "11. Show Every signal (STUDY ONLY)" setting
Make sure that you keep same settings for strategy and study scripts.
If you need any help with settings do not hesitate to ask. I would also appriciate any feedback and ideas how to improve this script.
Here is backtest result from 1. Nov 2018 using constant 100USD Buy ammount:


SARSI Reversal StrategySimple reversal strategy based on 'Parabolic Stop and Reverse' and 'Relative Stength Index' indicators.
