Powerfull strategy MACD + RSI + Stoch buy on High exit on ATRMy strategy uses a combination of three indicators MACD Stochastic RSI .
The Idea is to buy when ( MACD > Signal and RSI > 50 and Stochastic > 50) occures at the same time the BUY STop we place on previous day HIGH
We exit on Take profit or Stop loss which is calculated by ATR (10) or on the opposite signal "Volatility breakout"
This strategy works well on stocks, commodities and cryptos especially during market breaking up after consolidation
The best results are on Daily charts , so its NOT a scalping strategy. But it can work also on 1H charts.
The strategy does not have any stops and profit targets, so we can take all the market can give us at the moment.
The exit point only when MACD goes under Signal
Its Preformance is significantly better with "buy stop on High.1" idea and exit on "volatility price breakout"
So, use it, trade it.
If it will help you to imprive your trading results, please donate me
BTC: 12kd1F8buWisUBdq27BBwRkUvzW7Ey3og5
相對強弱指標(RSI)

Erkam 2//I do not share this strategy.
Please don't send message me for this strategy.
Thank you.
Do not repaint.

RSI + BB Scalping StrategyThis strategy uses the RSI indicator and the Bollinger Bands to identify trade entries while using the ATR to determine stop-losses. The strategy only triggers when both the RSI and Bollinger Band indicators are both either overbought or oversold.
This indicator is free to use. Trade at your own risk.

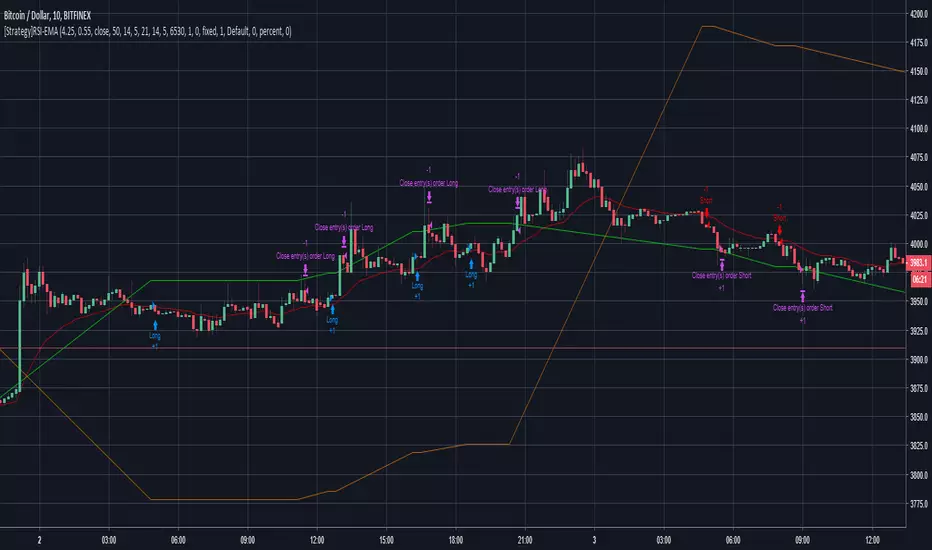
RSI EMA Strategy 15M+// Strategy based on Relative Strength Index (RSI) and Exponential Moving Average (EMA)
// Greatest effect on 15M+ time frame
// Created and based on Binance chart
// Working with comission
// No repaints

RSI Trade Emulting for ProfitYou can get your profit with easy RSI indicator and can also add stop loss rate.

Multiple MACD RSI simple strategySimple strategy script I've had for a while but looks like I never published.
Although it is one of my most simple it seems to have the best profitability. It is pretty rough though. the Stoch RSI has only a little weight to the trade trigger. I'll refine it more over time or you can by all means. Basically the Stoch RSI current K line has to be OVER 40 to trigger a SELL. It has no effect on buy side.
The triggers are roughly as follows:
Year - since so many assets have gone 2x, 3x, 10x+ since 2013 having a strategy that earns a 500% return from 2013 to now isn't that good if buy-and-holding would have got you 800%. This eliminates some of that noise and makes it a little easier to quickly gauge success. So buy/sell trigger need a value of greater or equal to 2018 (default)
MACD 1 - First MACD (short) needs to indicate greater than 0 to buy or less than 0 to sell.
MACD 2 - Same as MACD1 but for second MACD set (long)
Uptrend - Latest close + high divided by last periods close + high needs to be grater than 1. So if latest is 34.30 close and 34.60 high and previous interval is 34.80 close and 34.82 high, that is 0.99 and will not trigger a buy trade.
Downtrend - Same thing but close + low and less than 1.
This script/strategy is pretty rough but if there is interest I'll polish it more since it is a pretty solid but simple strategy for most assets.

Gold trading strategy with trend follow and TDOW conceptMy strategy uses a combination of three indicators MACD Stochastic RSI.
The Idea is to buy when ( MACD > Signal and RSI > 50 and Stochastic > 50) occures at the same time
This strategy works well on stocks and cryptos especially during market breaking up after consolidation
The best results are on Daily charts , so its NOT a scalping strategy. But it can work also on 1H charts.
The strategy does not have any stops and profit targets, so we can take all the market can give us at the moment.
The exit point only when MACD goes under Signal
In addition I've decided to add a stop loss and "Trading day of week" concept
So the results are much more stable and we get more profit !
So, use it, trade it.
If it will help you to imprive your trading results, please donate me
BTC: 12kd1F8buWisUBdq27BBwRkUvzW7Ey3og5

MACD + Stochastic + RSI StrategyMy strategy uses a combination of three indicators MACD Stochastic RSI.
The Idea is to buy when (MACD > Signal and RSI > 50 and Stochastic > 50) occures at the same time
This strategy works well on stocks and cryptos especially during market breaking up after consolidation
The best results are on Daily charts, so its NOT a scalping strategy. But it can work also on 1H charts.
The strategy does not have any stops and profit targets, so we can take all the market can give us at the moment.
The exit point only when MACD goes under Signal
Its Preformance is quite stable.
So, use it, trade it.
If it will help you to imprive your trading results, please donate me
BTC: 12kd1F8buWisUBdq27BBwRkUvzW7Ey3og5

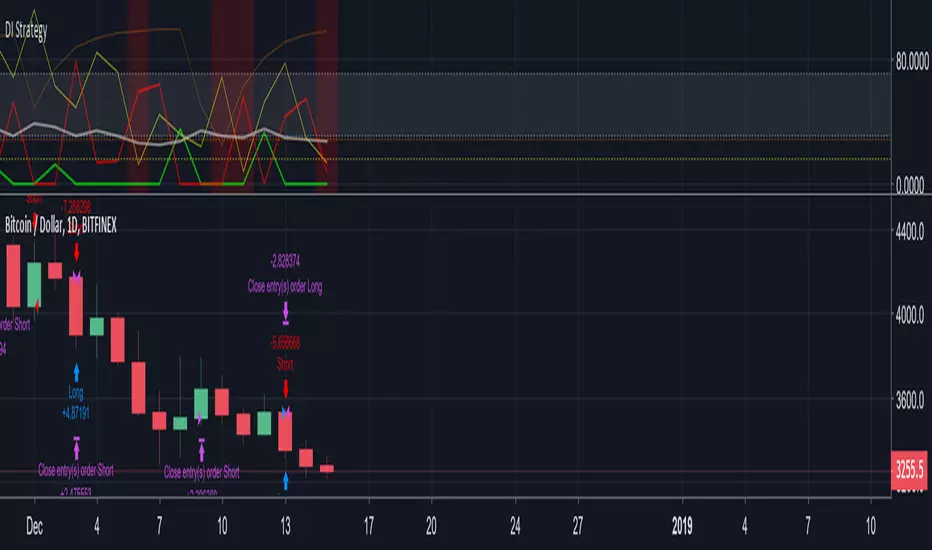
Directional Indicator Strategy v1.2ADX Trading Strategy , using
ADX, D+ and D-
RSI
Historical Volatility
Hull Moving Averange for the price trend
Stop-loss
The Strategy Report is based on 10.000 USD initial investment without pyramiding, starting on januari the 1st 2018, on a 1D time frame. Taking in account a 0.2% Commission fee per trade.

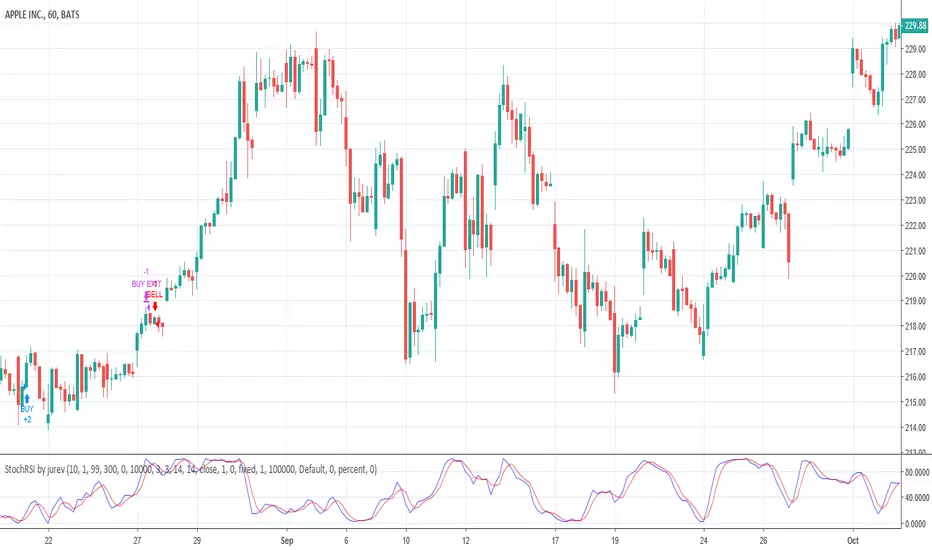
StochRSI Strategy by jurevSimple strategy on Stochastic RSI, opens buy when K is undersold, and buys when K is overbought. You can experiment with SL and TP points to optimize profit.
Directional Indicator - Trading Strategy v1.1Trading strategy using:
ADX: D+ and D-
RSI
Historical Volatility
Stop-loss
This Strategy works best on a 12h or 1D time frame, for pairs like BTC-USD or XRP-USD
CS Basic Scripts - Stochastic Special (Strategy)This Stochastic Special Strategy features inputs for:
- Custom Backtesting Date Range
- Long and Short Strategy Discinctions
- Utilize SMI, RSI, Martingale, and Body-Filter Strategy
- Adjust the SMI Percent Lengths and Limit
- Automate with the Autoview Trading Bot
Strategy script may be tested by favoriting and adding to any chart.
Study script is available for automated trading at www.cryptoscores.org

TH_Delta Strategy (Multi-Options TH Strategy Tester)
Strategy Tester is based on TH_RSI Delta, TH_RSIMACD, and a combo of Hull Moving Averages. You will also able to activate include Ichimoku Cloud or a Simple Moving Average.
It also applies colored bars and signals based on overbought/oversold states and RSI crossings.
The tester/signals is disabled by default. You need to activate it in options and then tune the initial capital, % equity options and fees for testing different approaches.
To switch between different tests you just change the number of strategy type and results on screen will be updated accordingly.
You can also define the period of time you need the test to perform on. Default start is Jan 2017 to Jan 2021. Change this as fit.
Remember that the market change pace and volatility. Some timeframes will show you better results with different strat approaches. The same for different kinds of markets/securities.

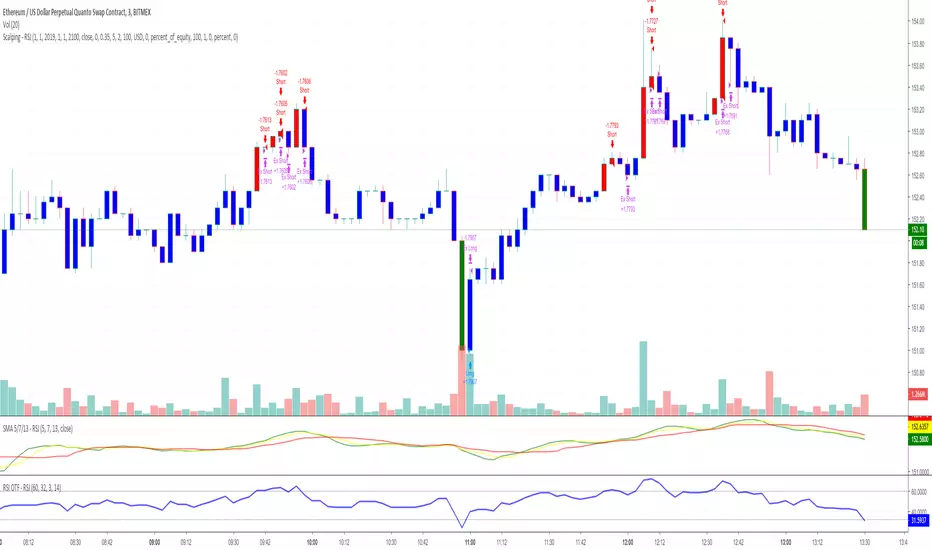
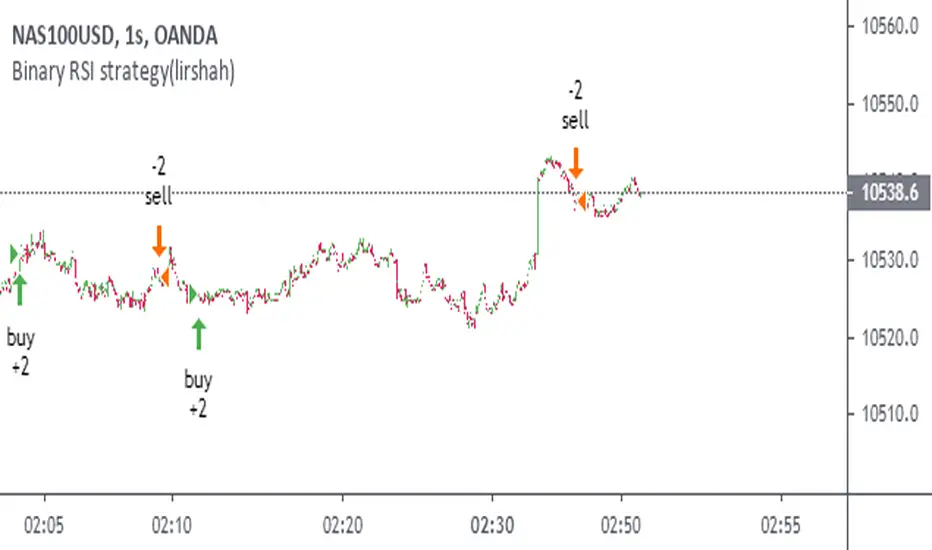
Binary RSI strategy(lirshah)Binary Rsi is one of the greatest strategies published by lirshah programming team.
it has a good operation on H2 ,H1, and M15 charts.
its better to say that this strategy can act such a money machine and
has a good result on almost all crypto currency pair:
LTCUSD – ETHUSD –BTCUSD- XBTUSD - ZECUSD –ETHBTC and …

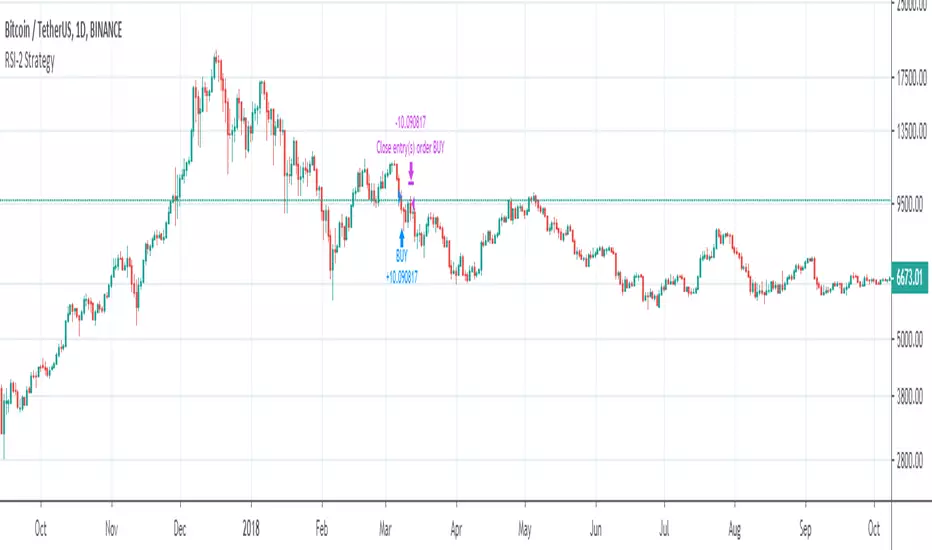
RSI2 ScaplingRule
1. Price is above its 200-period moving average
2. The 2-period RSI of price closes below 5
3. Buy price on the close
4. Exit when price closes above its 5-period moving average
Connor's R3 StrategyCreated based on Connor's R3 Strategy. However, the signal always appears on the next candle, where it should appear at the closing price of the same candle.

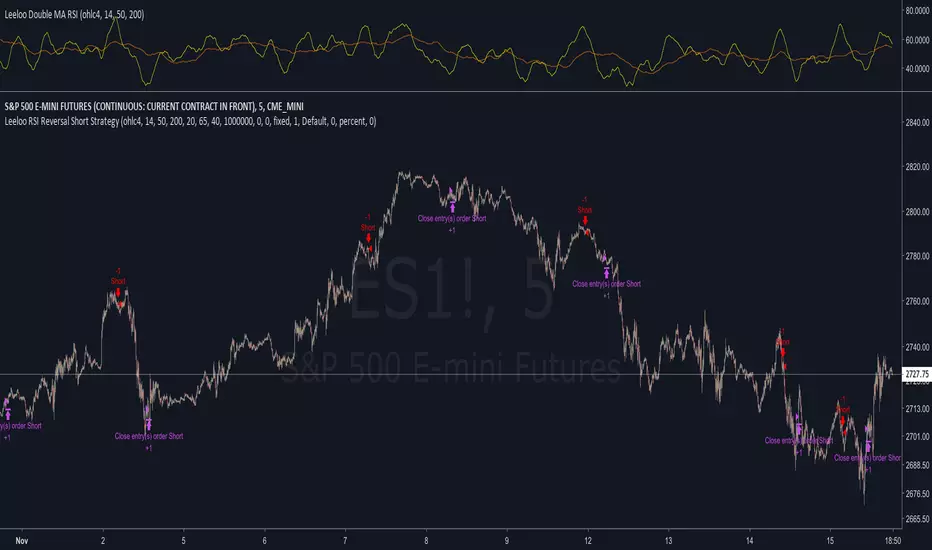
Leeloo RSI Reversal Short StrategyThis strategy is based on applying two moving averages to RSI and then opening a short position when the short-length average is above the slow-length average, has recently changed direction within the last n bars, and is in overbought territory.
Default settings work best on short intervals (5min)
Don't be afraid to use extended hours
Everything is based on last complete bar; once something shows up it is good to go
CDC RSI Divergence Strategy for Bitcoin ( by inwCoin )This strategy is based on CDC RSI Divergence indicator ( www.chaloke.com )
Also some code from CTC R-Breaker strategy ( ctc.in.th )
For best result, using 1 H timeframe.
I tried backtest at Bitmex ( XBTUSD ) Bitfinex ( BTCUSD ), OKex ( BTCUSD3M ) and it result is ok.

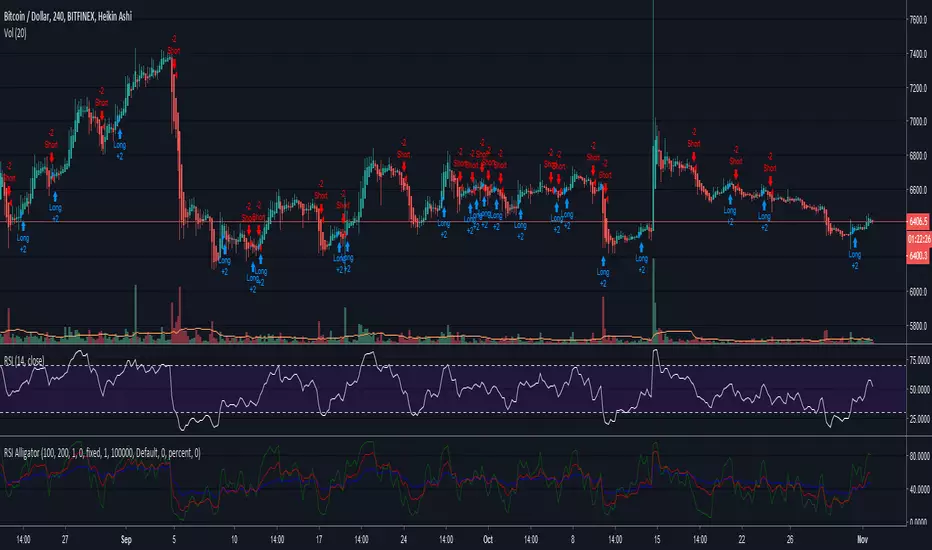
RSI Alligator StrategyHello trading family! Just wanted to give a quick write up and share the new code for the RSI Alligator Strategy. I amended it to show every crossover signal, weak and strong, so we can accurately gauge its effectiveness.
Having played with this for a couple hours now I have learned a few things
-Using Heikin Ashi seems to smooth it out a bit and provides about 20% fewer signals, leading to overall more accuracy. However, it can be misleading as the Heikin Ashi opening price doesn't always line up with the market price, especially in cases of large moves. Overall though it didn't seem too far off except for a few instances.
-Also, using the Heikin Ashi gives you a better idea of the trend, which this indicator is primarily used to detect and exploit.
-Having tested on TF of 1H-1D, overall profitability is found to be highest between 4H-12H, with 1D giving the "safest" longer term signals, and lower TF's generating many more signals due to volatility.
-Instead of waiting for the next signal in order to close, you can often use a crossover/crossunder of the 5 and 13 to close the previous trade, especially if paired with a Heikin Ashi of opposite color (green to close a short, red to close a long)
-You will also notice several instances where the Green 5 period show divergences that aren't visible on the regular RSI, another handy little feature
So far I have still only tested this on BTCUSD. Feel free to apply it to any coin and let me know what you find.
Here is the script. If you have any ideas or suggestions please let me know!