Liquidity ZonesWhat It Does:
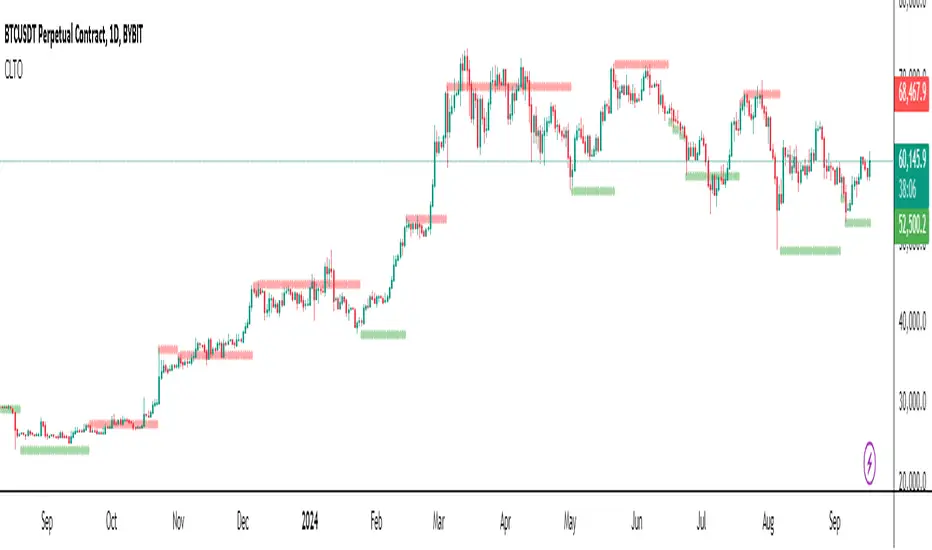
Liquidity Zones identifies key areas where institutional traders target stop orders. The indicator automatically detects significant price swings and maps the upper and lower wick zones where liquidity pools form. These zones represent high-probability areas where price is likely to return to collect stop orders before continuing its next move.
How To Use:
Identify Key Zones:
-Red zones highlight Buy Side Liquidity (resistance areas)
-Green zones highlight Sell Side Liquidity (support areas)
Trading Opportunities:
-Enter trades when price respects these zones
-Watch for zone breaks and re-tests for continuation signals
-Use alerts to notify you when price enters a zone or when new zones form
Optimization Tips:
-Adjust lookback periods based on volatility (higher for calmer markets)
-Enable auto-threshold for adaptive sensitivity to market conditions (default setting)
-Most effective on timeframes 4H and above
The indicator tracks when zones are broken and automatically removes them when price returns, providing a clean, uncluttered view of the most relevant liquidity areas on your chart.
Resistanceandsupport

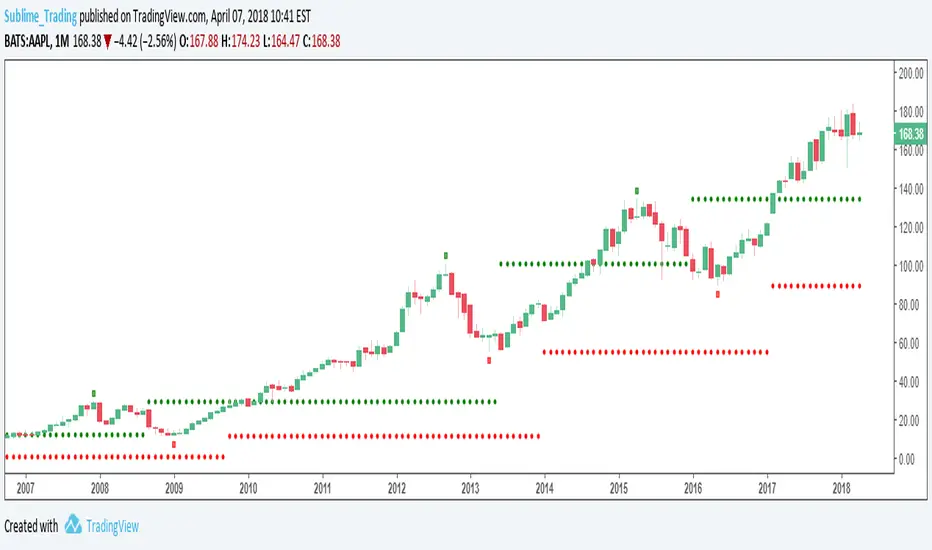
Chronos Trend Level Oracle (CTLO)The Chronos Trend Level Oracle (CTLO) is a powerful technical analysis tool designed to identify significant trend levels that can act as support and resistance, helping traders navigate market trends and potential reversal points.
Key Components:
Setup Identification:
Bullish Setup: 9 consecutive closes lower than the close 4 bars earlier.
Bearish Setup: 9 consecutive closes higher than the close 4 bars earlier.
CTLO Support Level:
Established when a Bullish Setup completes.
Represents the lowest low of the CTLO Period (default 9 bars) preceding the Setup completion.
CTLO Resistance Level:
Established when a Bearish Setup completes.
Represents the highest high of the CTLO Period (default 9 bars) preceding the Setup completion.
Level Persistence:
A CTLO level remains active until an opposite Setup completes.
When a new Setup completes, it clears the opposite level.
Visual Representation:
Support levels are displayed as green circles.
Resistance levels are displayed as red circles.
Both use translucency for better chart visibility.
How to Use the CTLO:
Trend Identification:
The presence of a CTLO Support level suggests an underlying bullish trend.
The presence of a CTLO Resistance level suggests an underlying bearish trend.
The absence of either level indicates a possible trend transition or consolidation.
Support and Resistance:
Use CTLO levels as potential support (green) or resistance (red) areas.
These levels often act as price reaction points where bounces or rejections may occur.
Breakouts and Breakdowns:
A decisive close above a CTLO Resistance level could signal a bullish breakout.
A decisive close below a CTLO Support level could signal a bearish breakdown.
Use the optional alerts to be notified of these events.
Trend Continuation:
Price respecting a CTLO Support level can be seen as bullish, suggesting potential long entries.
Price respecting a CTLO Resistance level can be seen as bearish, suggesting potential short entries.
Reversal Anticipation:
As price approaches a CTLO level, watch for signs of reversal (e.g., candlestick patterns, divergences).
Failed breakouts/breakdowns at CTLO levels can lead to strong moves in the opposite direction.
Multiple Timeframe Analysis:
Apply CTLO on different timeframes for a more comprehensive market view.
Higher timeframe CTLO levels often carry more significance.
Combine with Price Action:
Look for candlestick patterns or chart formations near CTLO levels for higher probability setups.
Double tops/bottoms or other reversal patterns at CTLO levels can be particularly significant.
Risk Management:
Use CTLO levels to set stop-loss orders or profit targets.
For breakout trades, consider using the CTLO level as a new stop-loss after the breakout occurs.
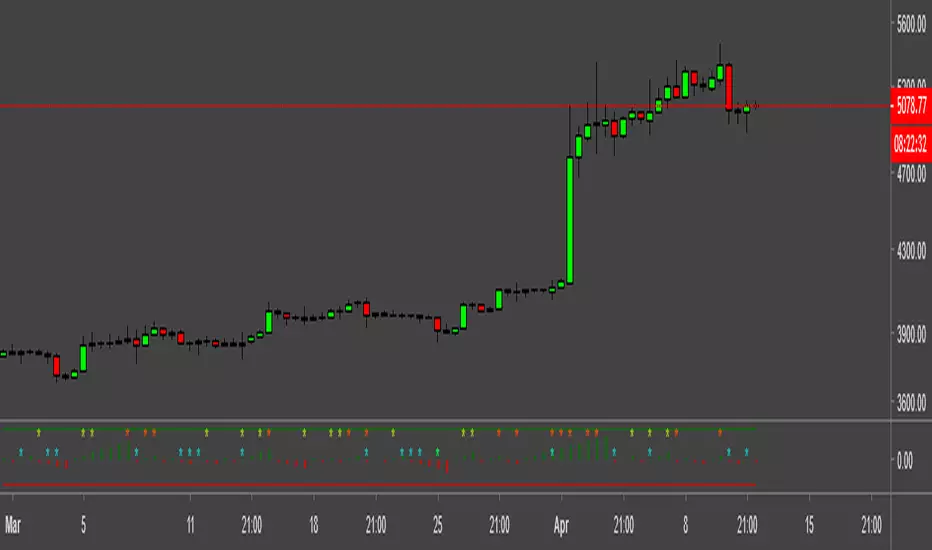
UV IndicatorUV Indicator (Ultimate VWAP Indicator) is using Volume Weighted Average Price to find Direction of the Trend, and Resistance & Support.
- Circle and Square shapes represent the point of Resistance and Support.
- Teal and Maroon background colors represent Uptrend and Downtrend of the Market.
- Numbers represent the Spread Percentages.

Bars Counter + Daily/Weekly Highs/Low highlight.Hey!
This script is a remake from other's devs scripts.
The * makes a signal if there is a higher high or lower low , RED( I don't know why looks orange )/LIME for WEEKLY and AQUA/YELLOW for a 36 hs WINDOW.
You can change this parameter as u wish.
The bar counter is simple.
Let me know ur feedback.
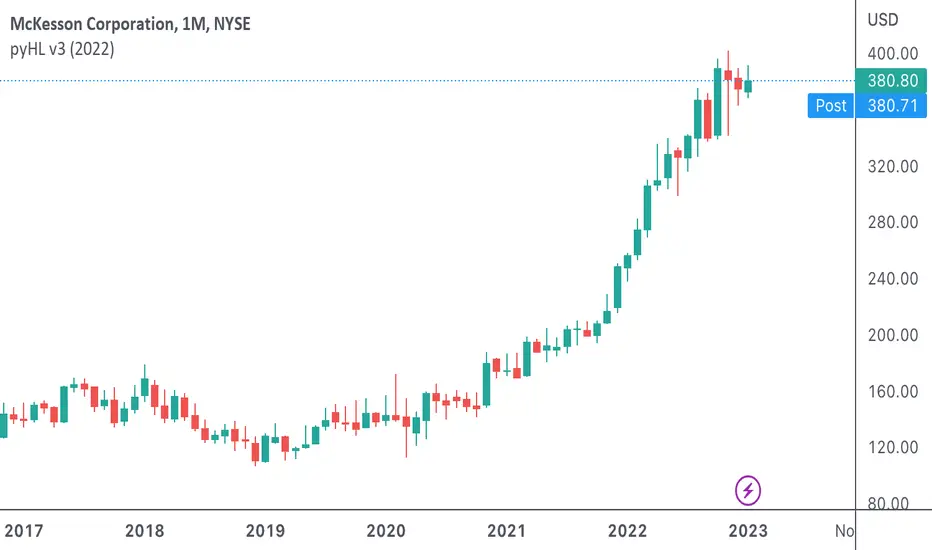
pyHLThis is a customised indicator highlighting key levels of support and resistance on the monthly time frame.
mPiv9 v2This is a customised indicator highlighting key levels of support and resistance on the monthly time frame.

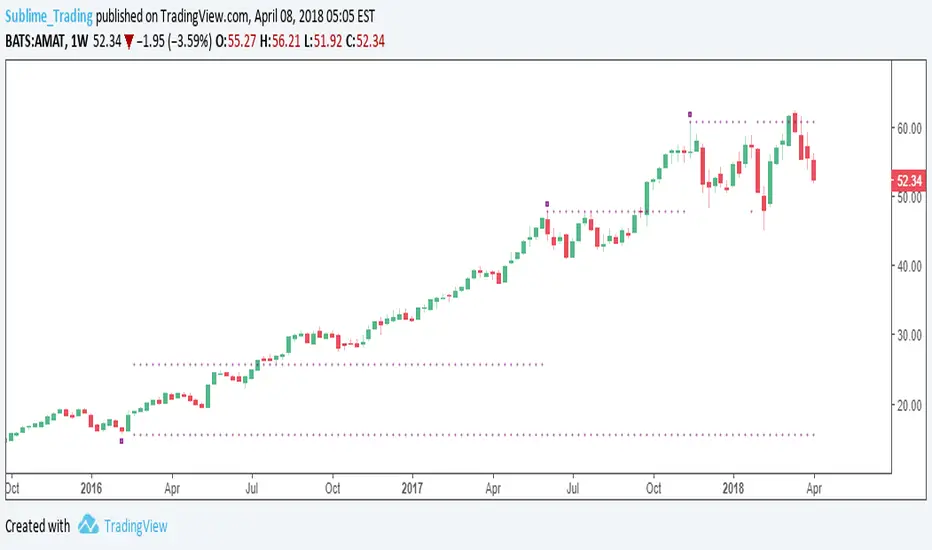
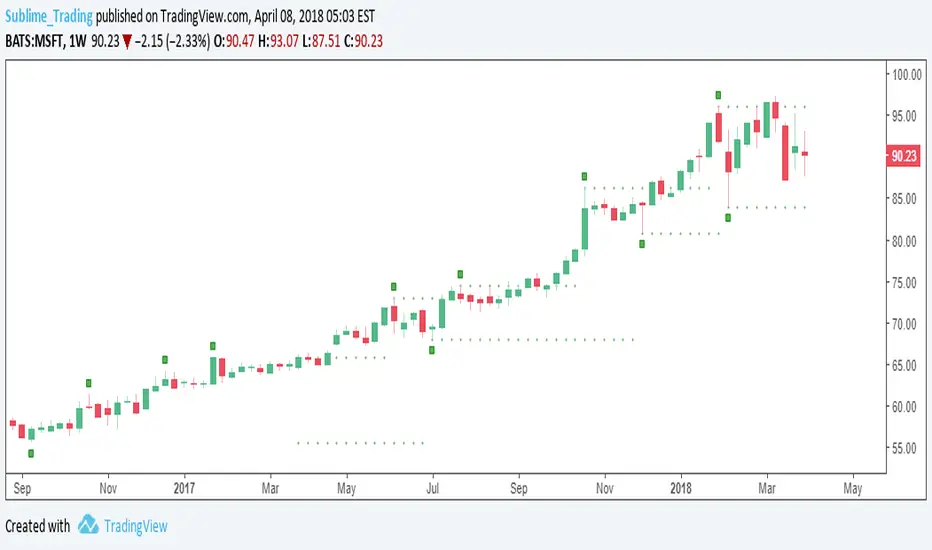
wPiv21This is a customised indicator highlighting key levels of support and resistance on the weekly time frame.

wPiv11This is a customised indicator highlighting key levels of support and resistance on the weekly time frame.
wPiv4This is a customised indicator highlighting key levels of support and resistance on the weekly time frame.
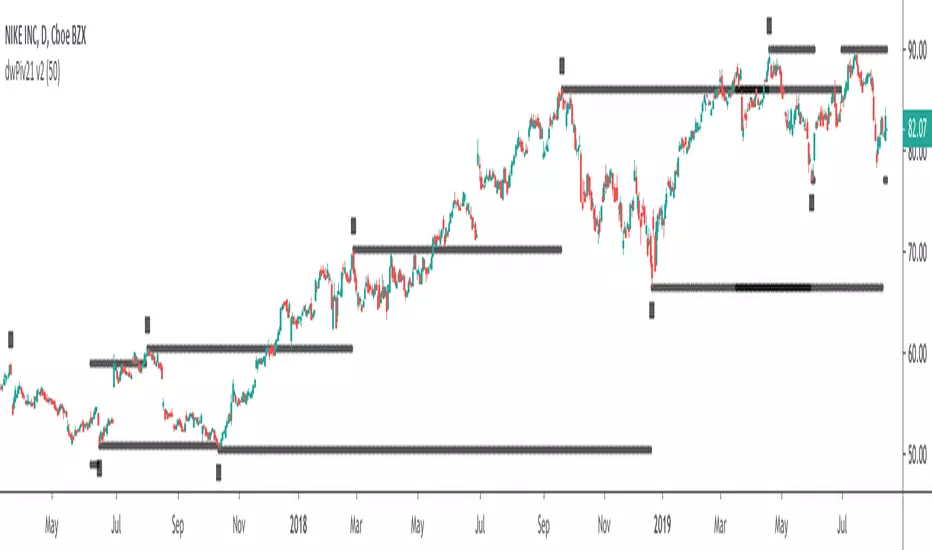
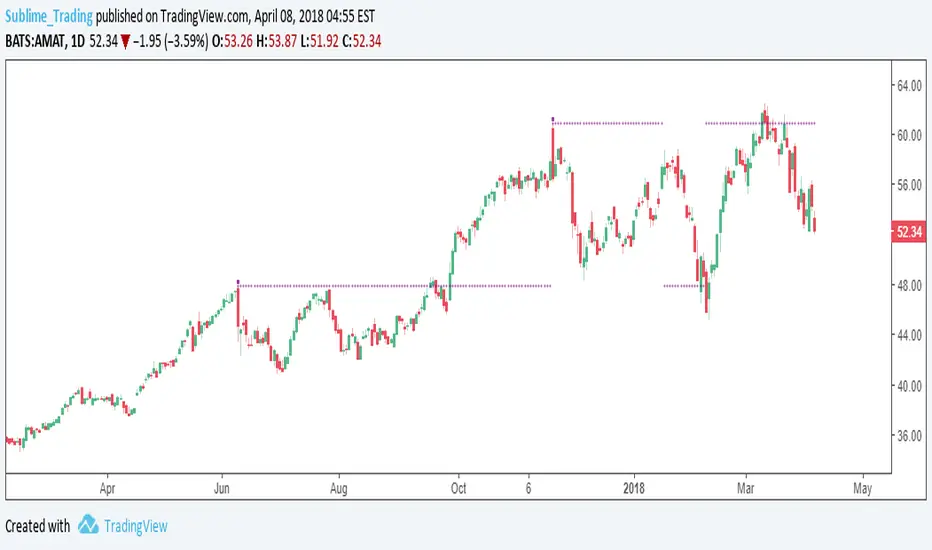
dwPiv21This is a customised indicator highlighting key levels of support and resistance on the daily time frame.
dwPiv11This is a customised indicator highlighting key levels of support and resistance on the daily time frame.
dwPiv4This is a customised indicator highlighting key levels of support and resistance on the daily time frame.

dPiv5This is a customised indicator highlighting key levels of support and resistance on the daily time frame.
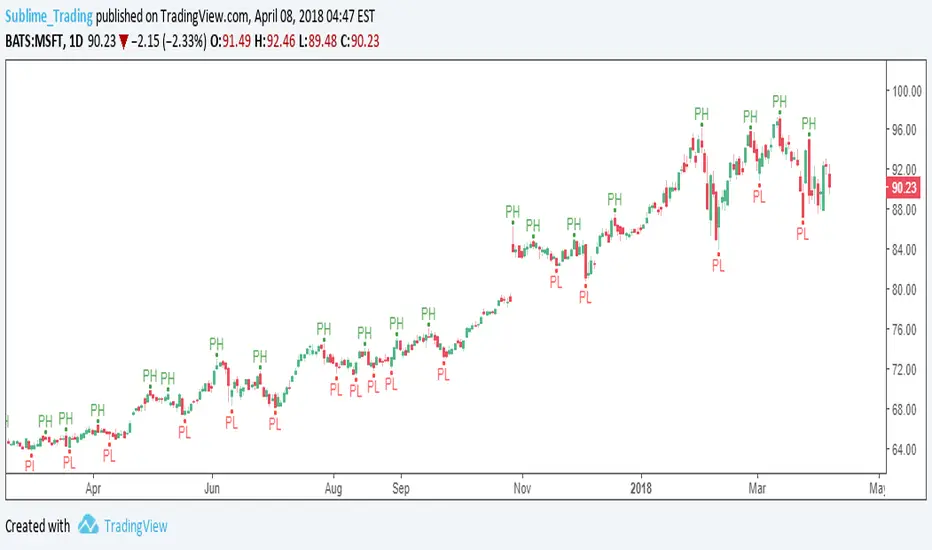
mPiv9This is a customised indicator highlighting key levels of support and resistance on the monthly time frame.
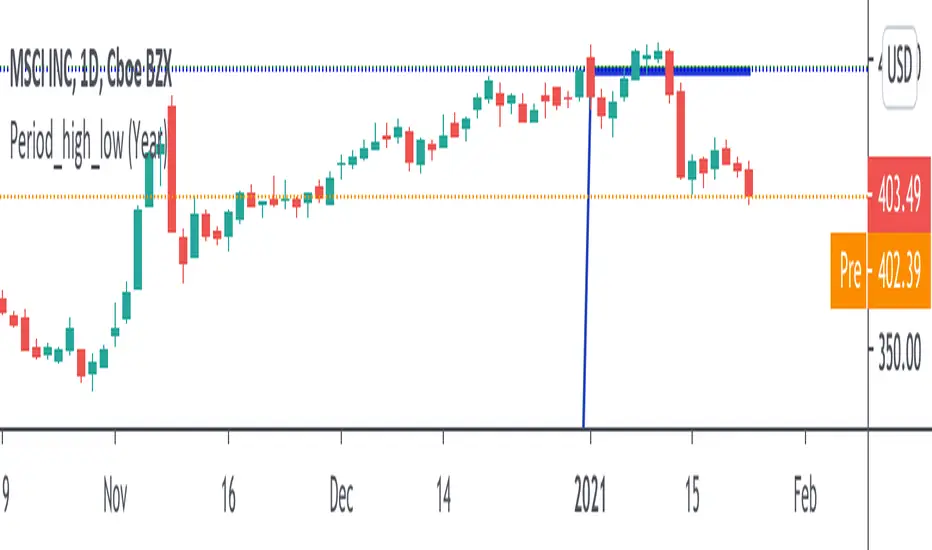
yHLThis is a customised indicator highlighting key levels of support and resistance on the monthly time frame.