Annualized ReturnThis is a straightforward tool for investors, offering the capability to select a specific start date and visualize the annualized return of the currently displayed asset.
Annualized return is a crucial metric for investors, as it provides a standardized measure of an investment's performance, making it easier to compare different investments. By annualizing returns, investors can gain insights into the average yearly growth rate of their investments, enabling more informed decision-making and portfolio management .
Selecting various start dates enables users to understand how market timing can influence the success of their investments.
The annualized return is calculated using the following formula :
AnnualizedReturn = (Ending price / Beginning price) ^ (1 / Number of Years) − 1
Returnoninvestment

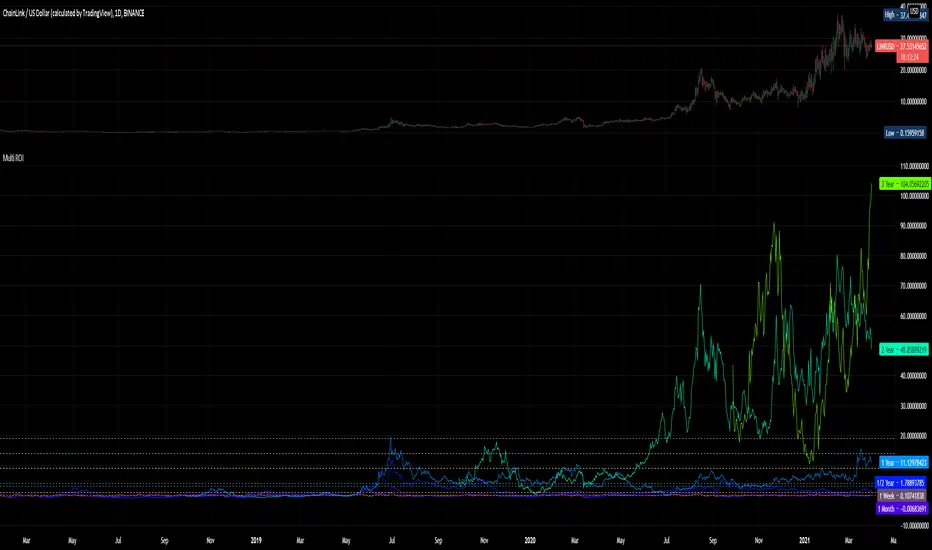
Multi ROIThis is really, really, really basic.
Its just 10 ROIs - Return On Investment- plots for the following periods:
1 week
1 month
1/2 year
1 year
2 year
3 year
4 year
5 year
6 year
7 year
It is meant for 1 day bars. Of course it will work anywhere and you can change the settings to fit your purposes but I thought these were the most useful periods.
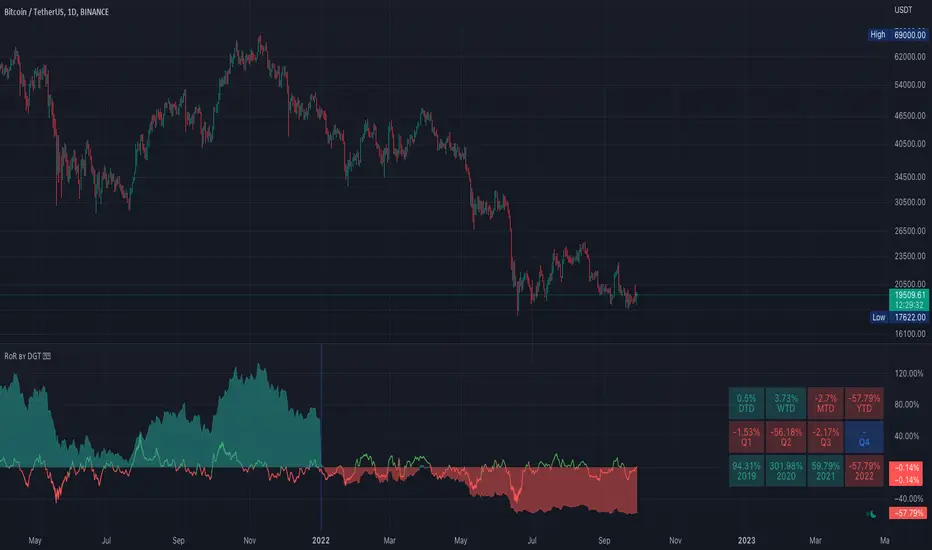
Rate of Return (RoR) by DGTA rate of return (RoR) is the net gain or loss of an investment over a specified time period, expressed as a percentage of the investment’s initial cost