Ribbon
AntiRekt RibbonThis script is a fork of the Madrid Ribbon, the only difference is that you can color your bars depending on the trend.


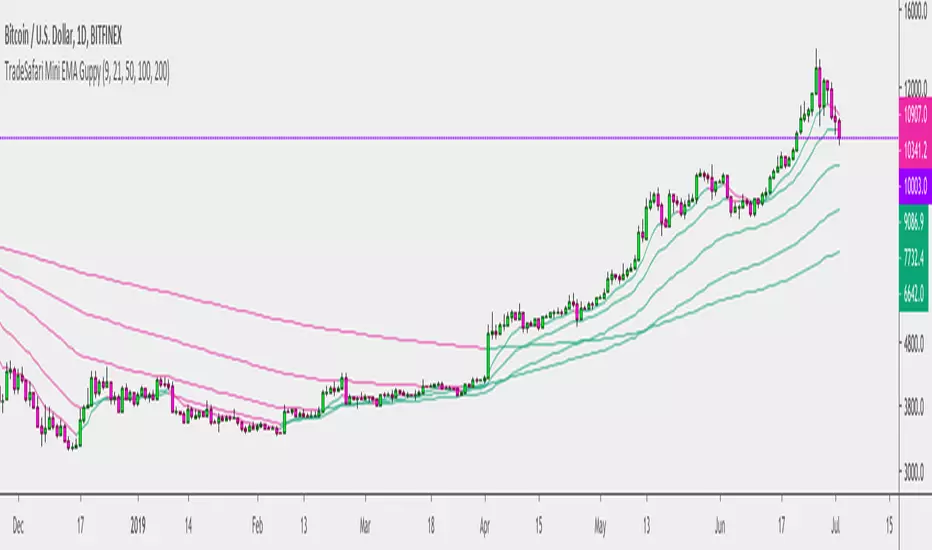
5 EMA Mini GuppyThis is a 5 EMA Ribbon, created to be a simplified version of the Super Guppy, which was used as a starting point.
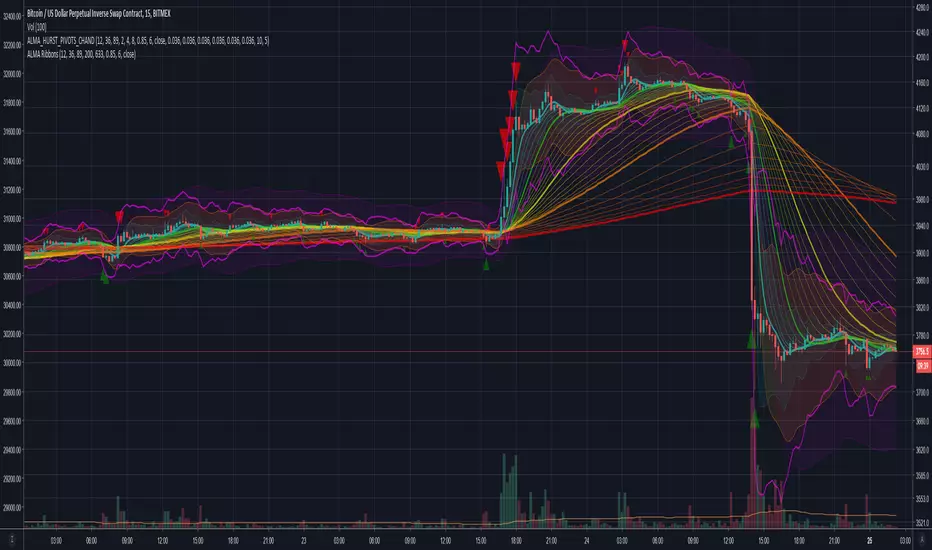
Volume Weighted ALMA RibbonsVolume weighted version of ALMA Ribbons script found here
-------------------------------------------------------
If you find it useful please consider a tip/donation to the rumpy liquidation recovery fund : BTC - 3BMEXEDyWJ58eXUEALYPadbn1wwWKmf6sA


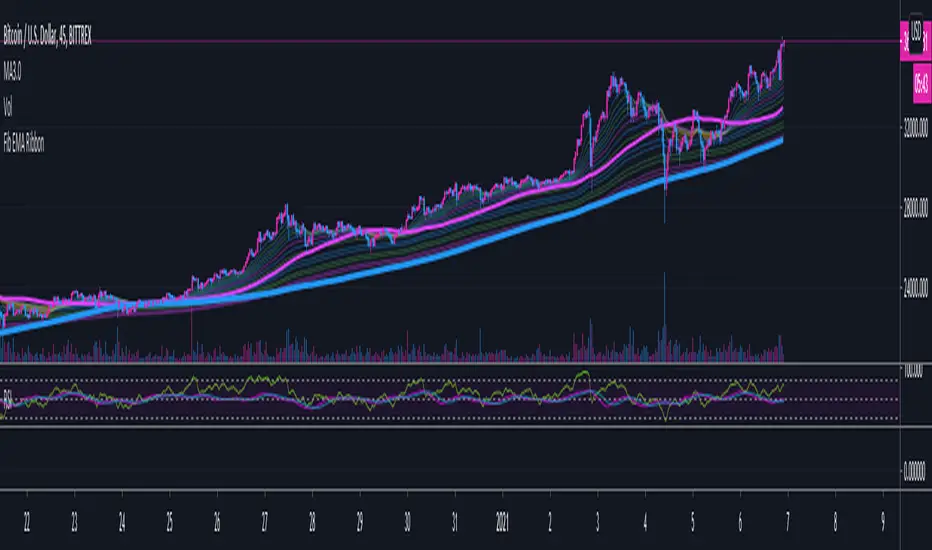
Fib EMA RibbonPretty weird and experimental fibonacci ribbon overlay, for visual use and fun only at the moment. Will update the script if i think of any other ways to use it, ideas welcome.
Meant for use with Heikin Ashi candles.
Biffy
MA Study: Different Types and More [NeoButane]A study of moving averages that utilizes different tricks I've learned to optimize them. Included is Bollinger Bands, Guppy (GMMA) and Super Guppy.
The method used to make it MtF should be more precise and smoother than regular MtF methods that use the security function. For intraday timeframes, each number represents each hour, with 24 equal to 1 day. For daily, 3 is 3 day, for weekly, 4 is the 4 weekly, etc. If you're on a higher timeframe than the one selected, the length will not change.
Log-space is used to make calculations work on many cryptos. The rules for color changing Guppy is changed to make it not as choppy on MAs other than EMA. Note that length does not affect SWMA and VWAP and source does not affect VWAP.
A short summary of each moving average can be found here: medium.com
List of included MAs:
ALMA: Arnaud Legoux
Double EMA
EMA: Exponential
Hull MA
KAMA: Kaufman Adaptive
Linear Regression Curve
LSMA: Least Squares
SMA: Simple
SMMA/RMA: Smoothed/Running
SWMA: Symm. Weighted
TMA: Triangular
Triple EMA
VWMA: Volume Weighted
WMA: Weighted
ZLEMA: Zero Lag
VWAP: Vol Weighted Average
Welles Wilder MA

crashm111 3-200 Moving Average RibbonAll the moving averages bewteen 3 and 200 in increments of 5.
with the ability to change colours
and change between simple and exponential.
It provides an easy and fast way to determine the trend direction and possible reversals.

Dual Timeframe SMA Ribbon CrossoverCopyright by RJ 3/2018
Should be used with lower timeframe and higher timeframe charts
First set your chart to the lower timeframe you'd like to analyze
see f.bpcdn.co
For this method, low timeframe/high suitable timeframe pairs are:
5min with 30min parent
15min with 1hr parent
30min with 4hr parent
4hr with daily parent
daily with weekly parent
weekly with monthly parent
On lower timeframe chart - Plot of 2 smas length 6, 1 Offset
If smas cross - and bar crosses the sma convergence, and full body of bar crosses SMAs - then this is a buy or sell opportunity
For confirmation - on the higher timeframe chart, check if bar is above or below the smas for that day

Single Indicator 5 EMAS 12/26/50/100/200Hey guys. Here's a basic script that puts 5 EMAs on your screen at once without having to use multiple indicator slots. The colors and bandwidths are customizable, and you can can even hide EMAs which you are not currently using, say if you wanted 12/26 only or 50/200. Happy trading!

TEMA/hullMA Ribbon with Bollinger BandsDesigned for shorted time frames.
Bollinger bands based off of TEMA as source.
Ribbon based off TEMA and hullMA divergence.
RMA used to signal Bollinger bands.
Ribbon:
pinch -> reversal
blue -> sign of possible uptrend
red -> sign of possible downtrend
Bollinger bands background:
blue -> sign of continuing uptrend
red -> sign of continuing downtrend

Fisher Transform Ribbons Indicator V1.0Utilizing the Fisher Transform by Ehlers with different lengths based on multipliers will allow you to notice movements in price and understand whether the shift was a correctional wave, or part of the overall trend.
To learn about Fisher Transform , check out the Fisher Transform documentation: www.mesasoftware.com
Fisher has plenty of functionalities. Ribbons provides you with a view of consistency in price action. If all ribbons flip, generally this is a strong signal that the trend is changing. Fisher is extremely punctual (minimum input lag) and robust (doesn't miss movement). Look for everything, including divergences, trends, and Oversold, Overbought points.
Changing length will further provide you more sensitivity in overselling and buying, while numbing chop.
Enjoy!
And for a single Fisher, check out HPotter's Fisher Transform or LazyBear's implementation of the inverse of the Fisher, which has many other interesting properties

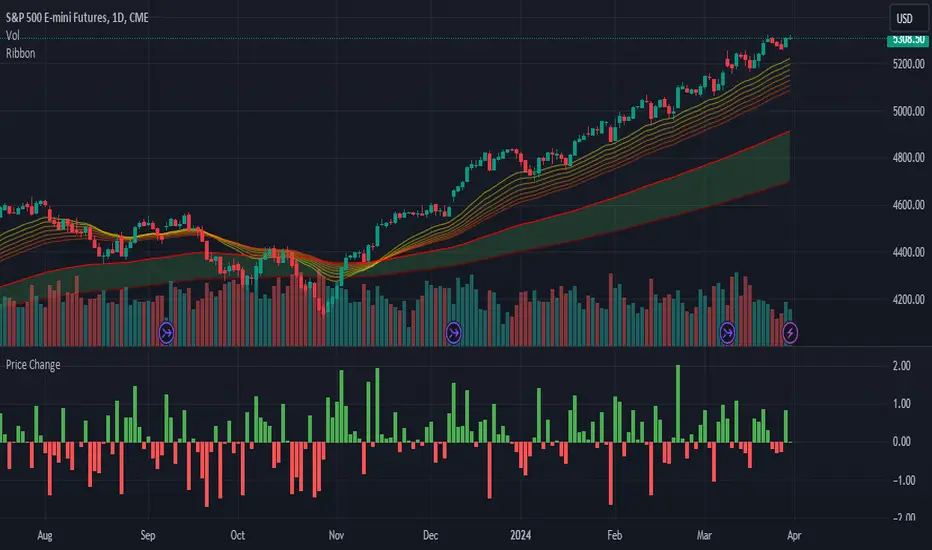
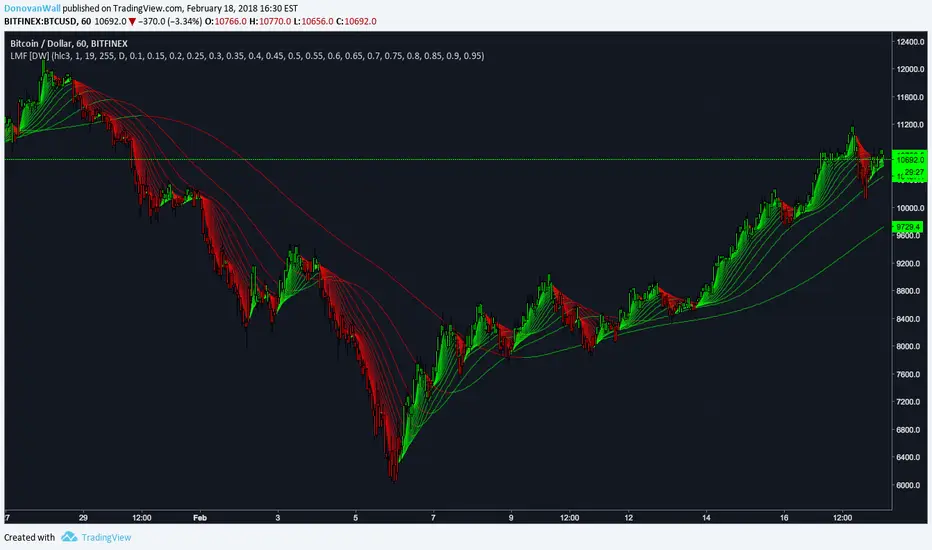
Laguerre Multi-Filter [DW]This is an experimental study designed to identify underlying price activity using a series of Laguerre Filters.
Two different modes are included within this script:
-Ribbon Mode - A ribbon of 18 Laguerre Filters with separate Gamma values is calculated.
-Band Mode - An average of the 18 filters generates the basis line. Then, Golden Mean ATR over the specified sampling period multiplied by 1 and 2 are added and subtracted to the basis line to generate the bands.
Multi-Timeframe functionality is included. You can choose any timeframe that TradingView supports as the basis resolution for the script.
Custom bar colors are included. Bar colors are based on the direction of any of the 18 filters, or the average filter's direction in Ribbon Mode. In Band Mode, the colors are based solely on the average filter's direction.
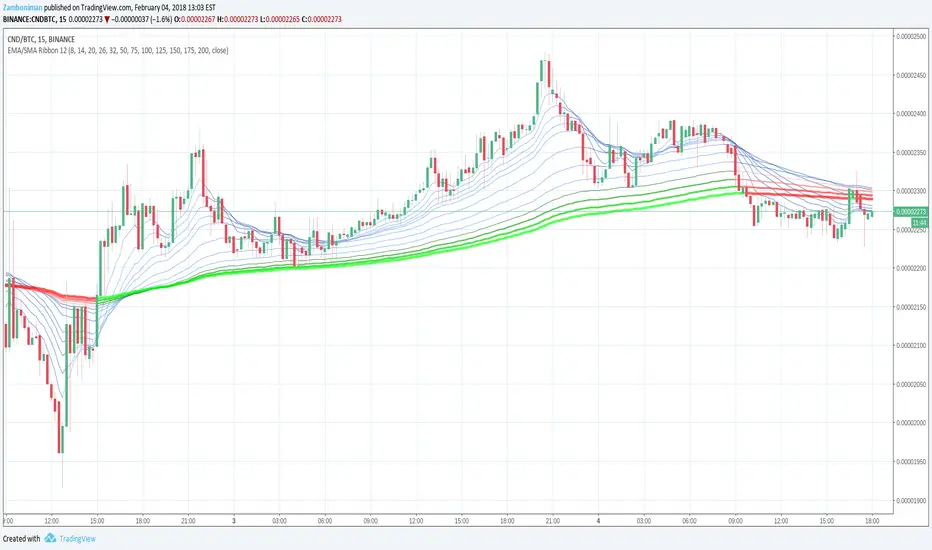
Exponential/Simple Moving Average Ribbon 12Due to popular demand (one person asked) this is an updated version of my EMA 12 indicator.
This indicator will show up to twelve moving averages at a time in a single indicator. Or, to put it another way, a moving average ribbon.
You can turn individual MAs off or on at your discretion, to show from none to twelve at a time, to better visualize support and resistance areas off of MAs as well as MA crossings.
You can also, of course, adjust the length/period of each of the MAs at your discretion.
In this version, most significantly, you can select either exponential moving average or simple moving average as well for each individual MA.
For the last four MA lines, the color will change from red when bearish to green when bullish. There is also a much more subtle color change in the other MA lines as well.
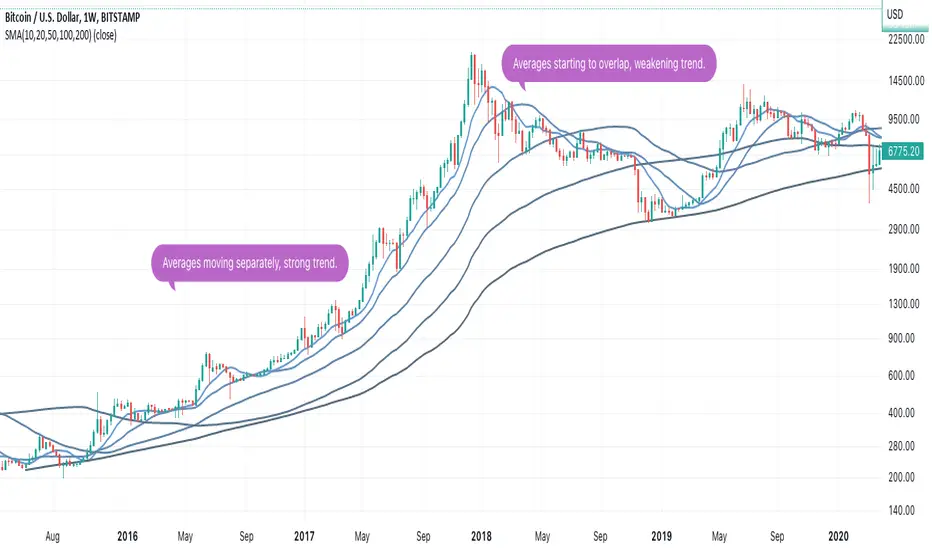
Log-Space EMA Ribbon [Krypt]Similar to basic EMA Ribbon indicator except uses log-space transformation. Should be better on very long timeframes and for determining beginning of a bull market. The tradeoff is that it is slower than regular EMA near peaks (regular EMA will outperform this indicator when determining when to sell).

EMA Ribbon [Krypt]A convenient way to add a ribbon indicator (one indicator instead of multiple EMAs)

Exponential Moving Average Ribbon 12This indicator shows up to twelve exponential moving average lines at once in a single indicator. Or, to put it another way, an EMA ribbon.
You can turn off individual EMAs at your discretion, showing between none and twelve at a time, and of course you can change the period lengths of each at your discretion.
The last four EMAs are green when bullish and red when bearish. The others will change color slightly too, much more subtly.
Why another one of these? There's a few of these already, but I wanted the ability to quickly turn off and on different EMA lines to see certain things, like support and resistance off an EMA, without having to futz about changing the period length on different ones, and I wanted something with a few more EMA lines than others provided.
I use this with other analysis to help determine trade opportunities.

Fibonacci Period KAMA SeriesThis study is a simple experiment using Kaufman's Adaptive Moving Average that plots a base average with a period of your choice, then plots averages with periods multiplied by Fibonacci numbers 2 through 34.
Fibonacci Time Moving Average Ribbons [DW]This is an experimental study that takes a moving average of price, then offsets the average by up to 11 consecutive Fibonacci numbers from 1 to 144.
Choose between Kaufman's Adaptive Moving Average, Hull Moving Average, Fractal Adaptive Moving Average, Geometric Moving Average, or Exponential Moving Average.
