VixTrixVixTrix - Because markets move in both directions.
VixTrix was born from a fundamental limitation in traditional volatility indicators: they only measure downside panic, completely missing the greed-driven extremes that form market tops.
How It Works:
Dual-Component Analysis:
vixBear = Panic selling intensity (distance from recent highs)
vixBull = FOMO buying intensity (distance from recent lows)
Oscillator = vixBear - vixBull = Net fear/greed imbalance
When the oscillator is positive, fear dominates (potential bottom forming). When negative, greed dominates (potential top forming).
Professional-Grade Filtering:
The magic happens with the symmetric RMS (Root Mean Square) bands. Unlike fixed percentage bands or standard deviation, RMS:
Creates mathematically symmetric positive/negative thresholds
Naturally adapts to changing volatility regimes
Provides statistical significance to extremes
VixTrix also adds selectable MA smoothing for the RMS calculation:
WMA (default): Balanced – middle-ground approach
VWMA: Volume-weighted – filters low-volume noise
EMA: Responsive – catches quick reversals
SMA: Stable – for swing trading
HMA: Fast and smooth – ideal for day trading
Signals require triple confirmation:
Statistical Extreme: Oscillator beyond RMS band
Price Action Confirmation: Correct candle color (bullish for bottoms, bearish for tops)
Momentum Continuation: Oscillator still moving toward extreme (exhaustion)
This multi-filter approach reduces premature entries and false signals while maintaining early positioning at potential reversal points.
Why This Matters for Your Trading:
In bull markets, traditional fear indicators sit near zero, giving no warning of impending tops.
VixTrix identifies when greed becomes excessive – when FOMO buying reaches statistical extremes that often precede corrections.
In range-bound markets, VixTrix excels at identifying overreactions in both directions, providing high-probability mean reversion opportunities.
During crashes, it captures the panic selling with the same precision as VixFix, but with better timing through its momentum confirmation.
VixTrix spots continuations through:
"No Signal" = Healthy Trend – Oscillator stays between RMS bands (no exhaustion)
Failed Extremes – Touches band but no triple confirmation = trend likely continues
Hidden Divergence – Price makes higher low while oscillator makes shallower low = uptrend continues
Controlled Emotions – Oscillator negative but not extreme in uptrends (greed present but not excessive)
Key Insight: When VixTrix doesn't give a signal during a pullback, institutions aren't panicking – they're just pausing before resuming the trend.
Green columns = Bullish exhaustion (potential bottoms)
Red columns = Bearish exhaustion (potential tops)
Golden RMS bands = Dynamic thresholds adapting to current volatility
Background highlights = Active signal conditions
The Result: A professional-grade oscillator that works in all market conditions – trending up, trending down, or ranging – by measuring the complete emotional spectrum driving price action.
RMS

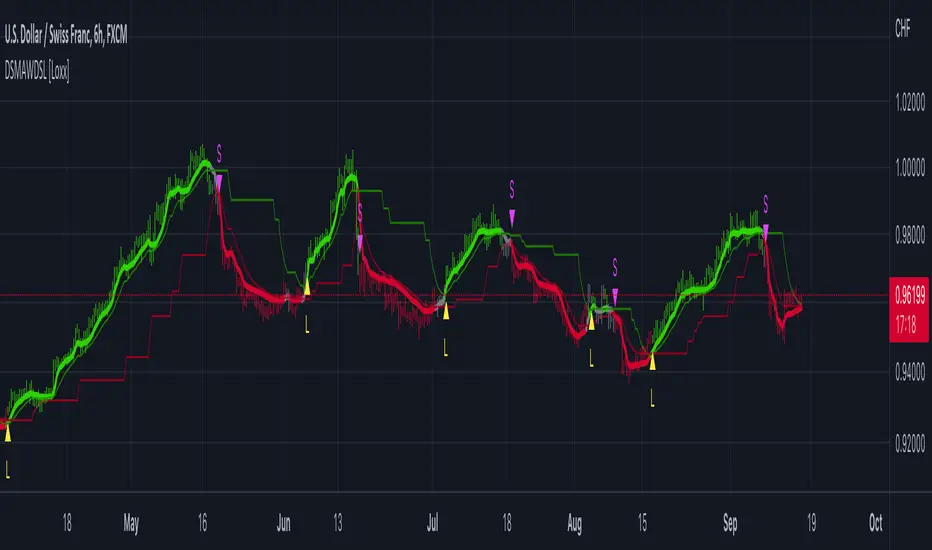
Deviation Scaled Moving Average w/ DSL [Loxx]Deviation Scaled Moving Average w/ DSL as described in the “The Deviation-Scaled Moving Average.” article of July 2018 TASC . This is an adaptive moving average average that has the ability to rapidly adapt to volatility in price movement. This version adds Discontinued Signal Lines create the buy/sell signals.
What are DSL Discontinued Signal Line?
A lot of indicators are using signal lines in order to determine the trend (or some desired state of the indicator) easier. The idea of the signal line is easy : comparing the value to it's smoothed (slightly lagging) state, the idea of current momentum/state is made.
Discontinued signal line is inheriting that simple signal line idea and it is extending it : instead of having one signal line, more lines depending on the current value of the indicator.
"Signal" line is calculated the following way :
When a certain level is crossed into the desired direction, the EMA of that value is calculated for the desired signal line
When that level is crossed into the opposite direction, the previous "signal" line value is simply "inherited" and it becomes a kind of a level
This way it becomes a combination of signal lines and levels that are trying to combine both the good from both methods.
In simple terms, DSL uses the concept of a signal line and betters it by inheriting the previous signal line's value & makes it a level.
Included
2 Signal types
Alerts
Loxx's Expanded Source Types
Bar coloring
ArrayStatisticsLibrary "ArrayStatistics"
Statistic Functions using arrays.
rms(sample) Root Mean Squared
Parameters:
sample : float array, data sample points.
Returns: float
skewness_pearson1(sample) Pearson's 1st Coefficient of Skewness.
Parameters:
sample : float array, data sample.
Returns: float
skewness_pearson2(sample) Pearson's 2nd Coefficient of Skewness.
Parameters:
sample : float array, data sample.
Returns: float
pearsonr(sample_a, sample_b) Pearson correlation coefficient measures the linear relationship between two datasets.
Parameters:
sample_a : float array, sample with data.
sample_b : float array, sample with data.
Returns: float p
kurtosis(sample) Kurtosis of distribution.
Parameters:
sample : float array, data sample.
Returns: float
range_int(sample, percent) Get range around median containing specified percentage of values.
Parameters:
sample : int array, Histogram array.
percent : float, Values percentage around median.
Returns: tuple with , Returns the range which containes specifies percentage of values.

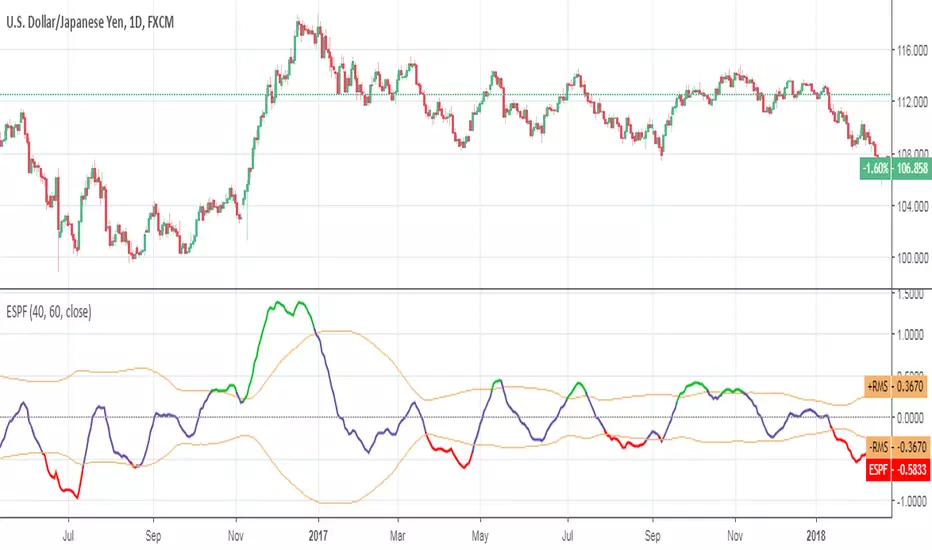
Ehlers Super Passband FilterEhlers Super Passband Filter script.
This indicator was originally developed by John F. Ehlers (Stocks & Commodities V. 34:8: The Super Passband Filter).
Shift RMS [DW]This is an experimental study designed to track the average magnitude of price movements.
First the range between high and low, and the range between open and close are calculated.
Then a positive and negative root mean square is taken of both ranges, and the results are smoothed with an exponential moving average.
And lastly, the median value between the ranges is calculated and smoothed with an ema to provide a signal line.
This study can be used to identify trending and detrending price activity.
