Supertrade's RVI Long-Only Strategy with SL/TP (RR 1:3)This strategy, titled "Supertrade’s RVI Long-Only Strategy with SL/TP (RR 1:3)", is designed to capitalize on potential bullish reversals using the Relative Vigor Index (RVI) as its core signal generator. It is best optimized for trading XAUUSD on the 15-minute timeframe , where it has demonstrated favorable historical performance.
The RVI is calculated using a 10-period standard deviation of the closing price, with smoothing applied through a 14-period exponential moving average. This approach helps to distinguish between uptrend and downtrend volatility, allowing the strategy to identify momentum shifts with precision. A long position is triggered when the RVI crosses above the 20 level, suggesting a potential transition from a weak to a stronger bullish phase.
Risk management is embedded through a user-defined stop-loss (default set at 1% below the entry price) and a fixed reward-to-risk ratio of 1:3. This means that for every 1% of capital risked, the strategy targets a 3% gain, maintaining favorable risk-reward dynamics throughout its execution. Once a position is entered, it will exit automatically at either the stop-loss or take-profit level, depending on which is reached first.
This strategy is meant for educational and research purposes only. While it has performed well historically on specific assets and timeframes, past performance is not indicative of future results . Market conditions can change, and no strategy guarantees success in all environments. Please exercise proper risk management and test thoroughly before applying in live markets.
RVI

Crypto RSI with RVI StrategyThis is a long only strategy adapted for crypto market.
Its idea is to take the most juice out of a long trend and cut the losses as soon as possible.
For this , its components are RSI with a very big length - 100 or 200 preferably and RVI.
Rules for entry
If RVI is in the buy zone and we have a crossover from RSI with the overbought level.
Rules for exit
With change condition : If RVI is in the sell zone and we have a cross under from RSI with the oversold level.
With stop loss : we have a SL based on movement in % of the price, recommendable between 5-10%.
If you have any questions let me know !

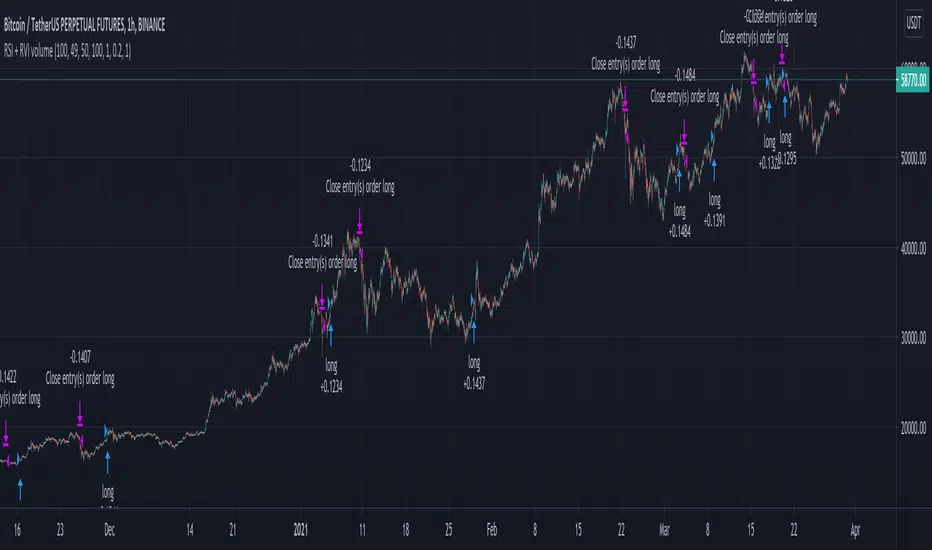
RSI and RVI on volume crypto BTC This strategy combine special version of RSI and RVI , where in this case , I am using the volume , for measuring the speed and change of volume to the price both up and down size together with the volatility spikes.
In this case instead of looking at the volume or volatility, I am combining them into one oscillator.
For best usage, I believe a big length of candles like 100 can get better results, and use it in this way as a lagging indicator.
Since most of the tests I made for futures, I applied a risk management in % of the price movement. For stop loss we have 20% while for TP, 100%. However in both cases, we will exit sooner, and thats going to be when condition from the oscillator says so.
For this we have a middle level, 50, which will act as both overbought and oversold areas.
At the same time I apply the posibility of using leverage into size calculations for more precise tests and try to get min-max out of it.
If you have any questions, please let me know !
CRYPTO RVI FUTURE 1HThis is a crypto strategy adapted for the futures pairs, especially the perpusdt ones from binance for 1h time frame.
The main component here is the RVI, which is a modified form of the RSI indicator. The RVI, measures more the general direction of the volatility, and can get the trends far smoother than the RSI.
The logic inside is the same like we would normally do with RSI, we check for overbought and oversold levels, and based of that we have an entry or exit depending if we go long or short.
I have tested this product with all the pairs from PERPUSDT from binance and seems to works with the majority of them, of course on some better than the others.
If there are any questions, please let me know !

Growth Producer
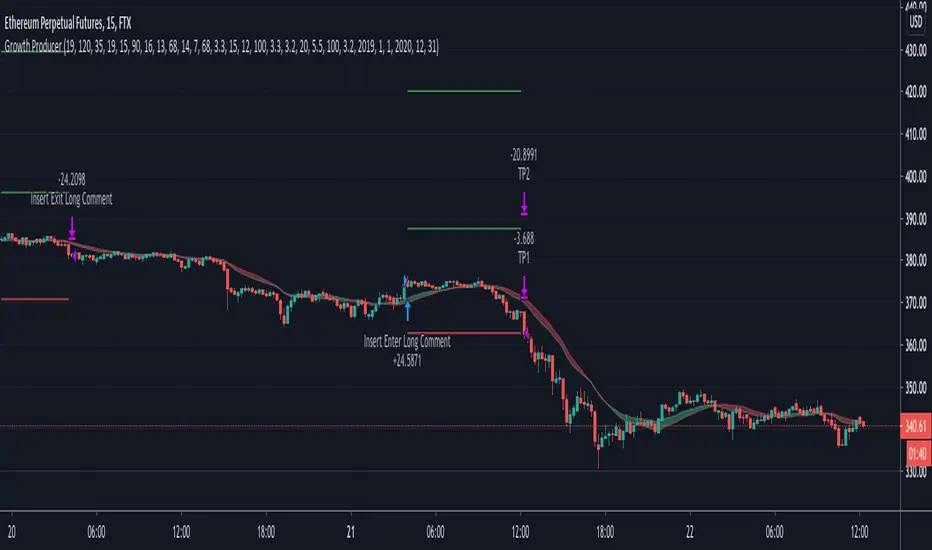
Applicable to FTX:ETHPERP 15 min
Relative volatility index (RVI) that will determine the entry and exit points only when the volatility will start to increase and Money Flow index as an additional point for entry.
IMPORTANT
• Input Partial take profits in your Bot settings
• This is a trend strategy and works better in the trending market
• We added the trend identifier using the EMA and SMA interaction
• We added Take profit and stop loss levels
• We added inputs for the period selection, so you could see how the strategy is performing on a monthly basis.
• RVI for the entry conditions
• MFI was added for the additional entries.
• Partial Take-profits
Expert studio strategy 1 - GBPUSDThis is part of a series of strategies developed automatically by a online software.
I cannot share the site url, which is not related to me in any way, because it is against the TV reules.
This strategy was optimized for GBPUSD, timeframe 1D, fixed lots 0.1, initial balance 1000€.
LOGIC:
- LONG ENTRY when previous candle is bear
- LONG EXIT: RVI > signal line
- SHORT ENTRY when previous candle is bull
- SHORT EXIT: RVI < signal line
NOTE: I considered the open of actual candle instead of close otherwise there will be a back shift of 1 candle in pine script
Take profit = no
Stop loss = no
I have also a study with alarms.
Please use comment section for any feedback.

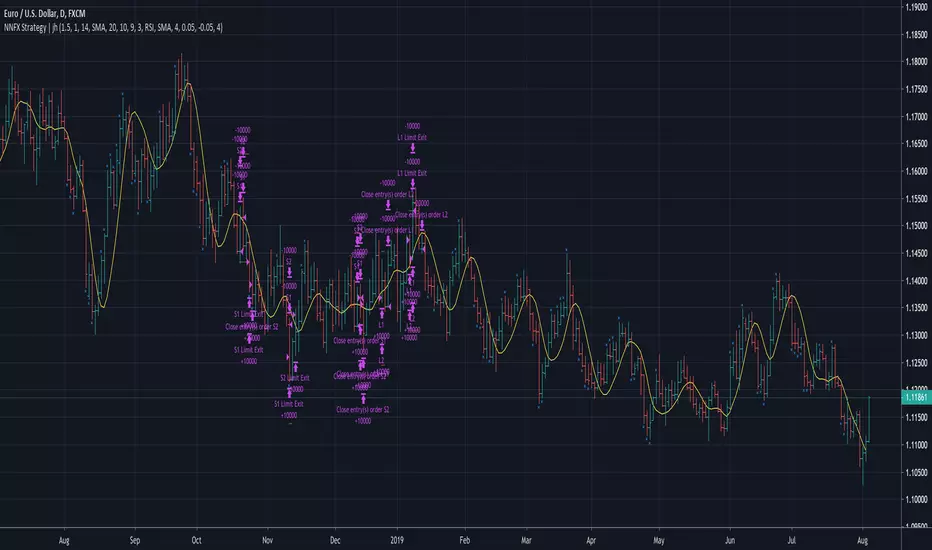
No Nonsense NNFX VP Strategy for Back Testing | jhMy first script, be kind :)
Most of the rules are implemented:
- Money management
- ATR, Baseline, Confirmation, Volume, Exit
More details below.
//////////////////////////////////////////////////////////////////////////////////////////////////////////////////////////////////
//////////////////////////////////////////////////////////////////////////////////////////////////////////////////////////////////
//Designed per No Nonsense Forex VP rules
//Made to be as modular as possible, so we can swap the indicators in and out.
//Originated from causecelebre
//Tried to put in as much VP rules as possible
///////////////////////////////////////////////////
//Rules Implemented:
///////////////////////////////////////////////////
// - SL 1.5 x ATR
// - TP 1 x ATR
//
// - Entry conditions
//// - Entry within 1 candles of baseline + 1 x confirmation + volume
//// - Entry only if baseline is < 1 x ATR
// - Exit conditions
//// - Exit on exit indicator or when baseline or confirmation flip
///////////////////////////////////////////////////
//Trades entries
///////////////////////////////////////////////////
// - First entry L1 or S1 with standard SL and TP
// - Second entry L2 or S2 with standard SL and exit upon the exit conditions
///////////////////////////////////////////////////
//Included Indicators and settings
///////////////////////////////////////////////////
// - Baseline = HMA 20
// - Confirmtion = SSL 10
// - Volume = TDFI 4
// - Exit = RVI 4
///////////////////////////////////////////////////
//Credits
// Strategy causecelebre
// TDFI causecelebre
// SSL Channel ErwinBeckers
//////////////////////////////////////////////////////////////////////////////////////////////////////////////////////////////////
//////////////////////////////////////////////////////////////////////////////////////////////////////////////////////////////////
Ehlers Fisher Stochastic Relative Vigor Index StrategyBy John Ehlers from his book "Cybernetic Analysis for Stocks and Futures".

Relative Volatility Index Backtest The RVI is a modified form of the relative strength index (RSI).
The original RSI calculation separates one-day net changes into
positive closes and negative closes, then smoothes the data and
normalizes the ratio on a scale of zero to 100 as the basis for the
formula. The RVI uses the same basic formula but substitutes the
10-day standard deviation of the closing prices for either the up
close or the down close. The goal is to create an indicator that
measures the general direction of volatility. The volatility is
being measured by the 10-days standard deviation of the closing prices.
You can change long to short in the Input Settings
WARNING:
- For purpose educate only
- This script to change bars colors.

Inertia Indicator The inertia indicator measures the market, stock or currency pair momentum and
trend by measuring the security smoothed RVI (Relative Volatility Index).
The RVI is a technical indicator that estimates the general direction of the
volatility of an asset.
The inertia indicator returns a value that is comprised between 0 and 100.
Positive inertia occurs when the indicator value is higher than 50. As long as
the inertia value is above 50, the long-term trend of the security is up. The inertia
is negative when its value is lower than 50, in this case the long-term trend is
down and should stay down if the inertia stays below 50.
You can change long to short in the Input Settings
Please, use it only for learning or paper trading. Do not for real trading.
