EPS and Sales Magic Indicator V2EPS and Sales Magic Indicator V2
EPS and Sales Magic Indicator V2
Short Title: EPS V2
Author: Trading_Tomm
Platform: TradingView (Pine Script v6)
License: Free for public use under fair usage guidelines
Overview
The EPS and Sales Magic Indicator V2 is a powerful stock fundamental visualization tool built specifically for TradingView users who wish to incorporate earnings intelligence directly onto their price chart. Designed and developed by Trading_Tomm, this upgraded version of the original 'EPS and Sales Magic Indicator' includes an enriched and more insightful presentation of company performance metrics — now with TTM EPS support, advanced color-coding, label sizing, and refined control options.
This indicator is tailored for retail traders, swing investors, and long-term fundamental analysts who need to view Quarter-over-Quarter (QoQ) earnings and revenue changes directly on the price chart without switching tabs or breaking focus.
What Does It Display?
The EPS and Sales Magic Indicator V2 intelligently detects quarterly financial updates and displays the following data points via labels:
1. EPS (Earnings Per Share) – Current Quarterly Value
This is the most recent Diluted EPS published by the company, fetched using TradingView’s request.financial() function.
Displayed in the format: EPS: ₹20.45
2. EPS QoQ Percentage Change
Shows the percentage change in EPS compared to the previous quarter.
Highlights improvement or decline using arrows (up for improvement, down for decline).
Displayed in the format: EPS: ₹20.45 (up 15.3 percent)
3. Sales (Revenue) – Current Quarterly Value
Fetches and displays Total Revenue of the company in ₹Crores for easier Indian-market readability.
Displayed in the format: Sales: ₹460Cr
4. Sales QoQ Percentage Change
Measures and presents the quarter-over-quarter percentage change in total revenue.
Uses arrows to indicate growth or contraction.
Displayed in the format: Sales: ₹460Cr (down 3.8 percent)
5. EPS TTM (Trailing Twelve Months)
You now get the TTM EPS — the sum of the last four quarterly EPS values.
This value provides a better long-term earnings snapshot compared to a single quarter.
Displayed in the format: TTM EPS: ₹78.12
All of these values are automatically calculated and displayed only on the bars where a new financial report is detected, keeping your chart clean and insightful.
Customization Features
This indicator is built with user control in mind, allowing you to personalize how and what you want to see:
Show EPS in Label: Enable or disable the display of EPS and EPS QoQ values.
Show Sales in Label: Toggle the visibility of revenue and sales change percentage.
Color Options for Label Themes: The label background color is automatically determined based on performance.
Green: Both EPS and Sales increased QoQ.
Red: Both decreased.
Orange: One increased and the other decreased.
Gray: Default color (if values are unavailable or mixed).
Label Text Size: Choose from Tiny, Small (default), or Normal.
Visual Design
Placement: The labels are positioned just below the candlesticks using yloc.belowbar, so they do not obstruct price action or interfere with technical indicators.
Anchor: Aligned precisely with the financial reporting bars to maintain clarity in historical comparisons.
Background Style: Clean, semi-transparent styling with soft text colors for comfortable viewing.
How It Works
The indicator relies on TradingView’s powerful request.financial() function to extract fiscal quarterly financials (FQ). Internally, it uses detection logic to identify fresh data updates by comparing current vs. previous values, arithmetic to compute QoQ percentage changes in EPS and Sales, logic to build formatted labels dynamically based on user selections, and conditional color and sizing logic to enhance interpretability.
Use Cases
For Long-Term Investors: Quickly identify if a company’s profitability and revenue are improving over time.
For Swing Traders: Combine recent earnings trends with price action to evaluate if post-result momentum has real backing.
For Technical and Fundamental Traders: Layer it with moving averages, RSI, or volume to create a hybrid analysis environment.
Limitations and Notes
Financial data is provided by TradingView’s financial API, and occasional missing values may occur for less-covered stocks.
This tool does not repaint but depends on the timing of the official financial updates.
All values are rounded and formatted to prioritize readability.
Works best on Daily or higher timeframes (weekly or monthly also supported).
License and Fair Use
This script is free to use and share under TradingView’s open-use guidelines. You may copy, fork, and build upon this indicator for personal or educational purposes, but commercial usage requires attribution to the author: Trading_Tomm.
Future Enhancements (Planned)
Addition of Net Profit (QoQ and TTM)
Inclusion of Operating Margin, Profit Margin, and Book Value
Option to switch between numeric and graphical display (table mode)
Alerts on extreme earnings deviation or sales slumps
Final Thoughts
The EPS and Sales Magic Indicator V2 represents a clean, visual, and smart way to monitor a company’s core performance from your chart screen. It helps you align fundamental strength with technical strategies and provides instant financial clarity, which is especially vital in today’s fast-moving markets.
Whether you’re preparing for an earnings season or scanning past performance to pick your next investment, this indicator saves time, enhances insights, and sharpens decisions.
Salesgrowth

Earning, Sales, and PriceThis Pine Script indicator is designed to visualize and analyze the growth of Earnings Per Share (EPS) and Sales for a given stock over specified time periods. With a user-friendly interface, it allows traders and investors to monitor key financial metrics, helping them make informed decisions based on company performance.
The script presents earnings, sales, and price growth in a clear tabular format directly on the price chart. It features two distinct tables: one for annual data and another for quarterly metrics. For each financial metric, the script calculates and displays growth figures by comparing the current results with either the previous quarter's numbers or the previous year's figures. Additionally, it showcases the stock price along with the corresponding growth between these two data points, providing a comprehensive view of the stock's performance over time.
How to Use:
Typically, growth stocks will rally for a few quarters. However, after significant rallies, the stock needs rest. During this period, the stock will either consolidate or slide down slowly to take support at the key moving average. Importantly, during this time, sales and earnings may continue to grow while the stock is still consolidating.
Typically, after the stock consolidates significantly—even when sales and earnings numbers are increasing—the stock will finally start the next leg of the rally just before the next earnings date or immediately after the earnings report.
For this purpose, the script shows the EPS and sales growth. Additionally, the script displays the price when the previous earnings were declared along with the price growth. This data can be used to find patterns in the stock's behavior. Utilize this indicator to analyze growth patterns and make informed trading decisions based on historical performance and upcoming earnings expectations.
Key Metrics Analyzed:
Earnings Per Share (EPS): Monitors the diluted earnings per share to evaluate company profitability.
Total Revenue: Analyzes sales performance, providing insights into overall revenue generation.
Price Growth: Tracks changes in stock price alongside EPS and sales for comprehensive performance assessment.
Usage:
Ideal for investors and traders looking to evaluate company growth potential and make data-driven decisions.
Use in conjunction with other technical analysis tools for a holistic approach to stock analysis.

Revenue GridDescription:
The Revenue Grid indicator helps traders and investors visualize a stock’s valuation by plotting horizontal lines based on its price-to-sales (P/S) ratio. This tool displays how the stock price compares to multiples of its total revenue per share, giving a clear perspective on valuation benchmarks.
Fundamental Concept:
The price-to-sales ratio compares a company’s stock price to its revenue per share. It’s used to evaluate whether a stock is overvalued or undervalued based on its revenue.
This indicator offers a unique way to view this ratio by applying Fibonacci multiples to the revenue per share. It plots lines at these multiples to show how the stock price measures up against different valuation levels.
How It Works:
Data Inputs:
Total Revenue (TR): The company’s revenue over the past twelve months.
Total Shares Outstanding (TSO): The total number of shares in circulation.
Calculation:
Calculates the revenue per share (TR/TSO).
Plots lines at fixed Fibonacci multiples (e.g., 1x, 2x, 3x, 5x, 8x, 13x) of the revenue per share value.
How to Use:
1. Add the "Revenue Grid" indicator to your chart by searching for it in the indicator library and applying it.
2. Observe the lines plotted on the chart. If these lines are trending upwards, it indicates that the revenue is increasing.
3. Analyze how historical prices trend relative to these lines. Look for periods where the stock price supports around specific multiples, you can easily get a sense of overvaluation or undervaluation in certain periods.
Use this information to guide further analysis and investment decisions.
Benefits:
1. Clear Valuation View: Easily see how the company’s revenue translates into stock price levels.
2. Investment Insight: Identify if the stock price is lagging behind revenue growth, which might signal a buying opportunity.
3. Historical Context: Understand how the market has historically valued the company and assess the current valuation.
Do let me know your feedbacks in comments. Happy Investing :)

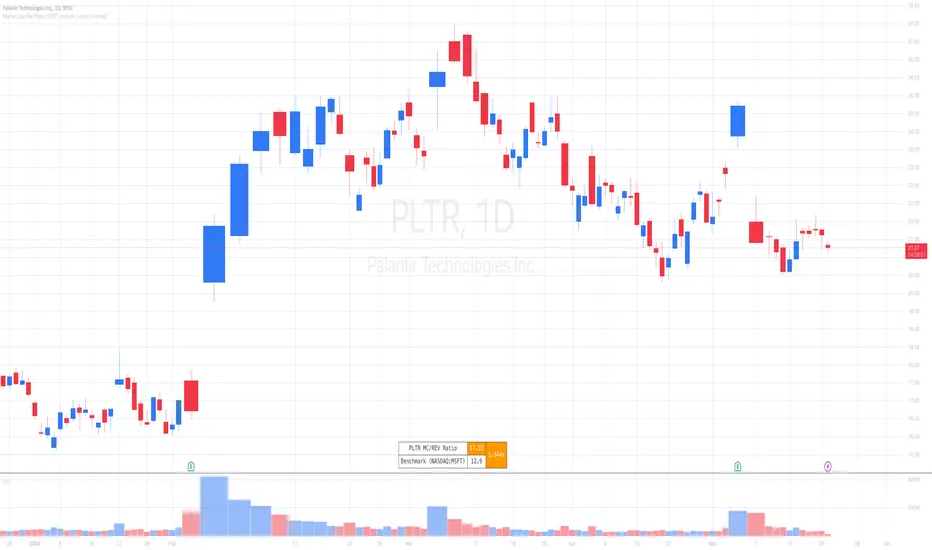
Market Cap / Revenue RatioA variation of the P/S ratio, this script takes the future estimated revenue of the current stock versus it's Market Cap. It then compares the aforementioned Market Cap:Revenue ratio against a market bellwether's corresponding ratio (MSFT by default) to determine the following:
- Light green when the ratio is extremely low (Stock is very undervalued)
- Green when the ratio is low (Stock's multiple is lower by 20-50%)
- Blue when the ratio is close to the benchmark (Stock is fairly valued to benchmark multiple)
- Red when the ratio is high (Stock's mulitple is higher by 50% or more)
- Dark red when the ratio is extremely high (Stock is very overvalued)
CONFIGURABLE
- Full Table: Show the entire calculation table
- Minimalist: Go minimal and show only the ratio and color code
- Show Benchmark Multiple: Show the multiple ratio calculated between the current stock and the benchmark stock (MSFT by default)
NOTES
- When calculating the Market Cap, TradingView sometimes under-reports the number of shares and thus skews the Market Cap too low. This seems to happen for stocks with multiple share classes like GOOGL so be mindful that the data can be wrong for these kinds of stocks. You can check on this by going into the Indicator's Settings and select Show Full Table which will show the number of shares outstanding reported by TradingView.
- For certain stocks such as foreign ADRs, there won't be a future revenue estimate so the script will automatically use the Total Revenue for the most recent Quarter in these cases
Fundamental ScreenerThis indicator is designed to compare the year-over-year earnings and sales growth, as well as the P/E ratio of up to 10 stocks simultaneously .
This provides valuable insights into the fundamental performance of multiple stocks at the same time, allowing traders to quickly identify which stocks are outperforming or underperforming their peers.
The earnings and sales growth figures are calculated on a year-over-year basis , comparing the most recent quarter to the same quarter 1 year ago.
The P/E ratio is a valuation metric that measures a company's stock price relative to its trailing twelve months earnings per share.
By comparing these three key metrics across multiple stocks, traders can quickly identify which stock in a group has superior fundamentals.
Customization
Chose to compare 5 or 10 symbols
Table position, color, and size

