VSA | Volume Spread Analysis [Kintsugi Trading]What is the VSA | Volume Spread Analysis Indicator?
I created this premium volume indicator to find and place high probability forex trades as a part of the Kintsugi Trading 3LS | 3 Line Strike Strategy .
Originally developed by Tom Williams who is considered the father of Volume Spread Analysis, this tool is an amazing indicator and would make a great addition to any trading strategy.
You are free to customize all the inputs:
• 30 | Moving Average-1 Multiplier (Average Volume)
• 0.5 | Moving Average-1 Multiplier (Below Average Volume)
• 1.5 | Moving Average-2 Multiplier (High Volume)
• 3.0 | Moving Average-3 Multiplier (Ultra High Volume)
**Note The default inputs are based on my research and analysis.
Components of The Volume Spread Analysis:
1. The Volume (i.e. activity)
2. The Spread (i.e. range of the price bar)
3. The Close (the closing price of the current bar)
Volume: Volume is the activity of the frequency of transaction of the price change during a specified period of time.
Spread: Spread is the difference between opening and closing price.
Close: Close price tells us where the balance point is at the end of the period.
At Kintsugi Trading we strongly believe that we cannot beat or outperform institutional traders, instead, we have to trade along with them. With that in mind, we follow the footprints of smart players who leave behind trails.
I have designed this indicator so that it is capable of giving signals for all the phenomena explained in Tom William's book.
This Indicator is successful at visualizing the following phenomenon:
• Trapped Buyers
• Trapped Sellers
• Stopping Volume (long)
• Buying Climax
• Selling Climax
Good luck with your trading!
Scalping

Pips-Stepped PDFMA [Loxx]Pips-Stepped PDFMA is and Pips-stepped moving average that uses a probability density function moving average. This is tuned for Forex. You must adjust the step size to extreme levels for this to work for crypto or stocks. Try 30000 for BTC on the daily chart, for example.
What is Probability Density Function?
Probability density function based MA is a sort of weighted moving average that uses probability density function to calculate the weights.
Included:
Bar coloring
Alerts
Expanded source types
Signals
Flat-level coloring for scalping

Easy Scalping by JayKasunBINANCE:BTCUSDTPERP
This indicator can show stochastic RSI K and D line crosses and some candlestick patterns on chart.
You can use this indicator to scalping, check usage for more info. Always backtest before trading with your real money.
This indicator will also help mobile TradingView users to get an idea when getting stochastic RSI signals, they can use this indicator to check if stochastic RSI K and D crossed or not. ( Because they have limited area to view chart ) .
4 Exponential moving averages are there in the indicator with easy enable disable option. 9 , 21 , 55 , 100 is suggested as default values.
Meanings of signs in chart
Blue triangle bellow candle means it's a stochastic RSI K and D line cross in oversold level
Red triangle above candle means it's a stochastic RSI K and D line cross in overbought level
Green plus sign shows when EMA 50 crossover EMA 100
Red plus sign shows when EMA 50 cross bellow EMA 100
Features
You can enable candlestick pattern displaying when stochastic RSI K and D cross happen. Check indicator settings.
You can enable displaying ATR Trailing Stops in indicator settings.
Indicator will only show blue triangle after Green plus sign and Red triangles after Red plus sign
After you enable candlestick pattern option, stochastic RSI crosses with candlestick patterns will show in deferent colors. Blue triangle will turn into green and Red triangle into pink.
Usage
Use lower time frames like 5m or 15m
After green plus sign, if price retouched 21 EMA or 55 EMA and blue triangle appeared , you can enter a long position.
After red plus sign, if price retouched 21 EMA or 55 EMA and red triangle appeared , you can enter a short position.
Always wait for candle close . signs of chart can be changed when candle closing. ( Does repaint until candle close )
Use ATR trailing to get a stop loss price.
Use 1:1 or 1:0.5 Risk Reward ratio. Because it's scalping and lower time frame.
Use more indicators like RSI to get more confirmations ( like divergences ) before entering a trade. Its more reliable.
Candlestick Patterns Short names
H - Hammer
IH -Inverted Hammer
BE - Bullish Engulfing ( green triangle )
BE - Bearish Engulfing ( pink triangle )
BH - Bullish Harami ( green triangle )
BH - Bearish Harami ( pink triangle )
I have included ATR + Trailing Stops by SimpleCryptoLife and Candlestick Patterns Identified (updated 3/11/15) by repo32
this is a combination of multiple indicators
credit goes to original creators of above indicators

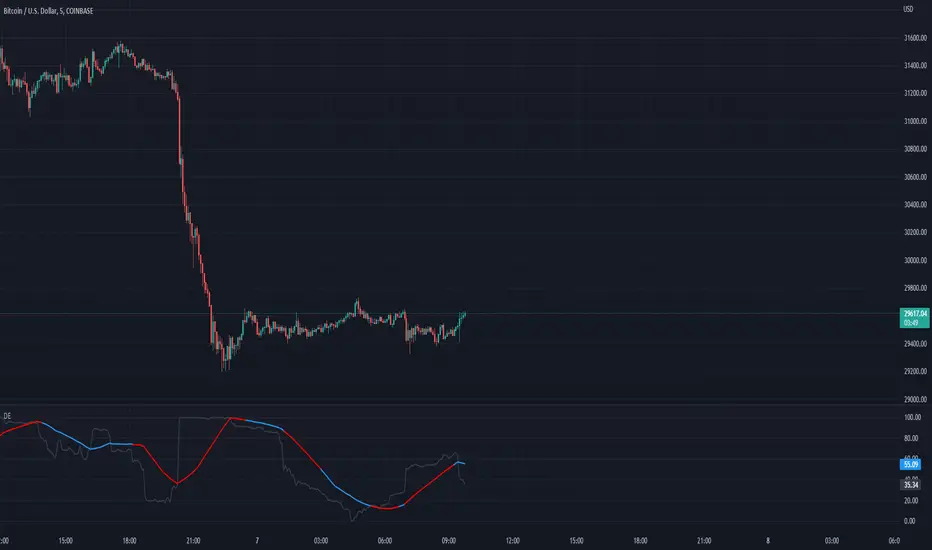
Scot Signal IndicatorThe Scot Signal Indicator is intended as a Scalping Resource. It was designed to work best on the ❗❗ 5 MINUTE CHART with Bitcoin ❗❗ / USD & USDT pairs.
🟡🔼🔽 Yellow Triangles : these are pre-signals. If the triangle is Pointing Down, then look for a possible Short to come, and vice-versa for Upward facing triangles will go Long.
* Be careful, this is a Canary in the Coal Mine, but not the full signal. Going purely on the triangle as a signal could lead to fake-outs more frequently.
🟩 🟥 Green & Red Boxes : these are "Long" & "Short" signals where the indicator feels the time is safe to enter a trade.
❗ EXITING THE TRADE ❗ : this is a scalping indicator, specifically meant for entering trades, NOT EXITING them. An ideal scalp is $100 - $200 Bitcoin move. Though, we run bots using this indicator, taking scalps as little
as $60, performing up to 8 trades a day.

Scalping The Bull PRO IndicatorName : Scalping The Bull PRO Indicator
Category : Scalping, Trend Following, Mean Reversion .
Timeframe : 1M, 5M, 30M, 1D depending on the specific technique.
Technical Analysis : The indicator supports the operations of the trader named "Scalping The Bull" who uses price action and exponential moving averages.
Suggested usage : Crypto Market only , on Altcoins showing strong trends for scalping and intra-day trades. Trigger points are used as entry and exit points and to be used to understand when a signal has more power.
Scalping The Bull PRO Indicator can identify automatically the following conformations with labels on the charts and/or custom alerts.
Shimano : look at the price records of a consecutive series of closings between the EMA 60 and the EMA 223 when a certain threshold is reached. Use the trigger points as price structures to identify entry and exit zones (e.g. breakout of the yesterday high as for entry point).
Bomb : look at the price registers a percentage variation in a single candle, greater than a threshold such as 2%, in particular on shorter timeframes and around the trigger points.
Viagra : look when there is a consecutive series of closes below the EMA 10, a breakout of the EMA should be an important sign of the change of the trend. Viagra can be used with either a Trend-following or Counter-trend approach, so it can be observed when EMA 60 is lower than EMA 223, or when EMA 60 is higher than EMA 223.
Downward fake : look when, after a cross under (Death Cross), the price returns above the EMA 223 using the yesterday high as a trigger point.
Emergence : look at the EMA 60 is about to cross over the EMA 223.
Anti-crossing : look at, after an important price rise and a subsequent retracement, the EMA 60 is about to cross under the EMA 223 but a bullish impulse brings the price back above the EMAs.
For Sales : look at two types of situations: 1) when the price falls by more than 10% from the opening price and around yesterday's low or 2) when the price falls and then reaches, in the last 5 days, a bigger percentage and then breaks a trigger point.
Colour change : look at the opening price of the session - indicated as a trigger point.
Third touch of EMA 60 : look for 3 touches below the EMA 60, and enter when there is a close above the EMA 60.
Third touch of EMA 223 : look for 3 touches below the EMA 223, and enter when there is a close above the EMA 223.
Bud : look at price when it crosses upwards the average 10 and subsequently at least 2 "rest" candles are between the maximum and minimum of the breaking candle.
Fake on EMA 10 : look for the open of a candle higher than the EMA 10, the minimum of the candle lower and the closing price returns above the EMA 10.
For Stop Loss and Profit Targets consider a proper R/R depending on Risk Management, using price structures such as the low of the entering candle and a quick Position Management moving quickly the Stop-Loss at Break-Even.
Configuration :
Graphical Configuration :
Additional EMA : You can display an additional average, e.g. 20-period average.
Session Separators : indicates the beginning of the current session (in blue) .
Background : signals with the background in green an uptrend situation ( 60 > 223) and in red background a downtrend situation (60 < 223).
Labels of Trigger Points .
Take Profit Levels with a display offset .
Label size .
Trigger points :
Today's highs and lows : draw on the chart the opening price of the daily candle and the highs and lows of the day (high in purple, low in red and open in green). An alert can be activated with % offset.
Yesterday's highs and lows : draw on the chart the opening price of the daily candle, the highs and lows of the previous day (high in yellow, low in red). An alert can be activated with % offset.
Colour Change : an alert can be activated with % offset.
EMA Conformations :
Shimano : a label and/or an alert can be activated with a configurable threshold of candles.
Emersion : a label and/or an alert can be activated.
Anti-crossing : a label and/or an alert can be activated.
Fake on EMA : a label and/or an alert can be activated with a configurable threshold of candles.
Price-EMA Conformations :
Viagra : a label and/or an alert can be activated for specific EMA situations, with a configurable threshold of candles.
Third Touch on EMA : a label and/or an alert can be activated for a specific EMA bounce.
Bud : a label and/or an alert can be activated on all timeframes except 1m.
Fake on EMA 10 : a label and/or an alert can be activated on all timeframes except 1m.
Bud + Fake : a label and/or an alert can be activated on all timeframes except 1m.
Price Conformations :
Bomb : a label and/or an alert can be activated with a configurable threshold %.
For Sales : a label and/or an alert can be activated with a configurable threshold %.
Activate all alerts : you can activate all alerts clicking on Alerts, then on Condition “PRO Scalping the Bull” and then selecting “Any alert() function”.
N.B. It is also possible to creates alerts on price-EMA crossing.

God Number Channel V1 (GNC V1)Channel, made of 5 MAs, which a made this way: High of N-period SMA - Low of N-period SMA + X-period SMA (check the code), where N and X are defined by your input.
Main purpose: helps you understand in what range price can move.
WARNING!
HAS TO BE USED WITH OTHER INDICATORS TO HAVE MORE ACCURATE ENTRIES!!!
If the price is above or below the channel, it means that the movement is very strong and you count it as a trend, but be careful then the price returns to the channel, as correction will follow very soon. Use fib correction tool to understand the approximate depth of correction, works pretty good.
Recommendation: consider using the Vortex Indicator( len 21 and 14 are fine; for trend) and "Vumanchu Divergencies + B"(for anything, but calibrate for accuracy, otherwise there will be too much false signals). If you want to see more options where the price might go, just add new MA and add/substract to/from its value avg1*(any of fibonacci correction levels, I personally use 1.618 and 2.618 and for me it is ok): plot(show_ma1 ? ma1+( [ [ ]]]*avg1) : na, color = ma1_color, title="MA №1")
Recommendations and feedback are welcome(!)
Take your wins

Fractal Potential EntryFractal Potential Entry combine 3 ema and fractal and follow the strategy from Trade Pro on YouTube:
www.youtube.com
with good performance on the 1 minute chart
Feature:
Alert Sell and buy Potential Entry
Happy Trading

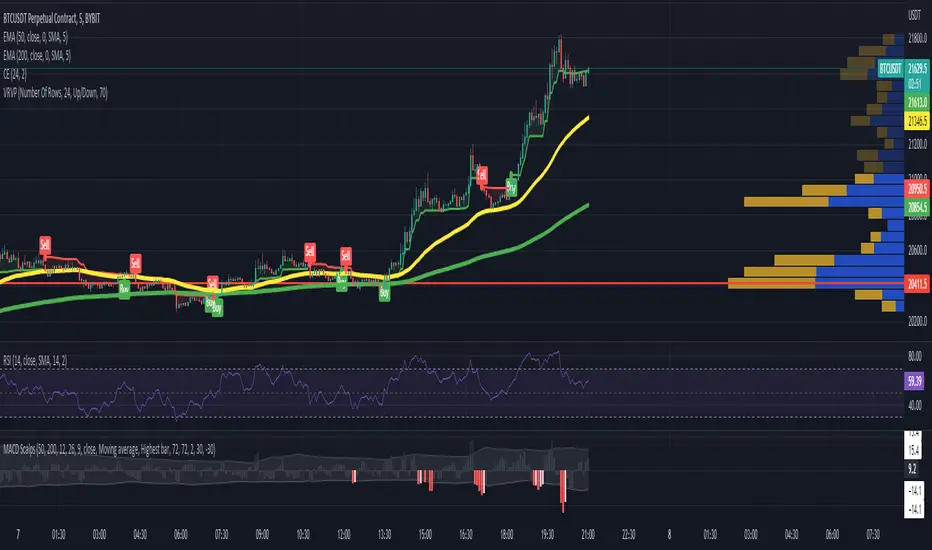
MACD ScalpsMACD Scalping
50 EMA crosses below 200 EMA = Only shorts
50 EMA crosses above 200 EMA = Only longs
For longs: -> Enter on red MACD bar
For shorts: -> Enter on green MACD bar
Bars not big enough or that do not follow the EMA rule are greyed out.
ATR alerts & backtestingThe Basics
Alert will trigger if the current (real time) price surpasses the high of the ATR of the previous bar. (can also be set for the Low of the ATR). Each time the follow up candle surpasses the high of the previous ATR, the background will be coloured orange. This makes back testing easier on the eye. This can be turned off.
- Colours can be changed.
- Can also set a color and alert when the current price surpasses the Low of the ATR of the previous bar.
- ATR distance can be changed.
- Can be used on different chart types.
- Can be used as entry or exits in combination with bots.
- Can display only ATR top or bottom or both.
Example
An alert will trigger if the price of the current bar surpasses the red dot (ATR) of the previous bar.
Alerts can be created on all timeframes, if this is within your Tradingview plan.
Final Words
Disclaimer: Please use it with care and at own risk. The owner of this indicator is not liable for any financial losses.
Past performance is no guarantee of future returns.

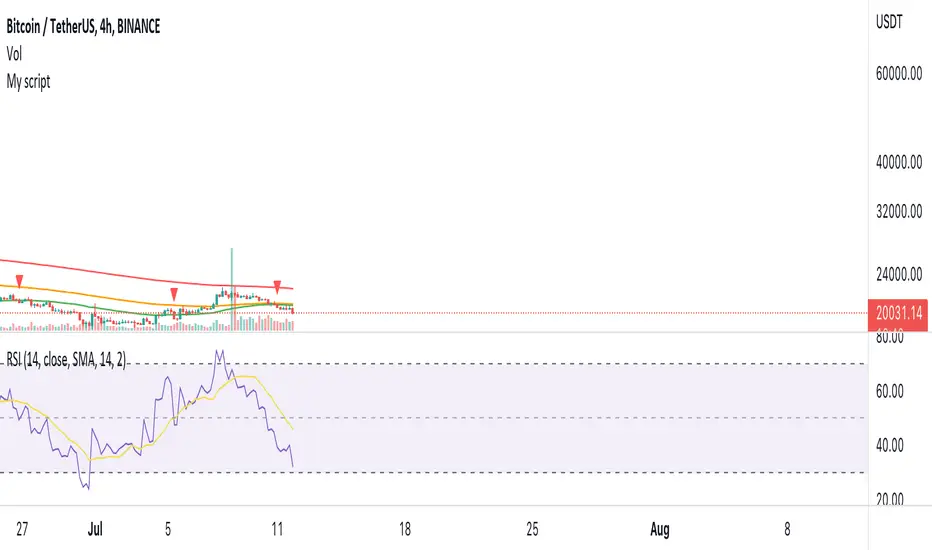
CHN BUY SELLCHN BUY SELL is formed from two RSI indicators, those are RSI 14 and RSI 7 . I use RSI 14 to determine the trend and RSI 7 to find entry points.
+ Long (BUY) Signal:
- RSI 14 will give a "BUY" signal, then RSI 7 will give entry point to LONG when the candle turns yellow.
+ Short (SELL) Signal:
- RSI 14 will give a "EXIT" signal, then RSI 7 will give entry point to SHORT when the candle turns purple.
+ About Take Profit and Stop Loss:
- With Gold, I usually set Stop Loss and Take Profit at 50 pips
- With currency pairs, I usually keep my Stop Loss and Take Profit at 30 pips
- With crypto, I usually keep Stop Loss and Take Profit at 1.5%
Recommended to use in time frame M15 and above .
This method can be used to trade Forex, Gold and Crypto.
My idea is formed on the view that when the price is moving strongly, the RSI 14 will tell us what the current trend is through a "BUY" or "EXIT" signal. When RSI 14 reaches the oversold area it will form a "BUY" signal and when it reaches the overbought area it will give an "EXIT" signal. I believe that when the price reaches the oversold or overbought area, the price momentum has also decreased and is about to reverse.
After receiving a signal from RSI 14, my job is to wait for an Entry signal from RSI 7. When RSI 7 reaches the overbought area, a yellow candle will appear and that's when we enter a LONG order. When the RSI 7 reaches the oversold area, a purple candle will appear and that's when we enter a SHORT order.

Joel on Crypto - MACD ScalpingJoel on Crypto - MACD Scalping
This is a Scalping indicator primarily intended for the 5 minute time frame.
It is based on the Crypto Scalping YouTuber Joel on Crypto's popular 5 minute scalping strategy and this is the indicator he personally use when Scalping.
This is a Multi-timeframe indicator where if you use it on the 5 minute time frame, the MACD Histogram bars will be based on the 1 minute timeframe.
The purpose of this indicator is not to trade it like a bot. The purpose is to grab the traders attention a time where there COULD be a scalping opportunity.
Use this indicator at your own risk.

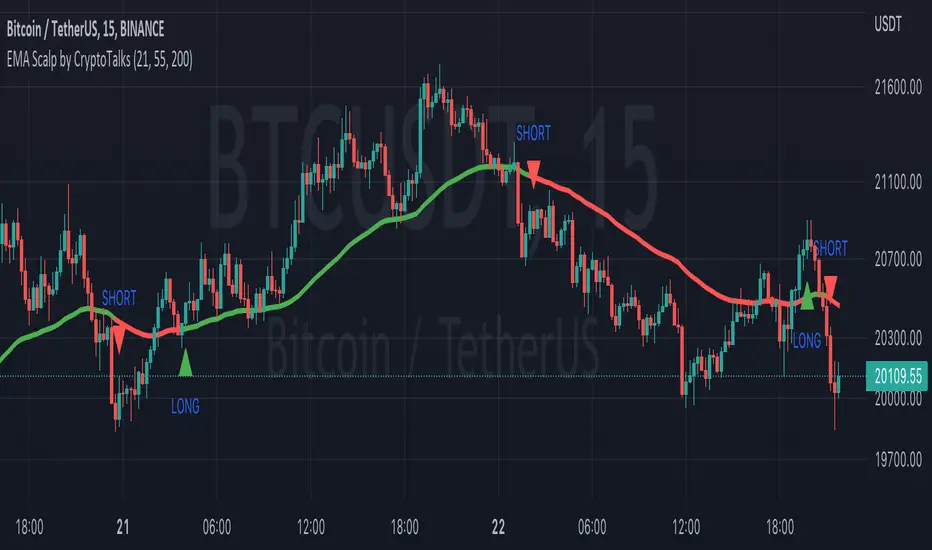
EMA Scalp by CryptoTalksEMA Scalp by Crypto Talks
EMA Scalp by Crypto Talks can be used Using Small Time Frame we Can use it in a better way and on every crossover of Two Moving Averages we can identify the trend for next 15-20 Mins. If you want to use the same for Large time frame even that is possible but you need to hold the call.
Two Different Signals are provided depending on the movement of Moving Averages Long and Short.
There are three Moving Averages used one is 21MA, Second is 55MA and Third one is 200MA where 21 & 55 decides the Market Trend and the third one 200 which confirms the trend and by using these three it makes this indicator Unique.
Thank you
*************
Budhil Vyas
Crypto Talks
(Data Scientist)
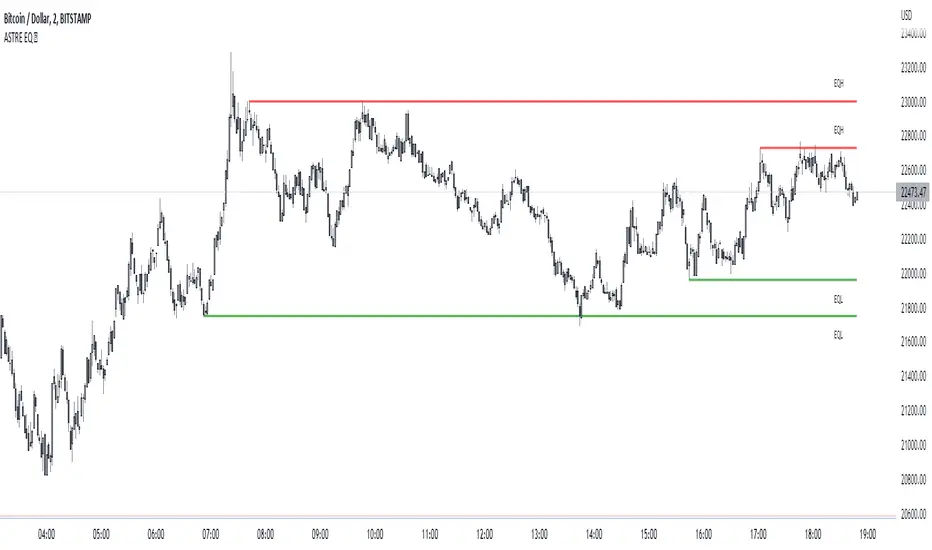
EqwhaleDisplay Equal high/ low, alert when liquidity is taken.. or created !
An innovation that flows a bit if you are an SMC trader and which was actually missing on TradingView: identification of equal high/low, alerts when liquidity is taken... or created!
Its choice in the design means that it gives more importance to the last identified pivots: that is to say that it will display more recently created liquidity than old one! Perfect for identifying market inducement mechanisms (SMC) under an area of interest. This is a typical pattern of induction and false breakout: 2 hits, the break, reintegration, and real move :
Quick exemple on BTC, you are alerted by liquidity created:
Then we grab, and deep. :)
You can display "old broken lines" for backtesting. Careful, it actually display lines when pivot is detected and broken at the same time : it's false. checks that the line has been touched twice :) So, some false lines in the backtest but it does not affect the indicator at all.
You can set number min of pivot at 1 to plot current high/low untested !
Custom GridIt's a simple little tool that enhances Tradingview's horizontal level grid. Set the range of up to 12 assets, you save your model, and the levels will show up automatically when you switch between graphs.
it is obvious to note that the market reacts on the round levels if it discovers its levels for a long time.
Where using notions of supports / resistances gives you level information once the level has been created, again you can correlate this indicator with other SMC and price action tools to identify areas of rejections or dips. institutional interventions.

Liquidity mapLocate institutional daily, weekly, and monthly liquidity intervention zones in an innovative format that allows you to fractalize the degree of trend reversal opportunity across multiple lengths!
Far from the traditional formats to tell you "where's the high/low", we display with this map the grab levels relating to the amplitudes of the measured period.
You can check "show old levels" to backtest these potential fractal reversal areas.
Use the levels that interest you according to your working UT (scalping, intraweek, swing, etc.), or take all the elements into consideration for your trading management :
Confluence the information to optimize your entry and shelter your stop loss under strong levels rejections !
Default parameters are: display high/low weekly & monthly, display liquidities levels in daily.

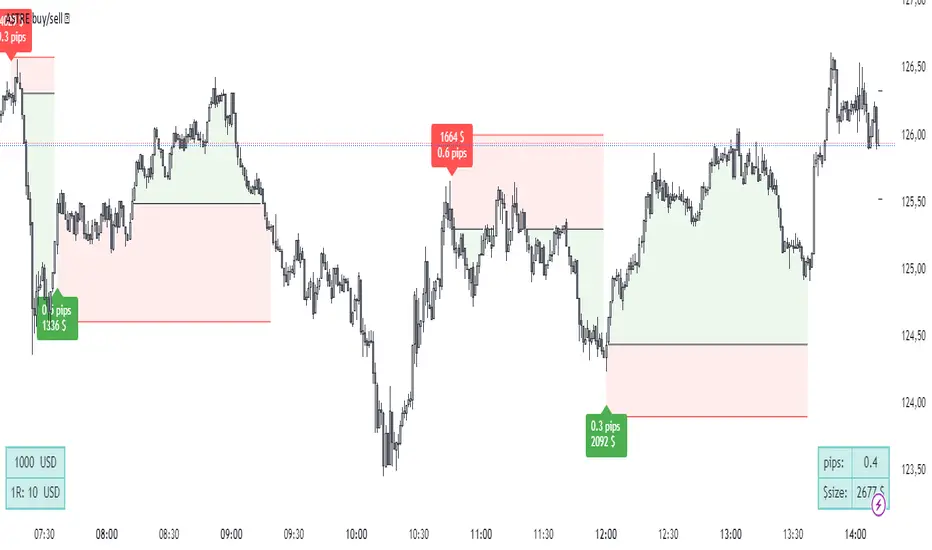
ASTRE Buy/SellWe have designed one of the best buy /sell indicators ! based on our "Reversal score" indicator, a set of strict conditions based on dynamic divergences and fisher's transformation allows to trigger buy signals. The idea is that at a certain level of technical pressure from the indicator, the market has a high probability of changing direction !
(always with the objective of capturing the best top/bottom :) )
Did you miss your trade entry? No problem! The "Barcolor retest" feature allows you to identify a perfect entry on a retest once the structure has been confirmed after a signal:
Exemple on 30s chart :
Using advice :
Use an ATR-type stop loss, or shelter behind bollinger, a short, fixed distance in pips at a minimum below the last local high/low. Your stop loss must be tight and relevant!
For take profit, I recommend that you trail stop part of your position, exit on a contrary signal, or exit part of the position at 5:1 for example.
it is recommended to lower your risk for each identical consecutive signal: 3 buy signals in a row, take a risk for example of $100 on the first, $70 on the second, $40 on the third. The idea is not to be suffocated by the multiple bad signals within the framework of a bad time frame compared to the amplitude of the trend that we seek to take against the trend!
SOON: Easier configuration for 3 commas, backtests. Stay tuned !
astre_ts can in no way be held responsible if your trading account is liquidated after having followed a buy/sell signal and used a large leverage. The signals are reversals: so many are false before having a (very) good trade. Be sure to have strict risk management, or to use a complete strategy so that your results are faithful to the backtests.
Intraday rejection levels3 supports, 3 resistances and an equilibrium price per day displayed at 9am (GMT+2), calculated on the dynamic study of the market at its opening over a certain period that we could qualify as "first opening interventions"
Method: We are interested in the first reaction of the market when it discovers one of the levels.
The red and green zones (from levels R2 to R3) are the zones of rejections/daily overextensions with large RRs of which we will appreciate a rejection for the US opening (where the zones are more opaque, the Killzone!), because the session US is known to either accompany the London session or completely break the trend.
Equilibrium, on the other hand, is a retest zone that can be traded in several directions, ideal for capturing the first retracement / retest of a recently broken structure:
Activate "EL" to display an ideally early morning rejection area so levels can be scalped! They correspond to opportunistic areas above the high and below the low of a custom Asian session ignoring part of the London open - which I consider to be liquidity :):
FIRST SETUP: Confluence R1/R2 with the EL!
SECOND SETUP: The price does not frequent the R2/R3 zone during London but only during the killzone:
Anticipate rejection zones, put them in confluence to find the best opportunity!
Tips:
I'm only interested in the first reaction on these levels
You can measure the difference between R1 and EQ: on average on the EURUSD it must be 20 to 30 pips! Apart from these values, I deduce that the market is unbalanced: I lower my risk on my scalps and I am more cautious.
It is possible to use the previous day's levels to look for correlations
Ideally, the Asia range Custom should not take the high/low of the day before (see "LIquidity maps" indicator on our profile for optimal use)
As an option you can display the standard pivot, and activate the "crypto" mode to be able to use it on your favorite crypto :)

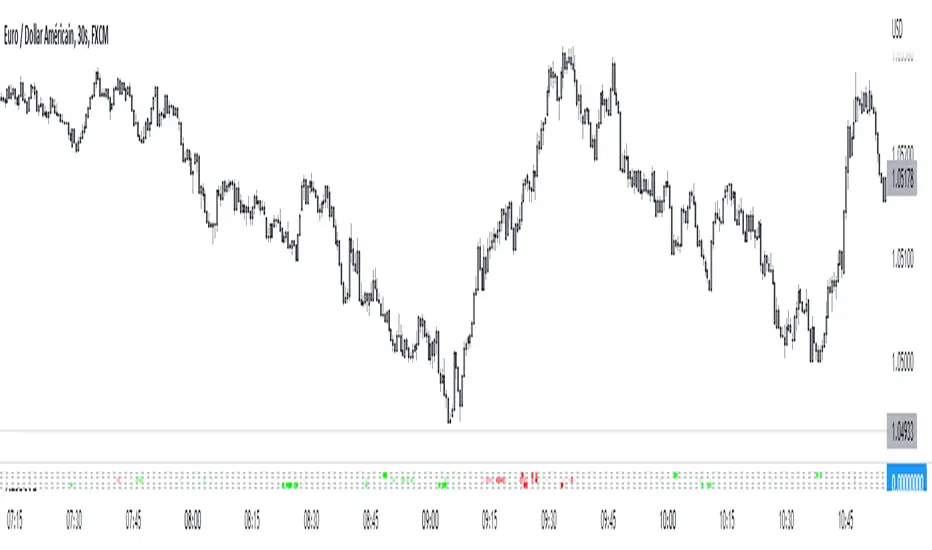
Reversal scoreDynamic divergence indicator on 3 indicators, without delays or repaints
Technological choices have been made so as not to lie to you about the signals, and so that the backtesting is perfectly faithful to reality. The market is analyzed and looks for a dynamic status of divergence on the Fisher transformation, the Money Flow Index and the MACD: if the status is "divergence", it is quantified by a divergence score to assess its potential and whose parameters are multiple (including market structure during divergence status).
At the top Reversal score, at the bottom the divergence indicator integrated in Tradingview. On this last candle, there will indeed be an RSI divergence but which will only be displayed 5 candles later, where ASTRE displays it to you in real time:
You will notice how certain spikes trigger sharp divergence – an anomaly between the movement of the price and that of the indicators is a good sign of an instant reversal, and in m2, a way to take a 2:1 TP in seconds:
Usage tip: Follow the signals in the direction of the main trend! They are much less numerous but very effective! :
Waddah Attar RSI Levels [Loxx]Waddah Attar RSI levels is an indicator created Ahmad Waddah Attar that draws a daily RSI over onto the current lower timeframe chart.
Wilders' RSI:
The Relative Strength Index ( RSI ) is a well versed momentum based oscillator which is used to measure the speed (velocity) as well as the change (magnitude) of directional price movements. Essentially RSI , when graphed, provides a visual mean to monitor both the current, as well as historical, strength and weakness of a particular market. The strength or weakness is based on closing prices over the duration of a specified trading period creating a reliable metric of price and momentum changes. Given the popularity of cash settled instruments (stock indexes) and leveraged financial products (the entire field of derivatives); RSI has proven to be a viable indicator of price movements.
Rapid RSI:
Rapid RSI Indicator, from Ian Copsey's article in the October 2006 issue of Stocks & Commodities magazine. RapidRSI resembles Wilder's RSI , but uses a SMA instead of a WilderMA for internal smoothing of price change accumulators.
Details
-Used for intraday trading, restricted to timeframes 1 hour and below
-Best Time Frames 15, 30, 60 minutes

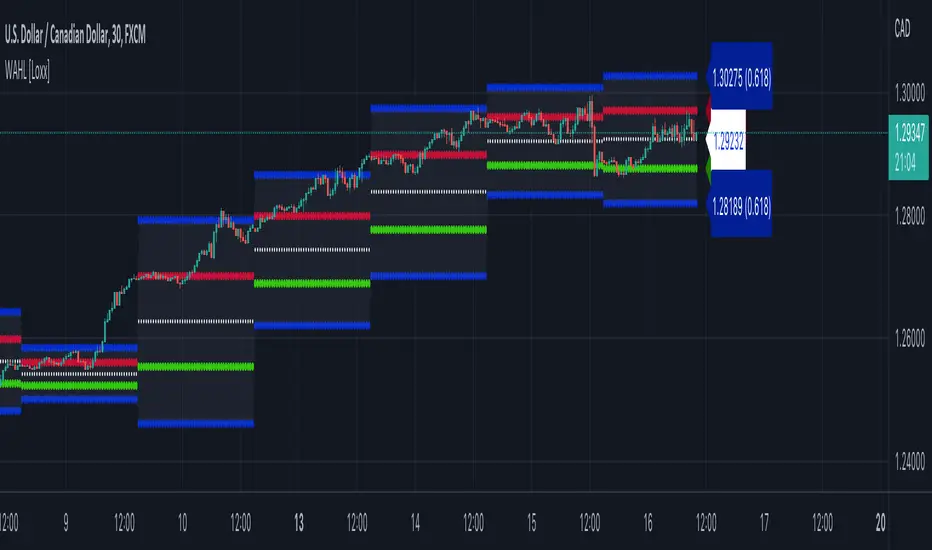
Waddah Attar Hidden Levels [Loxx]Waddah Attar Hidden Levels is a dynamic indicator of support of resistance built by Ahmad Waddah Attar
Details
-Uses data from the Daily time frame only
-Used for intraday trading, restricted to timeframes 1 hour and below
-Best Time Frames 15, 30, 60 minutes
-Draws support and resistance lines on chart inside a boundary of fibonacci levels
How to use Waddah Attar Hidden Levels
-Breakout trading indicator
-Buy at the broken red line, or insert pending buy order
-Sell at the broken green line, or insert pending buy order
-Take profit/Stop-loss at blue lines
JVC_scalp_v1How to use this strategie :
Usable and optimised on a 5-minute chart.
Red background color for short.
Green background color for long.
JVC_SCALP_V1 is a strategy based on the strategy posted by 5mScalpingStrat.
This script uses the following indicators
- L2 Perry Kaufman Adaptative MA ( KAMA )
- Willy 21e13 fixed tsmmob
- EMA 200
- Supertrend M15 to filter false positives
Red background color (sell signal) when the following conditions are met:
- Sell signal blackcat
- Sell zone supertrend M15
- Price < EMA 200 (2 candle close)
- Willy 21e13 output < -90 ou Willy 21e13 EMA < -80
Green background color (buy signal) when the following conditions are met:
- Buy signal blackcat
- Buy zone supertrend M15
- Price > EMA 200 (2 candle close)
- Willy 21e13 output > -10 ou Willy 21e13 EMA > -20
Two levels of colour are proposed according to the value of the output and the EMA.
You can change the settings in the script parameters.
If you find more relevant settings, don't hesitate to contact me so that I can apply an update in the code.

Directional ExpectancyThe Directional Expectancy tool is a volatility based indicator, It is a Directional Correlation to the Volatility given by the Historical Volatility Percentile.
We calculate this correlation function then visually color plot it across a moving average of the HVP.
Use this tool to not only gauge the Historical Volatility that is present as well as the Directional Expectancy of the volatility and price!