Momentum-Based Fair Value Gaps [BackQuant]Momentum-Based Fair Value Gaps
A precision tool that detects Fair Value Gaps and color-codes each zone by momentum, so you can quickly tell which imbalances matter, which are likely to fill, and which may power continuation.
What is a Fair Value Gap
A Fair Value Gap is a 3-candle price imbalance that forms when the middle candle expands fast enough that it leaves a void between candle 1 and candle 3.
Bullish FVG : low > high . This marks a bullish imbalance left beneath price.
Bearish FVG : high < low . This marks a bearish imbalance left above price.
These zones often act as magnets for mean reversion or as fuel for trend continuation when price respects the gap boundary and runs.
Why add momentum
Not all gaps are equal. This script measures momentum with RSI on your chosen source and paints each FVG with a momentum heatmap. Strong-momentum gaps are more likely to hold or propel continuation. Weak-momentum gaps are more likely to fill.
Core Features
Auto FVG Detection with size filters in percent of price.
Momentum Heatmap per gap using RSI with smoothing. Multiple palettes: Gradient, Discrete, Simple, and scientific schemes like Viridis, Plasma, Inferno, Magma, Cividis, Turbo, Jet, plus Red-Green and Blue-White-Red.
Bull and Bear Modes with independent toggles.
Extend Until Filled : keep drawing live to the right until price fully fills the gap.
Auto Remove Filled for a clean chart.
Optional Labels showing the smoothed RSI value stored at the gap’s birth.
RSI-based Filters : only accept bullish gaps when RSI is oversold and bearish gaps when RSI is overbought.
Performance Controls : cap how many FVGs to keep on chart.
Alerts : new bullish or bearish FVG, filled FVG, and extreme RSI FVGs.
How it works
Source for Momentum : choose Returns, Close, or Volume.
Returns computes percent change over a short lookback to focus on impulse quality.
RSI and Smoothing : RSI length and a small SMA smooth the signal to stabilize the color coding.
Gap Scan : each bar checks for a 3-candle bullish or bearish imbalance that also clears your minimum size filter in percent of price.
Heatmap Color : the gap is painted at creation with a color from your palette based on the smoothed RSI value, preserving the momentum signature that formed it.
Lifecycle : if Extend Unfilled is on, the zone projects forward until price fully trades through the far edge. If Auto Remove is on, a filled gap is deleted immediately.
How to use it
Scan for structure : turn on both bullish and bearish FVGs. Start with a moderate Min FVG Size percent to reduce noise. You will see stacked clusters in trends and scattered singletons in chop.
Read the colors : brighter or stronger palette values imply stronger momentum at gap formation. Weakly colored gaps are lower conviction.
Decide bias : bullish FVGs below price suggest demand footprints. Bearish FVGs above price suggest supply footprints. Use the heatmap and RSI value to rank importance.
Choose your playbook :
Mean reversion : target partial or full fills of opposing FVGs that were created on weak momentum or that sit against higher timeframe context.
Trend continuation : look for price to respect the near edge of a strong-momentum FVG, then break away in the direction of the original impulse.
Manage risk : in continuation ideas, invalidation often sits beyond the opposite edge of the active FVG. In reversion ideas, invalidation sits beyond the gap that should attract price.
Two trade playbooks
Continuation - Buy the hold of a bullish FVG
Context uptrend.
A bullish FVG prints with strong RSI color.
Price revisits the top of the gap, holds, and rotates up. Enter on hold or first higher low inside or just above the gap.
Invalidation: below the gap bottom. Targets: prior swing, measured move, or next LV area.
Reversion - Fade a weak bearish FVG toward fill
Context range or fading trend.
A bearish FVG prints with weak RSI color near a completed move.
Price fails to accelerate lower and rotates back into the gap.
Enter toward mid-gap with confirmation.
Invalidation: above gap top. Target: opposite edge for a full fill, or the gap midline for partials.
Key settings
Max FVG Display : memory cap to keep charts fast. Try 30 to 60 on intraday.
Min FVG Size % : sets a quality floor. Start near 0.20 to 0.50 on liquid markets.
RSI Length and Smooth : 14 and 3 are balanced. Increase length for higher timeframe stability.
RSI Source :
Returns : most sensitive to true momentum bursts
Close : traditional.
Volume : uses raw volume impulses to judge footprint strength.
Filter by RSI Extremes : tighten rules so only the most stretched gaps print as signals.
Heatmap Style and Palette : pick a palette with good contrast for your background. Gradient for continuous feel, Discrete for quick zoning, Simple for binary, Palette for scientific schemes.
Extend Unfilled - Auto Remove : choose live projection and cleanup behavior to match your workflow.
Reading the chart
Bullish zones sit beneath price. Respect and hold of the upper boundary suggests demand. Strong green or warm palette tones indicate impulse quality.
Bearish zones sit above price. Respect and hold of the lower boundary suggests supply. Strong red or cool palette tones indicate impulse quality.
Stacking : multiple same-direction gaps stacked in a trend create ladders. Ladders often act as stepping stones for continuation.
Overlapping : opposing gaps overlapping in a small region usually mark a battle zone. Expect chop until one side is absorbed.
Workflow tips
Map higher timeframe trend first. Use lower timeframe FVGs for entries aligned with the higher timeframe bias.
Increase Min FVG Size percent and RSI length for noisy symbols.
Use labels when learning to correlate the RSI numbers with your palette colors.
Combine with VWAP or moving averages for confluence at FVG edges.
If you see repeated fills and refills of the same zone, treat that area as fair value and avoid chasing.
Alerts included
New Bullish FVG
New Bearish FVG
Bullish FVG Filled
Bearish FVG Filled
Extreme Oversold FVG - bullish
Extreme Overbought FVG - bearish
Practical defaults
RSI Length 14, Smooth 3, Source Returns.
Min FVG Size 0.25 percent on liquid majors.
Heatmap Style Gradient, Palette Viridis or Turbo for contrast.
Extend Unfilled on, Auto Remove on for a clean live map.
Notes
This tool does not predict the future. It maps imbalances and momentum so you can frame trades with clearer context, cleaner invalidation, and better ranking of which gaps matter. Use it with risk control and in combination with your broader process.
Scalping

Binary Options Fast Scalping [TradingFinder] M1 & M5 Signals🔵 Introduction
In the structure of financial markets, spiky moments and sudden price movements play a key role in Liquidity Grabs and Market Structure Resets. These movements usually occur after the accumulation of orders in Buy Side or Sell Side Liquidity zones and are accompanied by rapid breaks in the form of Break of Structure (BoS) or Change of Character (CHoCH).
At this stage, the market temporarily moves in the direction of liquidity to trigger counter orders and then enters a Retracement or Pullback phase, a point where professional traders using the Smart Money Concept (SMC) look for candle confirmation to enter with precision.
This strategy is built upon the same logic : an initial spiky move as a signal of institutional or liquidity driven algorithms, followed by a controlled pullback toward areas such as the Order Block, Fair Value Gap (FVG), or Imbalance Zone, and finally an entry based on a strong confirmation candle (Engulf, Rejection, Breaker) that defines the true direction of order flow.
This combination of price behavior, especially on lower timeframes such as M1 or M5, provides an ideal setup for fast Scalping, Micro Structure Trading, and even short term directional prediction in Binary Options Trading.
Since the main focus of this method is on identifying liquidity phases, structural confirmations, and momentum confirmation candles, the trader can design entries with high probability and logical stop loss placement using the concepts of Fractal Market Structure and Multi Timeframe Confirmation.
In the scalping version, the main objective is to capture the move toward the next liquidity pool or opposite demand and supply zone, while in the binary version, only the prediction of the next candle’s direction matters. This strategy inherently operates based on Smart Money Behavior, Liquidity Engineering, and Order Flow Dynamics, allowing the extraction of fast and profitable moves from the internal logic of market structure.
🔵 How to Use
The operational logic of this strategy is based on Liquidity Sweep, Pullback, and Confirmation Candle. The trader should first identify the initial Impulse Move, which is often accompanied by liquidity absorption around Buy Side or Sell Side Liquidity areas. After that, the market enters the Retracement phase and returns to structural zones such as the Order Block or the Fair Value Gap (FVG).
At this point, a position is taken only when a confirmation candle (Engulf, Breaker, or Rejection Candle) closes in the direction of continuation and aligns with the new structure (BOS or CHoCH). Applying this model on lower timeframes offers the highest precision for fast Scalping or for predicting the next candle’s direction in Binary Option trading.
🟣 Bullish Setup
In the bullish setup, the market first forms a spiky upward move with a sudden increase in momentum, indicating the activation of liquidity flow in the Buy Side Liquidity zone. This movement is usually accompanied by a Break of Structure (BOS) to the upside and marks the beginning of the Impulse Move phase. After this move, the price enters the Pullback phase and returns to structural areas such as the Bullish Order Block, Fair Value Gap (FVG), or Mitigation zone.
At this stage, the trader waits for a bullish confirmation candle (Bullish Engulf or Breaker Candle) to validate the end of the retracement. Entry is made at the close of the confirmation candle or on a minor pullback, with the stop loss placed below the Swing Low or below the pullback zone. The target is set at the next Buy Side Liquidity or Equal Highs. In the binary version, only the direction of the next candle matters and the entry takes place immediately after the confirmation candle.
🟣 Bearish Setup
In the bearish setup, the market first forms a spiky downward move, signaling increased selling pressure and liquidity absorption at the Sell Side Liquidity zone. This movement is accompanied by a Break of Structure (BOS) to the downside and represents the beginning of a bearish momentum phase. After the spike, the price enters the Retracement phase and returns to the Bearish Order Block or bearish Fair Value Gap zone. Within these areas, the formation of a bearish confirmation candle (Bearish Engulf, Breaker, or Rejection Candle) validates the continuation of the downtrend.
The entry is taken at the close of the confirmation candle, with the stop loss placed above the Swing High or above the pullback zone, and the target set toward the next Sell Side Liquidity or Equal Lows. In binary applications, only the direction of the next candle is considered and the confirmation candle serves as the entry trigger.
🔵 Conclusion
This strategy, by combining the principles of the Smart Money Concept, Liquidity Dynamics, and Candle Confirmation Logic, offers a precise and multi functional approach to market entry. Its core structure, identifying the initial spiky movement, waiting for a structural pullback, and entering based on a confirmation candle allows quick interpretation of institutional liquidity behavior and provides trading opportunities with high accuracy and controlled risk.
On lower timeframes, this logic becomes a powerful tool for Scalping and Micro Structure Trading, while in binary markets it delivers high success rates due to its focus on predicting the next candle’s direction. Built upon the foundations of Order Flow, Market Structure, and Fractal Liquidity Behavior, this strategy demonstrates that even in the fastest and noisiest market conditions, the order of Smart Money remains observable and exploitable.

Friday & Monday HighlighterFriday & Monday Institutional Range Marker — Know Where Big Firms Set the Trap!
🧠 Description
This indicator automatically highlights Friday and Monday sessions on your chart — days when institutional players and algorithmic firms (like Citadel, Jane Street, or Tower Research) quietly shape the upcoming week’s price structure.
🔍 Why Friday & Monday matter
Friday : Large institutions often book profits or hedge into the weekend. Their final-hour moves reveal the next week’s bias.
Monday : Big players rebuild positions, absorbing liquidity left behind by retail traders.
Together, these two days define the range traps and breakout zones that often control price action until midweek.
> In short, the Friday–Monday high and low often act as invisible walls — guiding scalpers, option sellers, and swing traders alike.
🧩 What this tool does
✅ Highlights Friday (red) and Monday (green) sessions
✅ Adds optional day labels above bars
✅ Works across all timeframes (best on 15min to 1hr charts)
✅ Helps you visually identify where institutions likely built their positions
Use it to quickly spot:
* Range boundaries that trap traders
* Gap zones likely to get filled
* High–low sweeps before reversals
⚙️ Recommended Use
1. Mark Friday’s high–low → Watch for liquidity sweeps on Monday.
2. When Monday holds above Friday’s high , breakout continuation is likely.
3. When Monday fails below Friday’s low , expect a reversal or trap.
4. Combine this with OI shifts, IV crush, and FII–DII flow data for confirmation.
⚠️ Disclaimer
This indicator is for **educational and analytical purposes only**.
It does **not constitute financial advice** or a trading signal.
Markets are dynamic — always perform your own research before trading or investing.

AnchorPulse RWAP Universal ScalperWhat it is
AnchorPulse Scalper is an intraday indicator that reads price in real time through three ideas working together.
A live pivot engine that detects the current micro leg.
An Anchored Range Weighted Average Price that starts at each new leg or session.
An adaptive rhythm score that communicates a simple bias: Buy, Sell, or Wait.
The goal is clarity. You get one anchor line, soft bands that show stretch, discrete Buy and Sell marks, and a plain-language dashboard that says Trend, Phase, Bias, Momentum, Volatility, Stretch, ETA to next turn, and Regime. No external dependencies and no lookahead. It is designed for standard chart types on one to five minute timeframes across liquid symbols such as major FX, index futures, large cap stocks, and mainstream crypto pairs.
What makes it original
Most scalpers either track a fixed moving average or draw from a session VWAP. AnchorPulse does neither. The anchor resets at every new micro leg detected by a real time pivot engine that measures distance in units of ATR rather than in fixed points. This produces a responsive anchor that updates only when the market proves a leg has turned. On top of that, the rhythm timer keeps an average of how long legs usually last, so the indicator can treat the start and the end of a leg differently. Early in a leg it favors continuation signals. Late in a leg it watches for mean reversion. This mix of an ATR-based leg detector, a leg-anchored RWAP, and a rhythm aware bias is the core originality.
Plain explanation of the calculations
Pivot engine. While price travels up, the script tracks the highest high reached since the last pivot. If price pulls back from that extreme by at least a user defined fraction of ATR, the leg flips down. The reverse applies to down legs. The distance threshold is adaptive because ATR changes with volatility. A short cooldown in bars can prevent double flips on violent bars.
Anchored Range Weighted Average Price. From the first bar of each new leg the script accumulates a weighted average of the typical price, where the weight is the true range of each bar. The anchor can also reset at the start of a session and can ignore the very first session bar to avoid overweighting the open gap.
Progress and phase. The script measures how far price traveled from the last pivot relative to the reversal threshold. That is progress. At the same time it maintains an exponential average of leg duration in bars. The current leg age divided by that average is the age ratio. An age ratio below an adaptive early threshold means Early. Above an adaptive late threshold means Late. The thresholds drift with recent variability in leg length so they match the rhythm of the market.
Wick pressure and intrabar skew. Lower wick minus upper wick, normalized by ATR and smoothed, acts as tape pressure. The sign of close minus open, smoothed, is intrabar skew. They are combined into a compact momentum read.
Bands and stretch. The script computes the deviation of typical price from the anchor and builds soft bands around the anchor. Standard deviation is capped by a multiple of mean absolute error to avoid inflated bands just after a pivot.
Regime filter. You may optionally gate continuation entries when the higher timeframe EMA disagrees, or gate reversals when ADX shows strong trend.
Adaptive edge score. Progress and momentum are turned into percentile scores using a normal CDF of their rolling z scores. This yields a familiar zero to one hundred scale that is easier to read than raw values. Early in an up leg adds a small bonus to long bias. Early in a down leg adds a small bonus to short bias.
Gap cap. Signals are rejected if price is too far from the anchor. The cap is expressed as a fraction of price, which scales across symbols.
What you see on the chart
One white anchor line. Two transparent bands. Subtle green or orange background when a bias is active. Buy marks below bars and Sell marks above bars. Small triangles at pivots. Bar tint softly aligned with momentum. A compact table in the corner that tells you the state in plain language. On alert, a single JSON line can be sent to your alert channel with ticker, timeframe, trend, phase, bias, edge score, stretch, ETA in bars, and regime note.
How to use it in practice
Choose a liquid symbol and a one to five minute timeframe.
Keep the mode on Hybrid until you learn the personality of the market. If you notice long directional pushes, try Continuation mode. If you see frequent fades near the end of legs, try Reversal mode.
Read the table. Trend shows Up or Down according to the current leg. Phase shows Early, Mid, or Late from the rhythm timer. Bias shows Buy, Sell, or Wait once the signal rules and the gap cap are satisfied. Momentum reads Strong Up, Neutral, or Strong Down from wick pressure and skew. Volatility shows Calm, Average, or Wild relative to an ATR baseline. Stretch vs anchor prints the distance between close and the anchor as a percent of price. ETA shows how many bars remain to the average leg length if such a read is meaningful. Regime reflects the optional gate: None, HTF Up, HTF Down, Strong, or Soft.
Focus on the anchor. Continuation longs are stronger when price holds above the anchor in the first part of an up leg with positive momentum and adequate progress. Continuation shorts are the mirror case below the anchor. Reversal longs are stronger when a down leg is late, price crosses the anchor, and momentum flips positive. Reversal shorts are the mirror case in late up legs.
Respect the gap cap. When price is stretched far away from the anchor, skip signals and wait for re-alignment or a fresh leg.
Keep the chart clean. The script is designed to work on its own. If you add other tools, make sure they do not paint multiple backgrounds or heavy drawings that obscure the anchor and the bands.
Inputs explained with practical defaults
The script ships with sensible defaults and all inputs provide tooltips inside the indicator. The description here is included so traders who do not read code can still understand how to tune it.
Signal mode. Continuation uses early leg logic. Reversal uses late leg logic at anchor crosses. Hybrid allows both and lets the edge score decide.
ATR length and Pivot reversal in ATR. These govern flips. Shorter ATR and smaller reversal multiples yield faster turns and more signals. Longer and larger do the opposite. A middle ground such as ATR 50 with reversal 0.75 often reads well across liquid markets.
Rhythm smoothing length and Freeze bars after flip. The first sets how quickly the average leg length adapts. The second prevents double flips on wide bars. Values around 20 and 1 to 3 bars work well for most symbols.
Session hours, Session reset, and Skip first session bar. These are optional. Day sessions in equities can benefit from a reset and from skipping the first bar so the anchor is not dragged by the open gap. Round the session to your venue.
Wick pressure length and Intrabar skew length. They control how quickly the micro momentum reacts. Values between 6 and 12 for wick pressure and 4 to 10 for skew are common.
Early and Late thresholds and the Adaptive option. If you turn adaptation on, the thresholds drift with leg variability. The adaptiveness setting controls the strength of that drift.
Minimum progress and Maximum stretch vs anchor. The first ensures that continuation signals only occur once the leg moved a minimum distance from the last pivot. The second prevents chasing far from the anchor. As a rule, raise minimum progress when the market chops and reduce it on trend days. Keep stretch around one to two percent for many symbols, then adjust by product.
Regime filter. Higher timeframe EMA supports trend alignment. ADX supports a simple read on the strength of trend. Use one at a time or none, depending on your preference.
Adaptive scoring lookback. The percentile logic needs a modest window. Values near one hundred twenty bars tend to give stable ranks without lagging too much.
Band settings. Band length and width control the look of the soft channel around the anchor. The cap versus mean absolute error is there to keep the bands realistic just after flips.
Visual controls. Pick labels, triangles, or circles, and choose to mark only state changes if you prefer a very clean chart.
Why the dashboard uses plain language
Many traders prefer to reason in simple terms rather than in raw values. The table abstracts the math into natural categories such as Early versus Late, Calm versus Wild, or Strong Up versus Strong Down. The only numeric reads are Stretch and Edge score because these help in threshold decisions. Stretch is a percent of price so it scales across markets. Edge is a normalized score from zero to one hundred that reflects the combined progress, momentum, and phase. The table is intended to be the only element you need to glance at during a fast session once you learn the anchor and the band cues.
Design choices and integrity
No repaint. The script uses bar closes and standard Pine semantics with lookahead off in security calls. There are no offset tricks that move plotted values after the fact.
One background painter. Background tint is created by a single call to avoid vertical stripes.
Reset logic is explicit. The anchor resets at a pivot or at session start if that option is enabled. This is written to be transparent so you know why the anchor restarted.
Conservative defaults. Out of the box, the script is not tuned to over trade. It communicates bias rather than forcing entries.
Clean chart guidance. The tool is meant to be used on standard bars or candles. It is not intended for synthetic chart types such as Heikin Ashi, Renko, Kagi, Point and Figure, or Range for the purpose of signal generation.
How to read a few common situations
Breakout with strong follow through. Trend reads Up. Phase reads Early. Momentum reads Strong Up. Stretch sits inside the band. Bias shows Buy. This is the typical continuation long.
Extended push into exhaustion. Trend reads Up. Phase reads Late. Momentum cools. Stretch prints a high positive percent of price. Bias flips to Wait, sometimes to Sell after an anchor cross. This is the potential reversal short.
Mean reverting chop. Trend flips often. Phase hangs around Mid. Momentum flips sign frequently. Stretch hovers near zero. Bias often prints Wait. In this case you let the market speak and only act when the leg matures or when stretch spikes away from the anchor.
Trend day with strength. ADX filter reads Strong. Continuation is allowed. Reversal attempts are blocked. Bias favors the dominant direction.
Session open. If you selected a session reset and chose to skip the first bar, the anchor starts at the second bar and the first prints do not dominate the anchor.
Limits and realistic expectations
This indicator measures leg structure and micro pressure to suggest a bias. It is not a self-contained trading system. It does not size positions, pick stops, or set take profits. It does not promise accuracy or profits. In violent markets the pivot detector can flip and then flip back. Cooldown reduces this effect but cannot remove it. During news and illiquid hours the anchor can move very quickly. Wide slippage and spread can make any intraday approach impractical. These are standard realities of intraday trading and they also apply here.
Suggested workflows
Discretionary scalper. Keep the chart clean. Use the table to decide whether to engage, then work entries at the anchor or inside the band. Focus on position risk and a predefined stop level independent of the script.
Session specialist. If you trade a venue with strong sessions such as US equities or major FX sessions, enable the session reset. Many traders find the tool shines in the first two hours and the last hour of an active session.
Multi timeframe monitor. Keep AnchorPulse on one to five minutes and a simple higher timeframe EMA on a separate chart. If you prefer a single chart, switch the regime filter to HTF Trend and let the indicator handle it.
Alert driven workflow. Create alerts on Buy or Sell. The payload contains the essential context so you can log and review. Use the payload fields to build a small notebook of cases you like to take.
Why it is published as protected
The script contains original logic that relies on a compact set of calculations not commonly seen together. Publishing as protected keeps the logic intact while still giving the community full access through the Public Library.
Frequently asked questions
Does it repaint
No. The pivot flips on confirmed bars using ATR distance. The anchor, bands, and dashboard read from that state and do not shift after the bar closes.
What settings should I change first
Try the reversal distance in ATR and the minimum progress. These two govern how active or selective the tool becomes. If you see too many flips, raise the ATR multiple or the freeze bars. If you want faster action, lower them slightly.
What is a reasonable stretch cap
One to two percent of price is a useful starting point for many symbols. Thin products may need a larger cap. Extremely liquid products can often work with a smaller cap.
Should I use the regime filter
On days with persistent trend, the higher timeframe EMA filter or the ADX filter can help keep you with the flow. On rotational days, consider turning the filter off to allow more two sided action.
Can I use it on higher timeframes
The logic works on any timeframe, but the design and defaults target one to five minutes. If you go higher, adjust the ATR length, reversal distance, and rank lookback accordingly.
Can I combine it with volume
Yes. A simple volume filter that marks above average volume near the anchor can help you time entries. Keep the chart readable.
Risk notice and user responsibility
This indicator is a tool for research and education. It does not give investment advice, trade recommendations, or any guarantee of outcomes. All trading carries risk including the loss of capital. Past performance is not a reliable guide to future results. You are solely responsible for your trading decisions, for verifying that the indicator behaves as you expect on your data and platform settings, and for selecting appropriate risk controls such as position sizing, stops, and loss limits.
Summary
AnchorPulse Scalper is a concise way to read the market’s current leg, its anchor, and its rhythm. The pivot engine tells you direction. The leg-anchored RWAP shows where value sits for this micro move. The adaptive score simplifies momentum and progress into a familiar scale. The dashboard translates complex calculations into the plain words that scalpers actually use. If you prefer simple signals, enable alerts and let them flow into your log. If you prefer context, watch the anchor and bands as the leg evolves and let the rhythm guide your timing. Use it respectfully on a clean chart, stay realistic, and keep your own rules for risk.

Session Breakout Detector (SBD)Overview:
The Session Breakout Detector (SBD) is a TradingView indicator designed to identify and visualize breakouts from major trading sessions. It tracks a selected session (Tokyo, London, or New York) and detects price movements beyond the session's high or low, assisting traders in spotting potential breakout opportunities.
Key Features:
- Session Selection: Choose between Tokyo, London, or New York sessions.
- Breakout Detection Modes:
- Confirmed Bar: Detects breakouts when a candle closes beyond the session's range.
- Intrabar: Detects breakouts as soon as the price exceeds the session's high or low within a
candle.
- Visual Indicators:
- Displays session high, low, and range with a colored box for clear visualization.
- Marks breakouts with green (bullish) or red (bearish) triangles.
- Optional 50-Period SMA: Adds a 50-period Simple Moving Average to the chart for trend
analysis.
- Alerts: Configurable alerts for bullish and bearish breakouts.
Usage Instructions:
1. Select Session: Choose the desired trading session (Tokyo, London, or New York) from the
input settings.
2. Choose Breakout Detection Mode: Select between 'By confirmed bar' or 'By intrabars' based
on your trading preference.
3. Enable SMA (Optional): Toggle the 'Use SMA?' option to display the 50-period Simple Moving
Average.
4. Set Alerts: Configure alerts for breakout signals as per your trading strategy.
⚠️Note: This indicator is intended for informational purposes only and should not be construed as financial advice. Users are encouraged to conduct their own research and consider their individual risk tolerance before making trading decisions.

MACD cross over Buy/SellThis Indicator is purely on buying and selling the Script based on the MACD crossover Signals, which can be used for Scalping and finding the trend of the script for short and long term. When the MACD Line crosses the Signal line upwards, the script will move towards higher, and will move towards Lower when it crosses downwards. It's simple. Particularly, when the MACD line Crosses above the zero line after crossing the Signal line, the momentum will be high. Whereas when the MACD line Crosses below the zero line after crossing the Signal line downward, the momentum of falling will be high.

GOLDSNIPERThe Gold Sniper Indicator is a precision trading tool designed specifically for scalping and intraday trading Gold (XAUUSD) on TradingView.
It automatically plots institutional key levels, detects breakout & retest opportunities, and provides trade management levels (Stop Loss & Take Profit) for structured, disciplined trading.
Aug 6
Release Notes
The Gold Sniper Indicator is a precision trading tool designed specifically for scalping and intraday trading Gold (XAUUSD) on TradingView.
It automatically plots institutional key levels, detects breakout & retest opportunities, and provides trade management levels (Stop Loss & Take Profit) for structured, disciplined trading
Aug 13
Release Notes
The Gold Sniper Indicator is a precision trading tool designed specifically for scalping and intraday trading Gold (XAUUSD) on TradingView.
It automatically plots institutional key levels, detects breakout & retest opportunities, and provides trade management levels (Stop Loss & Take Profit) for structured, disciplined trading.
3 days ago
Release Notes
The Gold Sniper Indicator is a precision TradingView tool for scalping and intraday trading Gold (XAUUSD).
It is built around a break-and-retest strategy with clear trade management: 10 pip Stop Loss, 20 pip TP1, and 35 pip TP2.
The indicator automatically:
• Plots institutional key levels and supply & demand zones
• Detects breakout and retest opportunities in real time
• Provides stop loss and take profit levels for structured, disciplined trading
Whether you’re a scalper or day trader, Gold Sniper helps you catch high-probability setups on XAUUSD with precise risk-to-reward ratios (1:1 and 1:3).

TrendLock Pro 2 — Dual Trend Confirmation📊 TrendLock Pro 2 — Dual Trend Confirmation
🔒 Trade only when the trend is locked and confirmed
TrendLock Pro is a professional no-repaint indicator designed for traders who want to cut through market noise and only capture validated opportunities.
It combines two powerful filters:
TrendScope (current timeframe) → fast detection of momentum shifts through an intelligent RSI setup.
Flow Guard (higher timeframe) → directional filter that only confirms trades aligned with the macro trend.
👉 The result: you only enter when both trends agree , ensuring dual validation before every trade.
🚀 Key Features
✅ No Repaint : signals remain reliable once printed.
✅ Dual Validation : micro-trend (M1, M5…) confirmed by the macro-trend (M15, M30…).
✅ Smart Filters : reduces false signals against the main trend.
✅ Versatile : ideal for M1 scalping, intraday trading, or swing setups.
✅ Built-in Alerts : get notified only when confirmation is strong.
✅ Clear Visuals : green diamonds for confirmed LONGs, red diamonds for confirmed SHORTs.
🎯 Who is it for?
Scalpers seeking safer entries.
Day traders looking to avoid counter-trend traps.
Swing traders preferring cleaner, filtered setups.
💡 Usage Tips
📉 Using Heikin Ashi candles smooths signals and makes them easier to read.
🛡️ Always place your Stop Loss wisely: the indicator doesn’t predict the future but analyzes real-time multi-timeframe trends.
🎯 Avoid being too greedy with Take Profits — aim for balanced targets to maintain a strong win rate.
⚡ Two trends, one signal. Trade with confirmation.

Fisher Transform Trend Navigator [QuantAlgo]🟢 Overview
The Fisher Transform Trend Navigator applies a logarithmic transformation to normalize price data into a Gaussian distribution, then combines this with volatility-adaptive thresholds to create a trend detection system. This mathematical approach helps traders identify high-probability trend changes and reversal points while filtering market noise in the ever-changing volatility conditions.
🟢 How It Works
The indicator's foundation begins with price normalization, where recent price action is scaled to a bounded range between -1 and +1:
highestHigh = ta.highest(priceSource, fisherPeriod)
lowestLow = ta.lowest(priceSource, fisherPeriod)
value1 = highestHigh != lowestLow ? 2 * (priceSource - lowestLow) / (highestHigh - lowestLow) - 1 : 0
value1 := math.max(-0.999, math.min(0.999, value1))
This normalized value then passes through the Fisher Transform calculation, which applies a logarithmic function to convert the data into a Gaussian normal distribution that naturally amplifies price extremes and turning points:
fisherTransform = 0.5 * math.log((1 + value1) / (1 - value1))
smoothedFisher = ta.ema(fisherTransform, fisherSmoothing)
The smoothed Fisher signal is then integrated with an exponential moving average to create a hybrid trend line that balances statistical precision with price-following behavior:
baseTrend = ta.ema(close, basePeriod)
fisherAdjustment = smoothedFisher * fisherSensitivity * close
fisherTrend = baseTrend + fisherAdjustment
To filter out false signals and adapt to market conditions, the system calculates dynamic threshold bands using volatility measurements:
dynamicRange = ta.atr(volatilityPeriod)
threshold = dynamicRange * volatilityMultiplier
upperThreshold = fisherTrend + threshold
lowerThreshold = fisherTrend - threshold
When price momentum pushes through these thresholds, the trend line locks onto the new level and maintains direction until the opposite threshold is breached:
if upperThreshold < trendLine
trendLine := upperThreshold
if lowerThreshold > trendLine
trendLine := lowerThreshold
🟢 Signal Interpretation
Bullish Candles (Green): indicate normalized price distribution favoring bulls with sustained buying momentum = Long/Buy opportunities
Bearish Candles (Red): indicate normalized price distribution favoring bears with sustained selling pressure = Short/Sell opportunities
Upper Band Zone: Area above middle level indicating statistically elevated trend strength with potential overbought conditions approaching mean reversion zones
Lower Band Zone: Area below middle level indicating statistically depressed trend strength with potential oversold conditions approaching mean reversion zones
Built-in Alert System: Automated notifications trigger when bullish or bearish states change, allowing you to act on significant developments without constantly monitoring the charts
Candle Coloring: Optional feature applies trend colors to price bars for visual consistency and clarity
Configuration Presets: Three parameter sets available - Default (balanced settings), Scalping (faster response with higher sensitivity), and Swing Trading (slower response with enhanced smoothing)
Color Customization: Four color schemes including Classic, Aqua, Cosmic, and Custom options for personalized chart aesthetics

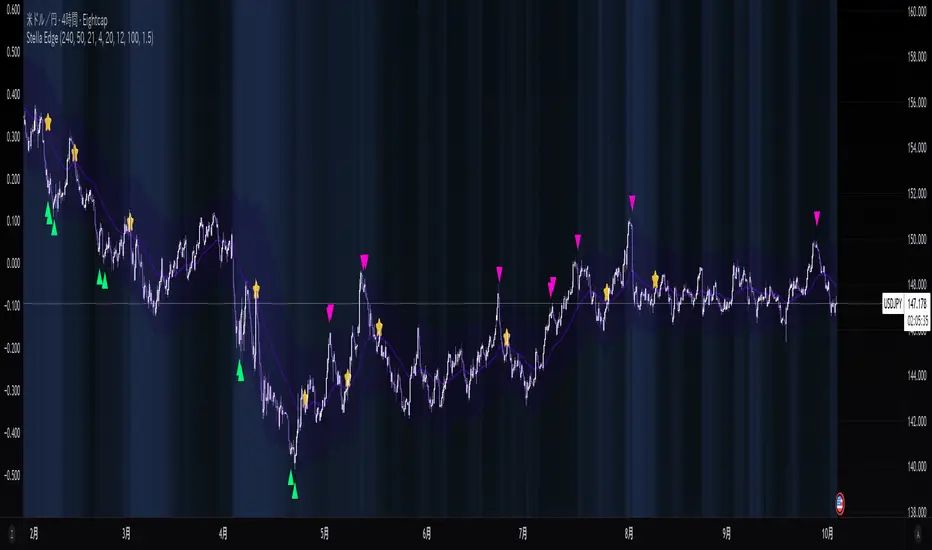
Stella Edge|SuperFundedStella Edge — Quick Guide
What it is
Stella Edge is a higher-timeframe (HTF) EMA + ATR channel with adaptive zones, a volatility hazard filter, and clean entry/exit cues. It projects an HTF EMA with ATR bands, paints a calm-to-active “aurora” background using normalized ATR, and marks:
・Long cue when price crosses up into/through the lower band (potential buy zone).
・Short cue when price crosses down into/through the upper band (potential sell zone).
・Take-profit star when price crosses back through the HTF EMA against your active direction.
・Skull marker on extreme volatility bars (ATR & Volume spikes) to warn of unstable conditions.
Why this is not a simple mashup
・HTF regime first: Instead of reacting to local noise, entries are contextualized by an HTF EMA±ATR envelope (request.security) that frames price with structural zones (upper = supply bias, lower = demand bias).
・Risk-aware gating: A dual-threshold volatility filter flags bars where true range and volume spike far above their baselines—conditions that often degrade signal quality.
・Signal hygiene: Cross checks use band values from the prior bar to reduce duplicate/ambiguous triggers when HTF data updates, yielding cleaner, fewer, higher-quality icons.
・Visual cognition: The aurora background blends two night tones by the percent-rank of HTF ATR, so your eye immediately senses regime intensity without reading numbers.
How it works (concise)
1. Pull HTF EMA(len) and HTF ATR(len) via request.security.
2. Compute upper/lower bands = EMA ± ATR×multiplier (projected continuously).
3. Aurora mode: Normalize HTF ATR by 200-bar percent-rank and map it to a calm→active gradient for background.
4. Signals
・Long when close crosses up the lowerBand .
・Short when close crosses down the upperBand .
・Track tradeDirection and print a ⭐️ when price crosses the HTF EMA against the current direction (TP cue).
5. Volatility hazard (optional): Flag bars where
・TR ≥ ATR(avg, N) × multiplier and
・Volume ≥ SMA(volume, M) × multiplier.
These get a 💀 label so you can avoid forced entries/exits during disorderly bursts.
Parameters (UI mapping)
Higher-Timeframe & Core
・Higher TF for EMA/ATR: HTF used by request.security (e.g., 60).
・EMA Length (HTF): HTF EMA period.
・ATR Length (HTF): HTF ATR period.
・ATR Multiplier: Band width.
・Aurora mode: Toggle dynamic background (ATR-based gradient).
Volatility Filter (Volatility Filter group)
・Enable Extreme Volatility Filter?: On/off.
・ATR Period / ATR Spike Multiplier: Bar is “extreme” if TR ≥ ATR×multiplier.
・Volume MA Period / Volume Spike Multiplier: “Extreme” also requires Volume ≥ SMA×multiplier.
Signal Settings
・Long Arrow Color / Short Arrow Color: Icon colors for long/short cues.
Practical usage
・Plan around the HTF envelope:
・Below lower band → price may be stretched into demand zone (look for long cue & reaction).
・Above upper band → stretched into supply zone (look for short cue & reaction).
・Confirmation: Treat arrows as triggers, not commands. Favor entry when you also see reaction candles (rejection wicks, engulfings) or micro-structure alignment.
・Exit discipline: The ⭐️ on EMA cross-back is a simple, mechanical TP. You can scale out earlier using fixed R-multiples or prior swing levels.
・Hazard bars: Avoid initiating on 💀 bars; widen stops or step aside until volatility normalizes.
・Clutter control: If zones feel too reactive, raise HTF (e.g., 120/240) or increase ATR Length/Multiplier for broader, slower bands.
Repainting & HTF notes
・HTF series from request.security are final only when the HTF bar closes. Using upperBand /lowerBand for crosses helps reduce duplicate/early prints, but intrabar behavior on the current HTF bar can still evolve. Evaluate on closed bars for strict confirmation.
Best markets & timeframes
・Pairs/indices/crypto where trend–pullback cycles are common.
・Start with entry TF = your usual trading TF (e.g., 5m–1h) and HTF = 3–12× that TF (e.g., 60/120/240).
・For BTC/Gold or newsy assets, prefer higher HTF and the volatility filter ON.
Disclaimer
This tool identifies zones and timing cues; it does not guarantee outcomes. News shocks and liquidity gaps can invalidate any setup. Always size positions prudently and trade at your own risk.
SuperFunded invite-only
To obtain access, please DM me on TradingView or use the link in my profile.
Stella Edge — クイックガイド(日本語)
概要
Stella Edgeは、上位足EMA±ATRバンドで相場をフレーミングし、アダプティブな買い/売りゾーン、極端なボラティリティ警告、そしてシンプルなエントリー/利確キューを提供するインジです。
・ロング:価格が Lower Bandを上抜けたタイミングで矢印。
・ショート:価格が Upper Bandを下抜けたタイミングで矢印。
・利確⭐️:建玉方向に対して価格が HTF EMA を逆行クロスしたら表示。
・💀警告:ATRと出来高が同時スパイクした「危険」バーを明示。
・背景はHTF ATRのパーセントランクで静→動にグラデーションする「オーロラ」表現。
独自性・新規性
・上位足の構造を先に定義(EMA±ATR)→そこへ戻る/抜ける動きだけを狙うため、ノイズを減らした文脈型の判断が可能。
・二重スパイク条件(TR×ATR基準+出来高×SMA基準)で、荒れ相場のエントリー回避を支援。
・シグナルの重複・不安定を抑制、見やすい最小限のアイコンに整理。
・視覚設計としてATRの相対的な強度を背景で可視化し、一目で局面認識。
使い方のヒント
・ゾーンは押し目/戻り目の候補。矢印はトリガーとして扱い、ローソクの反応(ピンバー/包み足など)で確認してから入る。
・⭐️は機械的TPの目安。スケールアウトやR倍数での利確も併用可。
・💀が出た足での新規は原則回避。HTFを上げるとゾーンはより鈍感=落ち着いた絵に。
・HTF更新の注意:上位足バー確定までは値が変化し得ます。確定足ベースで検証するのが安全。
免責
本ツールは反発や到達を保証しません。イベントや流動性によって機能しないことがあります。資金管理のもと自己責任でご利用ください。
SuperFunded 招待専用スクリプト
このスクリプトはSuperFundedの参加者専用です。アクセスをご希望の方は、SuperFundedにご登録のメールアドレスから partner@superfunded.com 宛に、TradingViewの登録名をご送信ください。
Laguerre Filter Trend Navigator [QuantAlgo]🟢 Overview
The Laguerre Filter Trend Navigator employs advanced polynomial filtering mathematics to smooth price data while minimizing lag, creating a responsive yet stable trend-following system. Unlike simple moving averages that apply equal weight to historical data, the Laguerre filter uses recursive calculations with exponentially weighted polynomials to extract meaningful directional signals from noisy market conditions. Combined with dynamic volatility-adjusted boundaries, this creates an adaptive framework for identifying high-probability trend reversals and continuations across all tradable instruments and timeframes.
🟢 How It Works
The indicator leverages Laguerre polynomial filtering, a mathematical technique originally developed for digital signal processing applications. The core mechanism processes price data through four cascaded filter stages (L0, L1, L2, L3), each applying the gamma coefficient to recursively smooth incoming information while preserving phase relationships. This multi-stage architecture eliminates random fluctuations more effectively than traditional moving averages while responding quickly to genuine directional shifts.
The gamma coefficient serves as the primary smoothing control, determining how aggressively the filter dampens noise versus tracking price movements. Lower gamma values reduce smoothing and increase filter responsiveness, while higher values prioritize stability over reaction speed. Each filter stage compounds this effect, creating progressively smoother output that converges toward true underlying trend direction.
Surrounding the filtered price line, the algorithm constructs adaptive boundaries using dynamic volatility regime measurements. These calculations quantify current market turbulence independently of direction, expanding during active trading periods and contracting during quiet phases. By multiplying this volatility assessment by a user-defined scaling factor, the system creates self-adjusting bands that automatically conform to changing market conditions without manual intervention.
The trend-following engine monitors price position relative to these volatility-adjusted boundaries. When the upper band falls below the current trend line, the system shifts downward to track bearish momentum. Conversely, when the lower band rises above the trend line, it elevates to follow bullish movement. These crossover events trigger color transitions between bullish (green) and bearish (red) states, providing clear visual confirmation of directional changes validated by volatility-normalized thresholds.
🟢 How to Use
Green/Bullish Trend Line: Laguerre filter positioned in upward trajectory, indicating momentum-confirmed conditions favorable for establishing or maintaining long positions (buy)
Red/Bearish Trend Line: Laguerre filter trending downward, signaling regime-validated environment suitable for initiating or holding short positions (sell)
Rising Green Line: Accelerating bullish filter with expanding separation from price lows, demonstrating strengthening upward momentum and increasing confidence in trend persistence with optimal long entry timing
Declining Red Line: Steepening bearish filter creating growing distance from price highs, revealing intensifying downside pressure and enhanced probability of continued decline with favorable short positioning opportunities
Flattening Trends: Horizontal or oscillating filter movement regardless of color suggests directional uncertainty where price action contradicts filter positioning, potentially indicating consolidation phases or impending volatility expansion requiring cautious trade management
🟢 Pro Tips for Trading and Investing
→ Preset Selection Framework: Match presets to your trading style - Scalping preset employs aggressive gamma (0.4) with tight volatility bands (1.0x) for rapid signal generation on sub-15-minute charts, Day Trading preset balances responsiveness and stability for hourly timeframes, while Swing Trading preset maximizes smoothing (0.8 gamma) with wide bands (2.5x) to filter intraday noise on daily and weekly charts.
→ Gamma Coefficient Calibration: Adjust gamma based on market personality - reduce values (0.3-0.5) for highly liquid, fast-moving assets like major currency pairs and tech stocks where quick filter adaptation prevents lag-induced losses, increase values (0.7-0.9) for slower instruments or trending markets where excessive sensitivity generates false reversals and whipsaw trades.
→ Volatility Period Optimization: Tailor the volatility measurement window to information cycles. Deploy shorter lookback periods (7-10) for instruments with rapid regime changes like individual equities during earnings seasons, standard periods (14-20) for balanced assessment across general market conditions, and extended periods (21-30) for commodities and indices exhibiting persistent volatility characteristics.
→ Band Width Multiplier Adaptation: Scale boundary distance to current market phase. Contract multipliers (1.0-1.5) during range-bound consolidations to capture early breakout signals as soon as genuine momentum emerges, expand multipliers (2.0-3.0) during trending markets or high-volatility events to avoid premature exits caused by normal retracement activity rather than authentic reversals.
→ Multi-Timeframe Filter Alignment: Implement the indicator across multiple timeframes, using higher intervals (4H/Daily) to identify primary trend direction via filter slope and lower intervals (15min/1H) for precision entry timing when filter colors align, ensuring trades flow with dominant momentum while optimizing execution at favorable price levels.
→ Alert-Driven Systematic Execution: Configure trend change alerts to capture every filter-validated directional shift from bullish to bearish conditions or vice versa, enabling consistent signal response without continuous chart monitoring and eliminating emotional decision-making during critical transition moments.

Demand & Supply by DaoEADemand & Supply by DaoEA
This indicator is designed to help traders identify key demand and supply zones, displaying strong price action patterns such as Pin Bar, Engulfing, Hammer, and Shooting Star to confirm reversal points.
Key Features
Automatically identifies Supply & Demand Zones and extends them to the right.
Displays Break of Structure (BOS) when prices break out of these zones.
Tracks Swing Highs/Lows and analyzes HH, HL, LH, and LL.
Highlights strong price action patterns such as Bullish/Bearish Pin Bars, Engulfing, Hammer, and Shooting Star.
Customizable zones, colors, and labels.
Overlay zone protection. To avoid over-cluttering the chart,
Usage
Use with higher timeframes (H1 and above) to identify high demand and supply points.
Switch to smaller timeframes (M15–M30) to identify entry and exit opportunities.
Wait for a strong BOS + PA to confirm the signal.
Suitable for scalpers, swing traders, and Smart Money Concept (SMC) traders who want to clearly understand market structure.

Volume Percentile Supertrend [BackQuant]Volume Percentile Supertrend
A volatility and participation aware Supertrend that automatically widens or tightens its bands based on where current volume sits inside its recent distribution. The goal is simple: fewer whipsaws when activity surges, faster reaction when the tape is quiet.
What it does
Calculates a standard Supertrend framework from an ATR on a volume weighted price source.
Measures current volume against its recent percentile and converts that context into a dynamic ATR multiplier.
Widens bands when volume is unusually high to reduce chop. Tightens bands when volume is unusually low to catch turns earlier.
Paints candles, draws the active Supertrend line and optional bands, and prints clear Long and Short signal markers.
Why volume percentile
Fixed ATR multipliers assume all bars are equal. They are not. When participation spikes, price swings expand and a static band gets sliced.
Percentiles place the current bar inside a recent distribution. If volume is in the top slice, the Supertrend allows more room. If volume is in the bottom slice, it expects smaller noise and tightens.
This keeps the same playbook usable across busy sessions and sleepy ones without constant manual retuning.
How it works
Volume distribution - A rolling window computes the Pth percentile of volume. Above that is flagged as high volume. A lower reference percentile marks quiet bars.
Dynamic multiplier - Start from a Base Multiplier. If bar is high volume, scale it up by a function of volume-to-average and a Sensitivity knob. If bar is low volume, scale it down. Smooth the result with an EMA to avoid jitter.
VWMA source - The price input for bands is a short volume weighted moving average of close. Heavy prints matter more.
ATR envelope - Compute ATR on your length. UpperBasic = VWMA + Multiplier x ATR. LowerBasic = VWMA - Multiplier x ATR.
Trailing logic - The final lines trail price so they only move in a direction that preserves Supertrend behavior. This prevents sudden flips from transient pokes.
Direction and signals - Direction flips when price crosses through the relevant trailing line. SupertrendLong and SupertrendShort mark those flips. The plotted Supertrend is the active trailing side.
Inputs and what they change
Volume Lookback - Window for percentile and average. Larger window = stabler percentile, smaller = snappier.
Volume Percentile Level - Threshold that defines high volume. Example 70 means top 30 percent of recent bars are treated as high activity.
Volume Sensitivity - Gain from volume ratio to the dynamic multiplier. Higher = bands expand more when volume spikes.
VWMA Source Length - Smoothing of the volume weighted price source for the bands.
ATR Length - Standard ATR window. Larger = slower, smaller = quicker.
Base Multiplier - Core band width before volume adjustment. Think of this as your neutral volatility setting.
Multiplier Smoothing - EMA on the dynamic multiplier. Reduces back and forth changes when volume oscillates around the threshold.
Show Supertrend on chart - Toggles the active line.
Show Upper Lower Bands - Draws both sides even when inactive. Good for context.
Paint candles according to Trend - Colors bars by trend direction.
Show Long and Short Signals - Prints 𝕃 and 𝕊 markers at flips.
Colors - Choose your long and short palette.
Reading the plot
Supertrend line - Thick line that hugs price from above in downtrends and from below in uptrends. Its distance breathes with volume.
Bands - Optional upper and lower rails. Useful to see the inactive side and judge how wide the envelope is right now.
Signals - 𝕃 prints when the trend flips long. 𝕊 prints when the trend flips short.
Candle colors - Quick bias read at a glance when painting is enabled.
Typical workflows
Trend following - Use 𝕃 flips to initiate longs and ride while bars remain colored long and price respects the lower trailing line. Mirror for shorts with 𝕊 and the upper trailing line. During high volume phases the line will give more room, which helps stay in the move.
Pullback adds - In an established trend, shallow tags toward the active line after a high volume expansion can be add points. The dynamic envelope adjusts to the session so your add distance is not fixed to a stale volatility regime.
Mean reversion filter - In quiet tape the multiplier contracts and flips come earlier. If you prefer fading, watch for quick toggles around the bands when volume percentile remains low. In high volume, avoid fading into the widened line unless you have other strong reasons.
Notes on behavior
High volume bar: the percentile gate opens, volRatio > 1 powers up the multiplier through the Sensitivity lever, bands widen, fewer false flips.
Low volume bar: multiplier contracts, bands tighten, flips can happen earlier which is useful when you want to catch regime changes in quiet conditions.
Smoothing matters: both the price source (VWMA) and the multiplier are smoothed to keep structure readable while still adapting.
Quick checklist
If you see frequent chop and today feels busy: check that volume is above your percentile. Wider bands are expected. Consider letting the trend prove itself against the expanded line before acting.
If everything feels slow and you want earlier entries: percentile likely marks low volume, so bands tighten and 𝕃 or 𝕊 can appear sooner.
If you want more or fewer flips overall: adjust Base Multiplier first. If you want more reaction specifically tied to volume surges: raise Volume Sensitivity. If the envelope breathes too fast: raise Multiplier Smoothing.
What the signals mean
SupertrendLong - Direction changed from non-long to long. 𝕃 marker prints. The active line switches to support below price.
SupertrendShort - Direction changed from non-short to short. 𝕊 marker prints. The active line switches to resistance above price.
Trend color - Bars painted long or short help validate context for entries and management.
Summary
Volume Percentile Supertrend adapts the classic Supertrend to the day you are trading. Volume percentile sets the mood, sensitivity translates it into dynamic band width, and smoothing keeps it clean. The result is a single plot that aims to stay conservative when the tape is loud and act decisively when it is quiet, without you having to constantly retune settings.

KAMENICZKI PROSCAPLERPROSCAPLER is an advanced trading indicator that combines a dynamic channel with a prediction line for maximum accuracy and trading success. The indicator is designed for professional traders who need reliable signals with high success rates.
Adaptive Intelligence
Automatic optimal period detection - the indicator adapts to various market conditions
Intelligent timeframe settings - automatically optimizes periods based on TF
Dynamic adaptation - the channel changes according to volatility and trend.
High Signal Accuracy
Pearson R correlation - filters only strong trends with high reliability
Multi-timeframe confirmation - confirms signals on higher timeframe
Volatility and volume filters - eliminates false signals
RSI extreme values - captures only the best entry points
Prediction Line
Future price direction - shows where the price will move
Adaptive length - adapts to timeframe
Strong signals - when the entire prediction line is in the center of the channel
Quality Filters
Minimum Pearson R 0.5+ - only strong trends
Volume filter 1.2x - only signals with sufficient volume
ATR volatility filter - eliminates low volatility
RSI extreme levels - only at oversold/overbought values
Anomalies
Anomaly detection - captures exceptional opportunities
Bright yellow/pink color - immediately visible
Fast Reaction
Minimum trend bars = 1 - fast turning
Adaptive detection - immediate reaction to changes
Automatic optimizations - without manual settings
News & Volatility Filters
News filter - disables channel during high impact news
Volatility filter - protects against high volatility
Gap detection - filters dangerous gaps
Combined Filters
All filters must be met - maximum reliability
Multi-timeframe confirmation - double check
Pearson R validation - mathematical accuracy
Volume confirmation - institutional interest
Reaction Speed
Instant signals - without delay
Adaptive settings - automatic optimization
Fast turning - minimum 1 bar trend
Signal Accuracy
Quality filters increase success rate to 70-80%
Anomalies have 80-90% success rate
STRONG signals (prediction line in center) 85-95%
HAVE FUN :)
BOCS Channel Scalper Indicator - Mean Reversion Alert System# BOCS Channel Scalper Indicator - Mean Reversion Alert System
## WHAT THIS INDICATOR DOES:
This is a mean reversion trading indicator that identifies consolidation channels through volatility analysis and generates alert signals when price enters entry zones near channel boundaries. **This indicator version is designed for manual trading with comprehensive alert functionality.** Unlike automated strategies, this tool sends notifications (via popup, email, SMS, or webhook) when trading opportunities occur, allowing you to manually review and execute trades. The system assumes price will revert to the channel mean, identifying scalp opportunities as price reaches extremes and preparing to bounce back toward center.
## INDICATOR VS STRATEGY - KEY DISTINCTION:
**This is an INDICATOR with alerts, not an automated strategy.** It does not execute trades automatically. Instead, it:
- Displays visual signals on your chart when entry conditions are met
- Sends customizable alerts to your device/email when opportunities arise
- Shows TP/SL levels for reference but does not place orders
- Requires you to manually enter and exit positions based on signals
- Works with all TradingView subscription levels (alerts included on all plans)
**For automated trading with backtesting**, use the strategy version. For manual control with notifications, use this indicator version.
## ALERT CAPABILITIES:
This indicator includes four distinct alert conditions that can be configured independently:
**1. New Channel Formation Alert**
- Triggers when a fresh BOCS channel is identified
- Message: "New BOCS channel formed - potential scalp setup ready"
- Use this to prepare for upcoming trading opportunities
**2. Long Scalp Entry Alert**
- Fires when price touches the long entry zone
- Message includes current price, calculated TP, and SL levels
- Notification example: "LONG scalp signal at 24731.75 | TP: 24743.2 | SL: 24716.5"
**3. Short Scalp Entry Alert**
- Fires when price touches the short entry zone
- Message includes current price, calculated TP, and SL levels
- Notification example: "SHORT scalp signal at 24747.50 | TP: 24735.0 | SL: 24762.75"
**4. Any Entry Signal Alert**
- Combined alert for both long and short entries
- Use this if you want a single alert stream for all opportunities
- Message: "BOCS Scalp Entry: at "
**Setting Up Alerts:**
1. Add indicator to chart and configure settings
2. Click the Alert (⏰) button in TradingView toolbar
3. Select "BOCS Channel Scalper" from condition dropdown
4. Choose desired alert type (Long, Short, Any, or Channel Formation)
5. Set "Once Per Bar Close" to avoid false signals during bar formation
6. Configure delivery method (popup, email, webhook for automation platforms)
7. Save alert - it will fire automatically when conditions are met
**Alert Message Placeholders:**
Alerts use TradingView's dynamic placeholder system:
- {{ticker}} = Symbol name (e.g., NQ1!)
- {{close}} = Current price at signal
- {{plot_1}} = Calculated take profit level
- {{plot_2}} = Calculated stop loss level
These placeholders populate automatically, creating detailed notification messages without manual configuration.
## KEY DIFFERENCE FROM ORIGINAL BOCS:
**This indicator is designed for traders seeking higher trade frequency.** The original BOCS indicator trades breakouts OUTSIDE channels, waiting for price to escape consolidation before entering. This scalper version trades mean reversion INSIDE channels, entering when price reaches channel extremes and betting on a bounce back to center. The result is significantly more trading opportunities:
- **Original BOCS**: 1-3 signals per channel (only on breakout)
- **Scalper Indicator**: 5-15+ signals per channel (every touch of entry zones)
- **Trade Style**: Mean reversion vs trend following
- **Hold Time**: Seconds to minutes vs minutes to hours
- **Best Markets**: Ranging/choppy conditions vs trending breakouts
This makes the indicator ideal for active day traders who want continuous alert opportunities within consolidation zones rather than waiting for breakout confirmation. However, increased signal frequency also means higher potential commission costs and requires disciplined trade selection when acting on alerts.
## TECHNICAL METHODOLOGY:
### Price Normalization Process:
The indicator normalizes price data to create consistent volatility measurements across different instruments and price levels. It calculates the highest high and lowest low over a user-defined lookback period (default 100 bars). Current close price is normalized using: (close - lowest_low) / (highest_high - lowest_low), producing values between 0 and 1 for standardized volatility analysis.
### Volatility Detection:
A 14-period standard deviation is applied to the normalized price series to measure price deviation from the mean. Higher standard deviation values indicate volatility expansion; lower values indicate consolidation. The indicator uses ta.highestbars() and ta.lowestbars() to identify when volatility peaks and troughs occur over the detection period (default 14 bars).
### Channel Formation Logic:
When volatility crosses from a high level to a low level (ta.crossover(upper, lower)), a consolidation phase begins. The indicator tracks the highest and lowest prices during this period, which become the channel boundaries. Minimum duration of 10+ bars is required to filter out brief volatility spikes. Channels are rendered as box objects with defined upper and lower boundaries, with colored zones indicating entry areas.
### Entry Signal Generation:
The indicator uses immediate touch-based entry logic. Entry zones are defined as a percentage from channel edges (default 20%):
- **Long Entry Zone**: Bottom 20% of channel (bottomBound + channelRange × 0.2)
- **Short Entry Zone**: Top 20% of channel (topBound - channelRange × 0.2)
Long signals trigger when candle low touches or enters the long entry zone. Short signals trigger when candle high touches or enters the short entry zone. Visual markers (arrows and labels) appear on chart, and configured alerts fire immediately.
### Cooldown Filter:
An optional cooldown period (measured in bars) prevents alert spam by enforcing minimum spacing between consecutive signals. If cooldown is set to 3 bars, no new long alert will fire until 3 bars after the previous long signal. Long and short cooldowns are tracked independently, allowing both directions to signal within the same period.
### ATR Volatility Filter:
The indicator includes a multi-timeframe ATR filter to avoid alerts during low-volatility conditions. Using request.security(), it fetches ATR values from a specified timeframe (e.g., 1-minute ATR while viewing 5-minute charts). The filter compares current ATR to a user-defined minimum threshold:
- If ATR ≥ threshold: Alerts enabled
- If ATR < threshold: No alerts fire
This prevents notifications during dead zones where mean reversion is unreliable due to insufficient price movement. The ATR status is displayed in the info table with visual confirmation (✓ or ✗).
### Take Profit Calculation:
Two TP methods are available:
**Fixed Points Mode**:
- Long TP = Entry + (TP_Ticks × syminfo.mintick)
- Short TP = Entry - (TP_Ticks × syminfo.mintick)
**Channel Percentage Mode**:
- Long TP = Entry + (ChannelRange × TP_Percent)
- Short TP = Entry - (ChannelRange × TP_Percent)
Default 50% targets the channel midline, a natural mean reversion target. These levels are displayed as visual lines with labels and included in alert messages for reference when manually placing orders.
### Stop Loss Placement:
Stop losses are calculated just outside the channel boundary by a user-defined tick offset:
- Long SL = ChannelBottom - (SL_Offset_Ticks × syminfo.mintick)
- Short SL = ChannelTop + (SL_Offset_Ticks × syminfo.mintick)
This logic assumes channel breaks invalidate the mean reversion thesis. SL levels are displayed on chart and included in alert notifications as suggested stop placement.
### Channel Breakout Management:
Channels are removed when price closes more than 10 ticks outside boundaries. This tolerance prevents premature channel deletion from minor breaks or wicks, allowing the mean reversion setup to persist through small boundary violations.
## INPUT PARAMETERS:
### Channel Settings:
- **Nested Channels**: Allow multiple overlapping channels vs single channel
- **Normalization Length**: Lookback for high/low calculation (1-500, default 100)
- **Box Detection Length**: Period for volatility detection (1-100, default 14)
### Scalping Settings:
- **Enable Long Scalps**: Toggle long alert generation on/off
- **Enable Short Scalps**: Toggle short alert generation on/off
- **Entry Zone % from Edge**: Size of entry zone (5-50%, default 20%)
- **SL Offset (Ticks)**: Distance beyond channel for stop (1+, default 5)
- **Cooldown Period (Bars)**: Minimum spacing between alerts (0 = no cooldown)
### ATR Filter:
- **Enable ATR Filter**: Toggle volatility filter on/off
- **ATR Timeframe**: Source timeframe for ATR (1, 5, 15, 60 min, etc.)
- **ATR Length**: Smoothing period (1-100, default 14)
- **Min ATR Value**: Threshold for alert enablement (0.1+, default 10.0)
### Take Profit Settings:
- **TP Method**: Choose Fixed Points or % of Channel
- **TP Fixed (Ticks)**: Static distance in ticks (1+, default 30)
- **TP % of Channel**: Dynamic target as channel percentage (10-100%, default 50%)
### Appearance:
- **Show Entry Zones**: Toggle zone labels on channels
- **Show Info Table**: Display real-time indicator status
- **Table Position**: Corner placement (Top Left/Right, Bottom Left/Right)
- **Long Color**: Customize long signal color (default: darker green for readability)
- **Short Color**: Customize short signal color (default: red)
- **TP/SL Colors**: Customize take profit and stop loss line colors
- **Line Length**: Visual length of TP/SL reference lines (5-200 bars)
## VISUAL INDICATORS:
- **Channel boxes** with semi-transparent fill showing consolidation zones
- **Colored entry zones** labeled "LONG ZONE ▲" and "SHORT ZONE ▼"
- **Entry signal arrows** below/above bars marking long/short alerts
- **TP/SL reference lines** with emoji labels (⊕ Entry, 🎯 TP, 🛑 SL)
- **Info table** showing channel status, last signal, entry/TP/SL prices, risk/reward ratio, and ATR filter status
- **Visual confirmation** when alerts fire via on-chart markers synchronized with notifications
## HOW TO USE:
### For 1-3 Minute Scalping with Alerts (NQ/ES):
- ATR Timeframe: "1" (1-minute)
- ATR Min Value: 10.0 (for NQ), adjust per instrument
- Entry Zone %: 20-25%
- TP Method: Fixed Points, 20-40 ticks
- SL Offset: 5-10 ticks
- Cooldown: 2-3 bars to reduce alert spam
- **Alert Setup**: Configure "Any Entry Signal" for combined long/short notifications
- **Execution**: When alert fires, verify chart visuals, then manually place limit order at entry zone with provided TP/SL levels
### For 5-15 Minute Day Trading with Alerts:
- ATR Timeframe: "5" or match chart
- ATR Min Value: Adjust to instrument (test 8-15 for NQ)
- Entry Zone %: 20-30%
- TP Method: % of Channel, 40-60%
- SL Offset: 5-10 ticks
- Cooldown: 3-5 bars
- **Alert Setup**: Configure separate "Long Scalp Entry" and "Short Scalp Entry" alerts if you trade directionally based on bias
- **Execution**: Review channel structure on alert, confirm ATR filter shows ✓, then enter manually
### For 30-60 Minute Swing Scalping with Alerts:
- ATR Timeframe: "15" or "30"
- ATR Min Value: Lower threshold for broader market
- Entry Zone %: 25-35%
- TP Method: % of Channel, 50-70%
- SL Offset: 10-15 ticks
- Cooldown: 5+ bars or disable
- **Alert Setup**: Use "New Channel Formation" to prepare for setups, then "Any Entry Signal" for execution alerts
- **Execution**: Larger timeframes allow more analysis time between alert and entry
### Webhook Integration for Semi-Automation:
- Configure alert webhook URL to connect with platforms like TradersPost, TradingView Paper Trading, or custom automation
- Alert message includes all necessary order parameters (direction, entry, TP, SL)
- Webhook receives structured data when signal fires
- External platform can auto-execute based on alert payload
- Still maintains manual oversight vs full strategy automation
## USAGE CONSIDERATIONS:
- **Manual Discipline Required**: Alerts provide opportunities but execution requires judgment. Not all alerts should be taken - consider market context, trend, and channel quality
- **Alert Timing**: Alerts fire on bar close by default. Ensure "Once Per Bar Close" is selected to avoid false signals during bar formation
- **Notification Delivery**: Mobile/email alerts may have 1-3 second delay. For immediate execution, use desktop popups or webhook automation
- **Cooldown Necessity**: Without cooldown, rapidly touching price action can generate excessive alerts. Start with 3-bar cooldown and adjust based on alert volume
- **ATR Filter Impact**: Enabling ATR filter dramatically reduces alert count but improves quality. Track filter status in info table to understand when you're receiving fewer alerts
- **Commission Awareness**: High alert frequency means high potential trade count. Calculate if your commission structure supports frequent scalping before acting on all alerts
## COMPATIBLE MARKETS:
Works on any instrument with price data including stock indices (NQ, ES, YM, RTY), individual stocks, forex pairs (EUR/USD, GBP/USD), cryptocurrency (BTC, ETH), and commodities. Volume-based features are not included in this indicator version. Multi-timeframe ATR requires higher-tier TradingView subscription for request.security() functionality on timeframes below chart timeframe.
## KNOWN LIMITATIONS:
- **Indicator does not execute trades** - alerts are informational only; you must manually place all orders
- **Alert delivery depends on TradingView infrastructure** - delays or failures possible during platform issues
- **No position tracking** - indicator doesn't know if you're in a trade; you must manage open positions independently
- **TP/SL levels are reference only** - you must manually set these on your broker platform; they are not live orders
- **Immediate touch entry can generate many alerts** in choppy zones without adequate cooldown
- **Channel deletion at 10-tick breaks** may be too aggressive or lenient depending on instrument tick size
- **ATR filter from lower timeframes** requires TradingView Premium/Pro+ for request.security()
- **Mean reversion logic fails** in strong breakout scenarios - alerts will fire but trades may hit stops
- **No partial closing capability** - full position management is manual; you determine scaling out
- **Alerts do not account for gaps** or overnight price changes; morning alerts may be stale
## RISK DISCLOSURE:
Trading involves substantial risk of loss. This indicator provides signals for educational and informational purposes only and does not constitute financial advice. Past performance does not guarantee future results. Mean reversion strategies can experience extended drawdowns during trending markets. Alerts are not guaranteed to be profitable and should be combined with your own analysis. Stop losses may not fill at intended levels during extreme volatility or gaps. Never trade with capital you cannot afford to lose. Consider consulting a licensed financial advisor before making trading decisions. Always verify alerts against current market conditions before executing trades manually.
## ACKNOWLEDGMENT & CREDITS:
This indicator is built upon the channel detection methodology created by **AlgoAlpha** in the "Smart Money Breakout Channels" indicator. Full credit and appreciation to AlgoAlpha for pioneering the normalized volatility approach to identifying consolidation patterns. The core channel formation logic using normalized price standard deviation is AlgoAlpha's original contribution to the TradingView community.
Enhancements to the original concept include: mean reversion entry logic (vs breakout), immediate touch-based alert generation, comprehensive alert condition system with customizable notifications, multi-timeframe ATR volatility filtering, cooldown period for alert management, dual TP methods (fixed points vs channel percentage), visual TP/SL reference lines, and real-time status monitoring table. This indicator version is specifically designed for manual traders who prefer alert-based decision making over automated execution.

Z-Score Trend Channels [BackQuant]Z-Score Trend Channels
A self-contained price-statistics framework that turns a rolling z-score into price channels, bias states, and trade markers. Run either trend-following or mean-reversion from the same tool with clear, on-chart context.
What it is
A rolling statistical map that measures how far price is from its recent average in standard-deviation units (z-score).
Adaptive channels drawn in price space from fixed z thresholds, so the rails breathe with volatility.
A simple trend proxy from z-score momentum to separate trending from ranging conditions.
On-chart signals for pullback entries, stretched extremes, and practical exits.
Core idea (plain English math)
Rolling mean and volatility - Over a lookback you get the average price and its standard deviation.
Z-score - How many standard deviations the current price is above or below its average: z = (price - mean) / stdev. z near 0 means near average; positive is above; negative is below.
Noise control - An EMA smooths the raw z to reduce jitter and false flickers.
Channels back in price - Fixed z levels are converted back to price to form the upper, lower, and extreme rails.
Trend proxy - A smoothed change in z is used as a lightweight trend-strength line. Positive strength with positive z favors uptrend; negative strength with negative z favors downtrend.
What you see on the chart
Channels and fills - Mean, upper, lower, and optional extreme lines. The area mean->upper tints with the bearish color, mean->lower tints with the bullish color.
Background tint (optional) - Soft green, red, or neutral based on detected trend state.
Signals - Bullish Entry (triangle up) when z exits the oversold zone upward; Bearish Entry (triangle down) when z exits the overbought zone downward; Extreme markers (diamonds) at the extreme bands with a one-bar turn.
Table - Current z, trend state, trend strength, distance to bands, market state tag, and a quick volatility regime label.
Edge labels - MEAN, OB, and OS labels slightly projected forward with level values.
Inputs you will actually use
Z-Score Period - Lookback for mean and stdev. Larger = slower and steadier rails, smaller = more reactive.
Smoothing Period - EMA on z. Lower = earlier but choppier flips; higher = later but cleaner.
Price Source - Default hlc3. Choose close if you prefer session-close logic.
Upper and Lower Thresholds - Default around +2.0 and -2.0. Tighten for more signals, widen for fewer and stronger.
Extreme Upper and Lower - Deeper stretch guards, e.g., +/- 2.5.
Strength Period - EMA on z momentum. Sets how fast the trend proxy flips.
Trend Threshold - Minimum absolute z to accept a directional bias.
Visual toggles - Channels, signals, background tint, stats table, colors, and optional last-bar trend label.
How to use it: trend-following playbook
Read the state - Uptrend when z > Trend Threshold and trend strength > 0. Downtrend when z < -Trend Threshold and trend strength < 0. Neutral otherwise.
Entries - In an uptrend, prefer Bullish Entry signals that fire near the lower channel. In a downtrend, prefer Bearish Entry signals that fire near the upper channel.
Stops - Conservative: beyond the extreme channel on your side. Tighter: just outside the standard band that framed the signal.
Exits - For longs, exit or trim on a cross back through z = 0 or a clean tag of the upper threshold. For shorts, mirror with z = 0 up-cross or tag of the lower threshold. You can also reduce if trend strength flips against you.
Adds - In strong trends, additional signals near your side’s band can be add points. Avoid adding once z hovers near the opposite band for several bars.
How to use it: mean-reversion playbook
Find stretch - Standard reversions: Bullish Entry when z leaves the oversold zone upward; Bearish Entry when z leaves the overbought zone downward. Aggressive reversions: Extreme markers at extreme bands with a one-bar turn.
Entries - Take the signal as price exits the zone. Prefer setups where trend strength is near zero or tilting against the prior push.
Targets - First target is the mean line. A runner can aim for the opposite standard channel if momentum keeps flipping.
Stops - Outside the extreme band beyond your entry. If fading without extremes, place risk just beyond the opposite standard band.
Filters - Optional: skip counter-trend fades against a very strong trend state unless your risk is tight and predefined.
Reading the stats table
Current Z-Score - Magnitude and sign of displacement now.
Trend State - Uptrend, Downtrend, or Ranging.
Trend Strength - Smoothed z momentum. Higher absolute values imply stronger directional conviction.
Distance to Upper/Lower - Percent distance from price to each band, useful for sizing targets or judging room left.
Market State - Overbought, Oversold, Extreme OB, Extreme OS, or Normal.
Volatility Regime - High, Normal, or Low relative to recent distribution. Expect bands to widen in High and tighten in Low.
Parameter guidance (conceptual)
Z-Score Period - Choose longer for a structural mean, shorter for a reactive mean.
Smoothing Period - Lower for earlier but noisier reads; higher for slower but steadier reads.
Thresholds - Start around +/- 2.0. Tighten for scalping or quiet ranges. Widen for noisy or fast markets.
Trend Threshold and Strength Period - Raise to avoid weak, transient bias. Lower to capture earlier regime shifts.
Practical examples
Trend pullback long - State shows Uptrend. Price tests the lower channel; z dips near or below the lower threshold; a Bullish Entry prints. Stop just below extreme lower; first target mean; keep a runner if trend strength stays positive.
Mean-revert short - State is Ranging. z tags the extreme upper, an Extreme Bearish marker prints, then a Bearish Entry prints on the leave. Stop above extreme upper; target the mean; consider a runner toward the lower channel if strength turns negative.
Potential Questions you might have
Why z-score instead of fixed offsets - Because the bands adapt with volatility. When the tape gets quiet the rails tighten, when it runs hot the rails expand. Your entries stay normalized.
Do I need both modes - No. Many users run only trend pullbacks or only mean-reversions. The tool lets you toggle what you need and keep the chart readable.
Multi-timeframe workflow - A common approach is to set bias from a higher timeframe’s trend state and execute on a lower timeframe’s signals that align with it.
Summary
Z-Score Trend Channels gives you an adaptive mean, volatility-aware rails, a simple trend lens, and clear signals. Trade the trend by buying pullbacks in green and selling pullbacks in red, or fade stretched extremes back to the mean with defined risk. One framework, two strategies, consistent logic.

BOCS AdaptiveBOCS Adaptive Strategy - Automated Volatility Breakout System
WHAT THIS STRATEGY DOES:
This is an automated trading strategy that detects consolidation patterns through volatility analysis and executes trades when price breaks out of these channels. Take-profit and stop-loss levels are calculated dynamically using Average True Range (ATR) to adapt to current market volatility. The strategy closes positions partially at the first profit target and exits the remainder at the second target or stop loss.
TECHNICAL METHODOLOGY:
Price Normalization Process:
The strategy begins by normalizing price to create a consistent measurement scale. It calculates the highest high and lowest low over a user-defined lookback period (default 100 bars). The current close price is then normalized using the formula: (close - lowest_low) / (highest_high - lowest_low). This produces values between 0 and 1, allowing volatility analysis to work consistently across different instruments and price levels.
Volatility Detection:
A 14-period standard deviation is applied to the normalized price series. Standard deviation measures how much prices deviate from their average - higher values indicate volatility expansion, lower values indicate consolidation. The strategy uses ta.highestbars() and ta.lowestbars() functions to track when volatility reaches peaks and troughs over the detection length period (default 14 bars).
Channel Formation Logic:
When volatility crosses from a high level to a low level, this signals the beginning of a consolidation phase. The strategy records this moment using ta.crossover(upper, lower) and begins tracking the highest and lowest prices during the consolidation. These become the channel boundaries. The duration between the crossover and current bar must exceed 10 bars minimum to avoid false channels from brief volatility spikes. Channels are drawn using box objects with the recorded high/low boundaries.
Breakout Signal Generation:
Two detection modes are available:
Strong Closes Mode (default): Breakout occurs when the candle body midpoint math.avg(close, open) exceeds the channel boundary. This filters out wick-only breaks.
Any Touch Mode: Breakout occurs when the close price exceeds the boundary.
When price closes above the upper channel boundary, a bullish breakout signal generates. When price closes below the lower boundary, a bearish breakout signal generates. The channel is then removed from the chart.
ATR-Based Risk Management:
The strategy uses request.security() to fetch ATR values from a specified timeframe, which can differ from the chart timeframe. For example, on a 5-minute chart, you can use 1-minute ATR for more responsive calculations. The ATR is calculated using ta.atr(length) with a user-defined period (default 14).
Exit levels are calculated at the moment of breakout:
Long Entry Price = Upper channel boundary
Long TP1 = Entry + (ATR × TP1 Multiplier)
Long TP2 = Entry + (ATR × TP2 Multiplier)
Long SL = Entry - (ATR × SL Multiplier)
For short trades, the calculation inverts:
Short Entry Price = Lower channel boundary
Short TP1 = Entry - (ATR × TP1 Multiplier)
Short TP2 = Entry - (ATR × TP2 Multiplier)
Short SL = Entry + (ATR × SL Multiplier)
Trade Execution Logic:
When a breakout occurs, the strategy checks if trading hours filter is satisfied (if enabled) and if position size equals zero (no existing position). If volume confirmation is enabled, it also verifies that current volume exceeds 1.2 times the 20-period simple moving average.
If all conditions are met:
strategy.entry() opens a position using the user-defined number of contracts
strategy.exit() immediately places a stop loss order
The code monitors price against TP1 and TP2 levels on each bar
When price reaches TP1, strategy.close() closes the specified number of contracts (e.g., if you enter with 3 contracts and set TP1 close to 1, it closes 1 contract). When price reaches TP2, it closes all remaining contracts. If stop loss is hit first, the entire position exits via the strategy.exit() order.
Volume Analysis System:
The strategy uses ta.requestUpAndDownVolume(timeframe) to fetch up volume, down volume, and volume delta from a specified timeframe. Three display modes are available:
Volume Mode: Shows total volume as bars scaled relative to the 20-period average
Comparison Mode: Shows up volume and down volume as separate bars above/below the channel midline
Delta Mode: Shows net volume delta (up volume - down volume) as bars, positive values above midline, negative below
The volume confirmation logic compares breakout bar volume to the 20-period SMA. If volume ÷ average > 1.2, the breakout is classified as "confirmed." When volume confirmation is enabled in settings, only confirmed breakouts generate trades.
INPUT PARAMETERS:
Strategy Settings:
Number of Contracts: Fixed quantity to trade per signal (1-1000)
Require Volume Confirmation: Toggle to only trade signals with volume >120% of average
TP1 Close Contracts: Exact number of contracts to close at first target (1-1000)
Use Trading Hours Filter: Toggle to restrict trading to specified session
Trading Hours: Session input in HHMM-HHMM format (e.g., "0930-1600")
Main Settings:
Normalization Length: Lookback bars for high/low calculation (1-500, default 100)
Box Detection Length: Period for volatility peak/trough detection (1-100, default 14)
Strong Closes Only: Toggle between body midpoint vs close price for breakout detection
Nested Channels: Allow multiple overlapping channels vs single channel at a time
ATR TP/SL Settings:
ATR Timeframe: Source timeframe for ATR calculation (1, 5, 15, 60, etc.)
ATR Length: Smoothing period for ATR (1-100, default 14)
Take Profit 1 Multiplier: Distance from entry as multiple of ATR (0.1-10.0, default 2.0)
Take Profit 2 Multiplier: Distance from entry as multiple of ATR (0.1-10.0, default 3.0)
Stop Loss Multiplier: Distance from entry as multiple of ATR (0.1-10.0, default 1.0)
Enable Take Profit 2: Toggle second profit target on/off
VISUAL INDICATORS:
Channel boxes with semi-transparent fill showing consolidation zones
Green/red colored zones at channel boundaries indicating breakout areas
Volume bars displayed within channels using selected mode
TP/SL lines with labels showing both price level and distance in points
Entry signals marked with up/down triangles at breakout price
Strategy status table showing position, contracts, P&L, ATR values, and volume confirmation status
HOW TO USE:
For 2-Minute Scalping:
Set ATR Timeframe to "1" (1-minute), ATR Length to 12, TP1 Multiplier to 2.0, TP2 Multiplier to 3.0, SL Multiplier to 1.5. Enable volume confirmation and strong closes only. Use trading hours filter to avoid low-volume periods.
For 5-15 Minute Day Trading:
Set ATR Timeframe to match chart or use 5-minute, ATR Length to 14, TP1 Multiplier to 2.0, TP2 Multiplier to 3.5, SL Multiplier to 1.2. Volume confirmation recommended but optional.
For Hourly+ Swing Trading:
Set ATR Timeframe to 15-30 minute, ATR Length to 14-21, TP1 Multiplier to 2.5, TP2 Multiplier to 4.0, SL Multiplier to 1.5. Volume confirmation optional, nested channels can be enabled for multiple setups.
BACKTEST CONSIDERATIONS:
Strategy performs best during trending or volatility expansion phases
Consolidation-heavy or choppy markets produce more false signals
Shorter timeframes require wider stop loss multipliers due to noise
Commission and slippage significantly impact performance on sub-5-minute charts
Volume confirmation generally improves win rate but reduces trade frequency
ATR multipliers should be optimized for specific instrument characteristics
COMPATIBLE MARKETS:
Works on any instrument with price and volume data including forex pairs, stock indices, individual stocks, cryptocurrency, commodities, and futures contracts. Requires TradingView data feed that includes volume for volume confirmation features to function.
KNOWN LIMITATIONS:
Stop losses execute via strategy.exit() and may not fill at exact levels during gaps or extreme volatility
request.security() on lower timeframes requires higher-tier TradingView subscription
False breakouts inherent to breakout strategies cannot be completely eliminated
Performance varies significantly based on market regime (trending vs ranging)
Partial closing logic requires sufficient position size relative to TP1 close contracts setting
RISK DISCLOSURE:
Trading involves substantial risk of loss. Past performance of this or any strategy does not guarantee future results. This strategy is provided for educational purposes and automated backtesting. Thoroughly test on historical data and paper trade before risking real capital. Market conditions change and strategies that worked historically may fail in the future. Use appropriate position sizing and never risk more than you can afford to lose. Consider consulting a licensed financial advisor before making trading decisions.
ACKNOWLEDGMENT & CREDITS:
This strategy is built upon the channel detection methodology created by AlgoAlpha in the "Smart Money Breakout Channels" indicator. Full credit and appreciation to AlgoAlpha for pioneering the normalized volatility approach to identifying consolidation patterns and sharing this innovative technique with the TradingView community. The enhancements added to the original concept include automated trade execution, multi-timeframe ATR-based risk management, partial position closing by contract count, volume confirmation filtering, and real-time position monitoring.

Maple Algorithm_GOLDMaple Algorithm – AI-Powered Gold Indicator
Maple Algorithm is an AI-inspired indicator designed specifically around the price behavior of Gold (XAUUSD).
It automatically calculates and plots take-profit (TP) and stop-loss (SL) levels based on dynamic market conditions, allowing traders to capture precise entries and exits.
✨ Key Features
AI-driven adaptive model trained on Gold’s market structure
Auto-generated TP/SL zones for precision trading
Compatible with your own strategies — scale from 1:2 RRR up to even higher setups
Optimized for scalping and short-term momentum bursts
⚠️ Disclaimer:
This indicator is for educational and research purposes only. It does not guarantee future results. Always test thoroughly before applying to live trading.
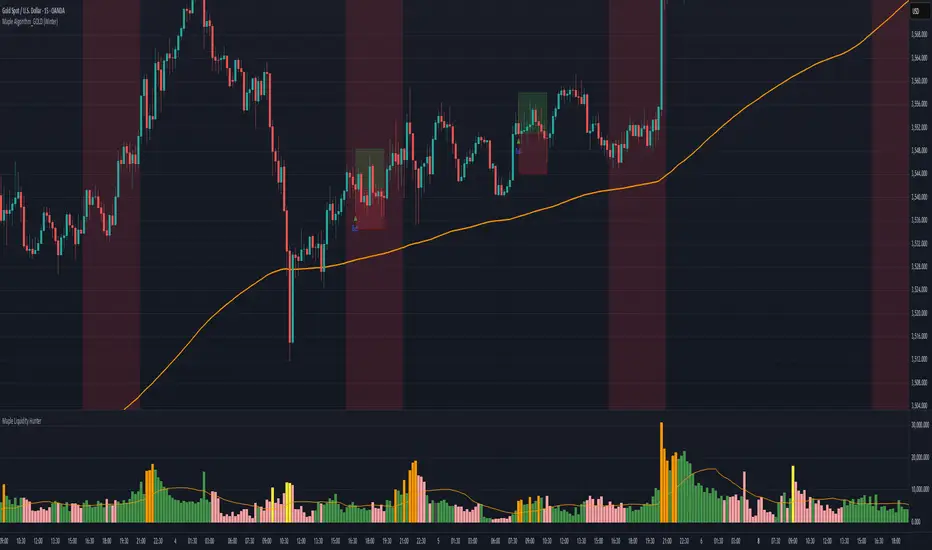
⚪ Liquidity Spike Marker
Description:
The Liquidity Spike Marker indicator helps to identify abnormal bursts of liquidity in the market. The logic is based on comparing the product of the volume by the minimum candle price (Volume × Low) with the threshold value set by the user.
When the value exceeds the threshold, a white triangle appears under the candle, indicating a possible influx of liquidity. This can help traders pay attention to the key points where large participants may enter the market.
Features:
Displays a placemark (⚪ white triangle) when the threshold is exceeded.
Configurable parameter Volume × Low Threshold.
The ability to set an alert for automatic notification.
A lightweight and minimalistic tool without unnecessary elements.
Note: The indicator is not a trading recommendation. Use it in combination with your own trading system and other analysis methods.


Foresight Cone (HoltxF1xVWAP) [KedArc Quant]Description:
This is a time-series forecasting indicator that estimates the next bar (F1) and projects a path a few bars ahead. It also draws a confidence cone based on how accurate the recent forecasts have been. You can optionally color the projection only when price agrees with VWAP.
Why it’s different
* One clear model: Everything comes from Holt’s trend-aware forecasting method—no mix of unrelated indicators.
* Transparent visuals: You see the next-bar estimate (F1), the forward projection, and a cone that widens or narrows based on recent forecast error.
* Context, not signals: The VWAP option only changes colors. It doesn’t add trade rules.
* No look-ahead: Accuracy is measured using the forecast made on the previous bar versus the current bar.
Inputs (what they mean)
* Source: Price series to forecast (default: Close).
* Preset: Quick profiles for fast, smooth, or momentum markets (see below).
* Alpha (Level): How fast the model reacts to new prices. Higher = faster, twitchier.
* Beta (Trend): How fast the model updates the slope. Higher = faster pivots, more flips in chop.
* Horizon: How many bars ahead to project. Bigger = wider cone.
* Residual Window: How many bars to judge recent accuracy. Bigger = steadier cone.
* Confidence Z: How wide the cone should be (typical setting ≈ “95% style” width).
* Show Bands / Draw Forward Path: Turn the cone and forward lines on/off.
* Color only when aligned with VWAP: Highlights projections only when price agrees with the trend side of VWAP.
* Colors / Show Panel: Styling plus a small panel with RMSE, MAPE, and trend slope.
Presets (when to pick which)
* Scalp / Fast (1-min): Very responsive; best for quick moves. More twitch in chop.
* Smooth Intraday (1–5 min): Calmer and steadier; a good default most days.
* Momentum / Breakout: Quicker slope tracking during strong pushes; may over-react in ranges.
* Custom: Set your own values if you know exactly what you want.
What is F1 here?
F1 is the model’s next-bar fair value. Crosses of price versus F1 can hint at short-term momentum shifts or mean-reversion, especially when viewed with VWAP or the cone.
How this helps
* Gives a baseline path of where price may drift and a cone that shows normal wiggle room.
* Helps you tell routine noise (inside cone) from information (edges or breaks outside the cone).
* Keeps you aware of short-term bias via the trend slope and F1.
How to use (step by step)
1. Add to chart → choose a Preset (start with Smooth Intraday).
2. Set Horizon around 8–15 bars for intraday.
3. (Optional) Turn on VWAP alignment to color only when price agrees with the trend side of VWAP.
4. Watch where price sits relative to the cone and F1:
* Inside = normal noise.
* At edges = stretched.
* Outside = possible regime change.
5. Check the panel: if RMSE/MAPE spike, expect a wider cone; consider a smoother preset or a higher timeframe.
6. Tweak Alpha/Beta only if needed: faster for momentum, slower for chop.
7. Combine with your own plan for entries, exits, and risk.
Accuracy Panel — what it tells you
Preset & Horizon: Shows which preset you’re using and how many bars ahead the projection goes. Longer horizons mean more uncertainty.
RMSE (error in price units): A “typical miss” measured in the chart’s currency (e.g., ₹).
Lower = tighter fit and a usually narrower cone. Rising = conditions getting noisier; the cone will widen.
MAPE (error in %): The same idea as RMSE but in percent.
Good for comparing different symbols or timeframes. Sudden spikes often hint at a regime change.
Slope T: The model’s short-term trend reading.
Positive = gentle up-bias; negative = gentle down-bias; near zero = mostly flat/drifty.
How to read it at a glance
Calm & directional: RMSE/MAPE steady or falling + Slope T positive (or negative) → trends tend to respect the cone’s mid/upper (or mid/lower) area.
Choppy/uncertain: RMSE/MAPE climbing or jumping → expect more whipsaw; rely more on the cone edges and higher-TF context.
Flat tape: Slope T near zero → mean-revert behavior is common; treat cone edges as stretch zones rather than breakout zones.
Warm-up & tweaks
Warm-up: Right after adding the indicator, the panel may be blank for a short time while it gathers enough bars.
Too twitchy? Switch to Smooth Intraday or increase the Residual Window.
Too slow? Use Scalp/Fast or Momentum/Breakout to react quicker.
Timeframe tips
* 1–3 min: Scalp/Fast or Momentum/Breakout; horizon \~8–12.
* 5–15 min: Smooth Intraday; horizon \~12–15.
* 30–60 min+: Consider a larger residual window for a steadier cone.
FAQ
Q: Is this a strategy or an indicator?
A: It’s an indicator only. It does not place orders, TP/SL, or run backtests.
Q: Does it repaint?
A: The next-bar estimate (F1) and the cone are calculated using only information available at that time. The forward path is a projection drawn on the last bar and will naturally update as new bars arrive. Historical bars aren’t revised with future data.
Q: What is F1?
A: F1 is the indicator’s best guess for the next bar.
Price crossing above/below F1 can hint at short-term momentum shifts or mean-reversion.
Q: What do “Alpha” and “Beta” do?
A: Alpha controls how fast the indicator reacts to new prices
(higher = faster, twitchier). Beta controls how fast the slope updates (higher = quicker pivots, more flips in chop).
Q: Why does the cone width change?
A: It reflects recent forecast accuracy. When the market gets noisy, the cone widens. When the tape is calm, it narrows.
Q: What does the Accuracy Panel tell me?
A:
* Preset & Horizon you’re using.
* RMSE: typical forecast miss in price units.
* MAPE: typical forecast miss in percent.
* Slope T: short-term trend reading (up, down, or flat).
If RMSE/MAPE rise, expect a wider cone and more whipsaw.
Q: The panel shows “…” or looks empty. Why?
A: It needs a short warm-up to gather enough bars. This is normal after you add the indicator or change settings/timeframes.
Q: Which timeframe is best?
A:
* 1–3 min: Scalp/Fast or Momentum/Breakout, horizon \~8–12.
* 5–15 min: Smooth Intraday, horizon \~12–15.
Higher timeframes work too; consider a larger residual window for steadier cones.
Q: Which preset should I start with?
A: Start with Smooth Intraday. If the market is trending hard, try Momentum/Breakout.
For very quick tapes, use Scalp/Fast. Switch back if things get choppy.
Q: What does the VWAP option do?
A: It only changes colors (highlights when price agrees with the trend side of VWAP).
It does not add or remove signals.
Q: Are there alerts?
A: Yes—alerts for price crossing F1 (up/down). Use “Once per bar close” to reduce noise on fast charts.
Q: Can I use this on stocks, futures, crypto, or FX?
A: Yes. It works on any symbol/timeframe. You may want to adjust Horizon and the Residual Window based on volatility.
Q: Can I use it with Heikin Ashi or other non-standard bars?
A: You can, but remember you’re forecasting the synthetic series of those bars. For pure price behavior, use regular candles.
Q: The cone feels too wide/too narrow. What do I change?
A:
* Too wide: lower Alpha/Beta a bit or increase the Residual Window.
* Too narrow (misses moves): raise Alpha/Beta slightly or try Momentum/Breakout.
Q: Why do results change when I switch timeframe or symbol?
A: Different noise levels and trends. The accuracy stats reset per chart, so the cone adapts to each context.
Q: Any limits or gotchas?
A: Extremely large Horizon may hit TradingView’s line-object limits; reduce Horizon or turn
off extra visuals if needed. Big gaps or news spikes will widen errors—expect the cone to react.
Q: Can this predict exact future prices?
A: No. It provides a baseline path and context. Always combine with your own rules and risk management.
Glossary
* TS (Time Series): Data over time (prices).
* Holt’s Method: A forecasting approach that tracks a current level and a trend to predict the next bars.
* F1: The indicator’s best guess for the next bar.
* F(h): The projected value h bars ahead.
* VWAP: Volume-Weighted Average Price—used here for optional color alignment.
* RMSE: Typical forecast miss in price units (how far off, on average).
* MAPE: Typical forecast miss in percent (scale-free, easy to compare).
Notes & limitations
* The panel needs a short warm-up; stats may be blank at first.
* The cone reflects recent conditions; sudden volatility changes will widen it.
* This is a tool for context. It does not place trades and does not promise results.
⚠️ Disclaimer
This script is provided for educational purposes only.
Past performance does not guarantee future results.
Trading involves risk, and users should exercise caution and use proper risk management when applying this strategy.

FlowSpike ES — BB • RSI • VWAP + AVWAP + News MuteThis indicator is purpose-built for E-mini S&P 500 (ES) futures traders, combining volatility bands, momentum filters, and session-anchored levels into a streamlined tool for intraday execution.
Key Features:
• ES-Tuned Presets
Automatically optimized settings for scalping (1–2m), daytrading (5m), and swing trading (15–60m) timeframes.
• Bollinger Band & RSI Signals
Entry signals trigger only at statistically significant extremes, with RSI filters to reduce false moves.
• VWAP & Anchored VWAPs
Session VWAP plus anchored VWAPs (RTH open, weekly, monthly, and custom) provide high-confidence reference levels used by professional order-flow traders.
• Volatility Filter (ATR in ticks)
Ensures signals are only shown when the ES is moving enough to offer tradable edges.
• News-Time Mute
Suppresses signals around scheduled economic releases (customizable windows in ET), helping traders avoid whipsaw conditions.
• Clean Alerts
Long/short alerts are generated only when all conditions align, with optional bar-close confirmation.
Why It’s Tailored for ES Futures:
• Designed around ES tick size (0.25) and volatility structure.
• Session settings respect RTH hours (09:30–16:00 ET), the period where most liquidity and institutional flows concentrate.
• ATR thresholds and RSI bands are pre-tuned for ES market behavior, reducing the need for manual optimization.
⸻
This is not a generic indicator—it’s a futures-focused tool created to align with the way ES trades day after day. Whether you scalp the open, manage intraday swings, or align to weekly/monthly anchored flows, FlowSpike ES gives you a clear, rules-based signal framework.

Dynamic Stop Loss Optimizer [BackQuant]Dynamic Stop Loss Optimizer
Overview
Stop placement decides expectancy. This tool gives you three professional-grade, adaptive stop engines, ATR, Volatility, and Hybrid. So your exits scale with current conditions instead of guessing fixed ticks. It trails intelligently, redraws as the market evolves, and annotates the chart with clean labels/lines and a compact stats table. Pick the engine that fits the trade, or switch on the fly.
What it does
Calculates three adaptive stops in real time (ATR-based, Volatility-based, and Hybrid) and keeps them trailed as price makes progress.
Shows exactly where your risk lives with on-chart levels, color-coded markers (long/short), and precise “Risk %” labels at the current bar.
Surfaces context you actually use - current ATR, daily volatility, selected method, and the live stop level—in a tidy, movable table.
Fires alerts on stop hits so you can automate exits or journal outcomes without staring at the screen.
Why it matters
Adaptive risk control: Stops expand in fast tape and tighten in quiet tape. You’re not punished for volatility; you’re aligned with it.
Consistency across assets: The same playbook works whether you’re trading indexes, FX, crypto, or equities, because the engine normalizes to each symbol’s behavior.
Cleaner decision-making: One chart shows your entry idea and its invalidation in the same breath. If price trespasses, you know it instantly.
The three methods (choose your engine)
1) ATR Based “Structure-aware” distance
This classic approach keys off Average True Range to set a stop just beyond typical bar-to-bar excursion. It adapts smoothly to changing ranges and respects swing structure.
Use when: you want a steady, intuitive buffer that tracks trend legs without hugging price.
See it in action:
2) Volatility Based “Behavior-aware” distance
This engine derives stop distance from current return volatility (annualized, then scaled back down to the session). It reacts to regime shifts quickly and normalizes risk across symbols with very different prices.
Use when: you want the stop to breathe with realized volatility and respond faster to heat-ups/cool-downs.
See it in action:
3) Hybrid “Best of both worlds”
The Hybrid blends the ATR and Volatility distances into one consensus level, then trails it intelligently. You get the structural common sense of ATR and the regime sensitivity of Vol.
Use when: you want robust, all-weather behavior without micromanaging inputs.
See it in action:
How it trails
Longs: The stop ratchets up with favorable movement and holds its ground on shallow pullbacks. If price closes back into the risk zone, the level refreshes to the newest valid distance.
Shorts: Mirror logic ratchets down with trend, resists noise, and refreshes if price reclaims the zone.
Hybrid trailing: Uses the blended distance and the same “no give-backs” principle to keep gains protected as structure builds.
Reading the chart
Markers: Circles = ATR stops, Crosses = Vol stops, Diamonds = Hybrid. Colors indicate long (red level under price) vs short (green level above price).
Lines: The latest active stop is extended with a dashed line so you can see it at a glance.
Labels: “Long SL / Short SL” shows the exact price and current risk % from the last close no math required.
Table: ATR value, Daily Vol %, your chosen Method, the Current SL, and Risk %—all in one compact block that you can pin top-left/right/center.
Quick workflow
Define the idea: Long or Short, and which engine fits the tape (ATR, Vol, or Hybrid).
Place and trail: Let the optimizer print the level; trail automatically as the move develops.
Manage outcomes: If the line is tagged, you’re out clean. If it holds, you’ve contained heat while giving the trade room to work.
Inputs you’ll actually touch
Calculation Settings
ATR Length / Multiplier: Controls the “structural” cushion.
Volatility Length / Multiplier: Controls the “behavioral” cushion.
Trading Days: 252 or 365 to keep the volatility math aligned with the asset’s trading calendar.
Stop Loss Method
ATR Based | Volatility Based | Hybrid : Switch engines instantly to fit the trade.
Position Type
Long | Short | Both : Show only what you need for the current strategy.
Visual Settings
Show ATR / Vol / Hybrid Stops: Toggle families on/off.
Show Labels: Print price + Risk % at the live stop.
Table Position: Park the metrics where you like.
Coloring
Long/Short/Hybrid colors: Set a palette that matches your theme and stands out on your background.
Practical patterns to watch
Trend-pullback continuation: The stop ratchets behind higher lows (long) or lower highs (short). If price tests the level and rejects, that’s your risk-defined continuation cue.
Break-and-run: After a clean break, the Hybrid will usually sit slightly wider than pure Vol, use it to avoid getting shaken on the first retest.
Range compression: When the ATR and Vol distances converge, the table will show small Risk %. That’s your green light to size up with the same dollar risk, or keep it conservative if you expect expansion.
Alerts
Long Stop Loss Hit : Notifies when price crosses below the live long stop.
Short Stop Loss Hit : Notifies when price crosses above the live short stop.
Why this feels “set-and-serious”
You get a single look that answers three questions in real time: “Where’s my line in the sand?”, “How much heat am I taking right now?”, and “Is this distance appropriate for current conditions?” With ATR, Vol, and Hybrid in one tool, you can run the exact same playbook across symbols and regimes while keeping your chart clean and your risk explicit.
