Trendline Breaks with Multi Fibonacci Supertrend StrategyTMFS Strategy: Advanced Trendline Breakouts with Multi-Fibonacci Supertrend
Elevate your algorithmic trading with institutional-grade signal confluence
Strategy Genesis & Evolution
This advanced trading system represents the culmination of a personal research journey, evolving from my custom " Multi Fibonacci Supertrend with Signals " indicator into a comprehensive trading strategy. Built upon the exceptional trendline detection methodology pioneered by LuxAlgo in their " Trendlines with Breaks " indicator, I've engineered a systematic framework that integrates multiple technical factors into a cohesive trading system.
Core Fibonacci Principles
At the heart of this strategy lies the Fibonacci sequence application to volatility measurement:
// Fibonacci-based factors for multiple Supertrend calculations
factor1 = input.float(0.618, 'Factor 1 (Weak/Fibonacci)', minval = 0.01, step = 0.01)
factor2 = input.float(1.618, 'Factor 2 (Medium/Golden Ratio)', minval = 0.01, step = 0.01)
factor3 = input.float(2.618, 'Factor 3 (Strong/Extended Fib)', minval = 0.01, step = 0.01)
These precise Fibonacci ratios create a dynamic volatility envelope that adapts to changing market conditions while maintaining mathematical harmony with natural price movements.
Dynamic Trendline Detection
The strategy incorporates LuxAlgo's pioneering approach to trendline detection:
// Pivotal swing detection (inspired by LuxAlgo)
pivot_high = ta.pivothigh(swing_length, swing_length)
pivot_low = ta.pivotlow(swing_length, swing_length)
// Dynamic slope calculation using ATR
slope = atr_value / swing_length * atr_multiplier
// Update trendlines based on pivot detection
if bool(pivot_high)
upper_slope := slope
upper_trendline := pivot_high
else
upper_trendline := nz(upper_trendline) - nz(upper_slope)
This adaptive trendline approach automatically identifies key structural market boundaries, adjusting in real-time to evolving chart patterns.
Breakout State Management
The strategy implements sophisticated state tracking for breakout detection:
// Track breakouts with state variables
var int upper_breakout_state = 0
var int lower_breakout_state = 0
// Update breakout state when price crosses trendlines
upper_breakout_state := bool(pivot_high) ? 0 : close > upper_trendline ? 1 : upper_breakout_state
lower_breakout_state := bool(pivot_low) ? 0 : close < lower_trendline ? 1 : lower_breakout_state
// Detect new breakouts (state transitions)
bool new_upper_breakout = upper_breakout_state > upper_breakout_state
bool new_lower_breakout = lower_breakout_state > lower_breakout_state
This state-based approach enables precise identification of the exact moment when price breaks through a significant trendline.
Multi-Factor Signal Confluence
Entry signals require confirmation from multiple technical factors:
// Define entry conditions with multi-factor confluence
long_entry_condition = enable_long_positions and
upper_breakout_state > upper_breakout_state and // New trendline breakout
di_plus > di_minus and // Bullish DMI confirmation
close > smoothed_trend // Price above Supertrend envelope
// Execute trades only with full confirmation
if long_entry_condition
strategy.entry('L', strategy.long, comment = "LONG")
This strict requirement for confluence significantly reduces false signals and improves the quality of trade entries.
Advanced Risk Management
The strategy includes sophisticated risk controls with multiple methodologies:
// Calculate stop loss based on selected method
get_long_stop_loss_price(base_price) =>
switch stop_loss_method
'PERC' => base_price * (1 - long_stop_loss_percent)
'ATR' => base_price - long_stop_loss_atr_multiplier * entry_atr
'RR' => base_price - (get_long_take_profit_price() - base_price) / long_risk_reward_ratio
=> na
// Implement trailing functionality
strategy.exit(
id = 'Long Take Profit / Stop Loss',
from_entry = 'L',
qty_percent = take_profit_quantity_percent,
limit = trailing_take_profit_enabled ? na : long_take_profit_price,
stop = long_stop_loss_price,
trail_price = trailing_take_profit_enabled ? long_take_profit_price : na,
trail_offset = trailing_take_profit_enabled ? long_trailing_tp_step_ticks : na,
comment = "TP/SL Triggered"
)
This flexible approach adapts to varying market conditions while providing comprehensive downside protection.
Performance Characteristics
Rigorous backtesting demonstrates exceptional capital appreciation potential with impressive risk-adjusted metrics:
Remarkable total return profile (1,517%+)
Strong Sortino ratio (3.691) indicating superior downside risk control
Profit factor of 1.924 across all trades (2.153 for long positions)
Win rate exceeding 35% with balanced distribution across varied market conditions
Institutional Considerations
The strategy architecture addresses execution complexities faced by institutional participants with temporal filtering and date-range capabilities:
// Time Filter settings with flexible timezone support
import jason5480/time_filters/5 as time_filter
src_timezone = input.string(defval = 'Exchange', title = 'Source Timezone')
dst_timezone = input.string(defval = 'Exchange', title = 'Destination Timezone')
// Date range filtering for precise execution windows
use_from_date = input.bool(defval = true, title = 'Enable Start Date')
from_date = input.time(defval = timestamp('01 Jan 2022 00:00'), title = 'Start Date')
// Validate trading permission based on temporal constraints
date_filter_approved = time_filter.is_in_date_range(
use_from_date, from_date, use_to_date, to_date, src_timezone, dst_timezone
)
These capabilities enable precise execution timing and market session optimization critical for larger market participants.
Acknowledgments
Special thanks to LuxAlgo for the pioneering work on trendline detection and breakout identification that inspired elements of this strategy. Their innovative approach to technical analysis provided a valuable foundation upon which I could build my Fibonacci-based methodology.
This strategy is shared under the same Attribution-NonCommercial-ShareAlike 4.0 International (CC BY-NC-SA 4.0) license as LuxAlgo's original work.
Past performance is not indicative of future results. Conduct thorough analysis before implementing any algorithmic strategy.
在腳本中搜尋"如何用wind搜索股票的发行价和份数"

Hourly Volatility Explorer📊 Hourly Volatility Explorer: Master The Market's Pulse
Unlock the hidden rhythms of price action with this sophisticated volatility analysis tool. The Hourly Volatility Explorer reveals the most potent trading hours across multiple time zones, giving you a strategic edge in timing your trades.
🌟 Key Features:
⏰ Multi-Timezone Analysis
• GMT (UTC+0)
• EST (UTC-5) - New York
• BST (UTC+1) - London
• JST (UTC+9) - Tokyo
• AEST (UTC+10) - Sydney
Perfect for tracking major market sessions and their overlaps!
📈 Dynamic Visualization
• Color-gradient hourly bars for instant pattern recognition
• Real-time volatility comparison
• Interactive data table with comprehensive statistics
• Automatic highlighting of peak volatility periods
🎯 Strategic Applications:
Day Trading:
• Identify optimal trading windows
• Avoid low-liquidity periods
• Capitalize on session overlaps
• Fine-tune entry/exit timing
Risk Management:
• Set appropriate stop losses based on hourly volatility
• Adjust position sizes for different market hours
• Optimize risk-reward ratios
• Plan around high-impact hours
Global Market Analysis:
• Track volatility across all major sessions
• Spot institutional trading patterns
• Identify quiet vs. active periods
• Monitor 24/7 market dynamics
💡 Perfect For:
• Forex traders navigating global sessions
• Crypto traders in 24/7 markets
• Day traders optimizing execution times
• Algorithmic traders fine-tuning strategies
• Risk managers calibrating exposure
📊 Advanced Features:
• Rolling 3-month analysis for reliable patterns
• Precise pip movement calculations
• Sample size tracking for statistical validity
• Real-time current hour comparison
• Color-coded visual system for instant insights
⚡ Pro Trading Tips:
• Use during major session overlaps for maximum opportunity
• Compare patterns across different instruments
• Combine with volume analysis for deeper insights
• Track seasonal variations in hourly patterns
• Build trading schedules around peak hours
🎓 Educational Value:
• Understand market microstructure
• Learn global market dynamics
• Master timezone relationships
• Develop timing intuition
🛠️ Customization:
• Adjustable lookback period
• Flexible pip multiplier
• Multiple timezone options
• Visual preference settings
Whether you're scalping the 1-minute chart or managing longer-term positions, the Hourly Volatility Explorer provides the precise timing intelligence needed for today's global markets.
Transform your trading schedule from guesswork to science. Know exactly when markets move, why they move, and how to position yourself for maximum opportunity.
#TechnicalAnalysis #Trading #Volatility #MarketTiming #DayTrading #Forex #Crypto #TradingView #PineScript #MarketAnalysis #TradingStrategy #RiskManagement #GlobalMarkets #FinancialMarkets #TradingTools #MarketStructure #PriceAction #Scalping #SwingTrading #AlgoTrading

real_time_candlesIntroduction
The Real-Time Candles Library provides comprehensive tools for creating, manipulating, and visualizing custom timeframe candles in Pine Script. Unlike standard indicators that only update at bar close, this library enables real-time visualization of price action and indicators within the current bar, offering traders unprecedented insight into market dynamics as they unfold.
This library addresses a fundamental limitation in traditional technical analysis: the inability to see how indicators evolve between bar closes. By implementing sophisticated real-time data processing techniques, traders can now observe indicator movements, divergences, and trend changes as they develop, potentially identifying trading opportunities much earlier than with conventional approaches.
Key Features
The library supports two primary candle generation approaches:
Chart-Time Candles: Generate real-time OHLC data for any variable (like RSI, MACD, etc.) while maintaining synchronization with chart bars.
Custom Timeframe (CTF) Candles: Create candles with custom time intervals or tick counts completely independent of the chart's native timeframe.
Both approaches support traditional candlestick and Heikin-Ashi visualization styles, with options for moving average overlays to smooth the data.
Configuration Requirements
For optimal performance with this library:
Set max_bars_back = 5000 in your script settings
When using CTF drawing functions, set max_lines_count = 500, max_boxes_count = 500, and max_labels_count = 500
These settings ensure that you will be able to draw correctly and will avoid any runtime errors.
Usage Examples
Basic Chart-Time Candle Visualization
// Create real-time candles for RSI
float rsi = ta.rsi(close, 14)
Candle rsi_candle = candle_series(rsi, CandleType.candlestick)
// Plot the candles using Pine's built-in function
plotcandle(rsi_candle.Open, rsi_candle.High, rsi_candle.Low, rsi_candle.Close,
"RSI Candles", rsi_candle.candle_color, rsi_candle.candle_color)
Multiple Access Patterns
The library provides three ways to access candle data, accommodating different programming styles:
// 1. Array-based access for collection operations
Candle candles = candle_array(source)
// 2. Object-oriented access for single entity manipulation
Candle candle = candle_series(source)
float value = candle.source(Source.HLC3)
// 3. Tuple-based access for functional programming styles
= candle_tuple(source)
Custom Timeframe Examples
// Create 20-second candles with EMA overlay
plot_ctf_candles(
source = close,
candle_type = CandleType.candlestick,
sample_type = SampleType.Time,
number_of_seconds = 20,
timezone = -5,
tied_open = true,
ema_period = 9,
enable_ema = true
)
// Create tick-based candles (new candle every 15 ticks)
plot_ctf_tick_candles(
source = close,
candle_type = CandleType.heikin_ashi,
number_of_ticks = 15,
timezone = -5,
tied_open = true
)
Advanced Usage with Custom Visualization
// Get custom timeframe candles without automatic plotting
CandleCTF my_candles = ctf_candles_array(
source = close,
candle_type = CandleType.candlestick,
sample_type = SampleType.Time,
number_of_seconds = 30
)
// Apply custom logic to the candles
float ema_values = my_candles.ctf_ema(14)
// Draw candles and EMA using time-based coordinates
my_candles.draw_ctf_candles_time()
ema_values.draw_ctf_line_time(line_color = #FF6D00)
Library Components
Data Types
Candle: Structure representing chart-time candles with OHLC, polarity, and visualization properties
CandleCTF: Extended candle structure with additional time metadata for custom timeframes
TickData: Structure for individual price updates with time deltas
Enumerations
CandleType: Specifies visualization style (candlestick or Heikin-Ashi)
Source: Defines price components for calculations (Open, High, Low, Close, HL2, etc.)
SampleType: Sets sampling method (Time-based or Tick-based)
Core Functions
get_tick(): Captures current price as a tick data point
candle_array(): Creates an array of candles from price updates
candle_series(): Provides a single candle based on latest data
candle_tuple(): Returns OHLC values as a tuple
ctf_candles_array(): Creates custom timeframe candles without rendering
Visualization Functions
source(): Extracts specific price components from candles
candle_ctf_to_float(): Converts candle data to float arrays
ctf_ema(): Calculates exponential moving averages for candle arrays
draw_ctf_candles_time(): Renders candles using time coordinates
draw_ctf_candles_index(): Renders candles using bar index coordinates
draw_ctf_line_time(): Renders lines using time coordinates
draw_ctf_line_index(): Renders lines using bar index coordinates
Technical Implementation Notes
This library leverages Pine Script's varip variables for state management, creating a sophisticated real-time data processing system. The implementation includes:
Efficient tick capturing: Samples price at every execution, maintaining temporal tracking with time deltas
Smart state management: Uses a hybrid approach with mutable updates at index 0 and historical preservation at index 1+
Temporal synchronization: Manages two time domains (chart time and custom timeframe)
The tooltip implementation provides crucial temporal context for custom timeframe visualizations, allowing users to understand exactly when each candle formed regardless of chart timeframe.
Limitations
Custom timeframe candles cannot be backtested due to Pine Script's limitations with historical tick data
Real-time visualization is only available during live chart updates
Maximum history is constrained by Pine Script's array size limits
Applications
Indicator visualization: See how RSI, MACD, or other indicators evolve in real-time
Volume analysis: Create custom volume profiles independent of chart timeframe
Scalping strategies: Identify short-term patterns with precisely defined time windows
Volatility measurement: Track price movement characteristics within bars
Custom signal generation: Create entry/exit signals based on custom timeframe patterns
Conclusion
The Real-Time Candles Library bridges the gap between traditional technical analysis (based on discrete OHLC bars) and the continuous nature of market movement. By making indicators more responsive to real-time price action, it gives traders a significant edge in timing and decision-making, particularly in fast-moving markets where waiting for bar close could mean missing important opportunities.
Whether you're building custom indicators, researching price patterns, or developing trading strategies, this library provides the foundation for sophisticated real-time analysis in Pine Script.
Implementation Details & Advanced Guide
Core Implementation Concepts
The Real-Time Candles Library implements a sophisticated event-driven architecture within Pine Script's constraints. At its heart, the library creates what's essentially a reactive programming framework handling continuous data streams.
Tick Processing System
The foundation of the library is the get_tick() function, which captures price updates as they occur:
export get_tick(series float source = close, series float na_replace = na)=>
varip float price = na
varip int series_index = -1
varip int old_time = 0
varip int new_time = na
varip float time_delta = 0
// ...
This function:
Samples the current price
Calculates time elapsed since last update
Maintains a sequential index to track updates
The resulting TickData structure serves as the fundamental building block for all candle generation.
State Management Architecture
The library employs a sophisticated state management system using varip variables, which persist across executions within the same bar. This creates a hybrid programming paradigm that's different from standard Pine Script's bar-by-bar model.
For chart-time candles, the core state transition logic is:
// Real-time update of current candle
candle_data := Candle.new(Open, High, Low, Close, polarity, series_index, candle_color)
candles.set(0, candle_data)
// When a new bar starts, preserve the previous candle
if clear_state
candles.insert(1, candle_data)
price.clear()
// Reset state for new candle
Open := Close
price.push(Open)
series_index += 1
This pattern of updating index 0 in real-time while inserting completed candles at index 1 creates an elegant solution for maintaining both current state and historical data.
Custom Timeframe Implementation
The custom timeframe system manages its own time boundaries independent of chart bars:
bool clear_state = switch settings.sample_type
SampleType.Ticks => cumulative_series_idx >= settings.number_of_ticks
SampleType.Time => cumulative_time_delta >= settings.number_of_seconds
This dual-clock system synchronizes two time domains:
Pine's execution clock (bar-by-bar processing)
The custom timeframe clock (tick or time-based)
The library carefully handles temporal discontinuities, ensuring candle formation remains accurate despite irregular tick arrival or market gaps.
Advanced Usage Techniques
1. Creating Custom Indicators with Real-Time Candles
To develop indicators that process real-time data within the current bar:
// Get real-time candles for your data
Candle rsi_candles = candle_array(ta.rsi(close, 14))
// Calculate indicator values based on candle properties
float signal = ta.ema(rsi_candles.first().source(Source.Close), 9)
// Detect patterns that occur within the bar
bool divergence = close > close and rsi_candles.first().Close < rsi_candles.get(1).Close
2. Working with Custom Timeframes and Plotting
For maximum flexibility when visualizing custom timeframe data:
// Create custom timeframe candles
CandleCTF volume_candles = ctf_candles_array(
source = volume,
candle_type = CandleType.candlestick,
sample_type = SampleType.Time,
number_of_seconds = 60
)
// Convert specific candle properties to float arrays
float volume_closes = volume_candles.candle_ctf_to_float(Source.Close)
// Calculate derived values
float volume_ema = volume_candles.ctf_ema(14)
// Create custom visualization
volume_candles.draw_ctf_candles_time()
volume_ema.draw_ctf_line_time(line_color = color.orange)
3. Creating Hybrid Timeframe Analysis
One powerful application is comparing indicators across multiple timeframes:
// Standard chart timeframe RSI
float chart_rsi = ta.rsi(close, 14)
// Custom 5-second timeframe RSI
CandleCTF ctf_candles = ctf_candles_array(
source = close,
candle_type = CandleType.candlestick,
sample_type = SampleType.Time,
number_of_seconds = 5
)
float fast_rsi_array = ctf_candles.candle_ctf_to_float(Source.Close)
float fast_rsi = fast_rsi_array.first()
// Generate signals based on divergence between timeframes
bool entry_signal = chart_rsi < 30 and fast_rsi > fast_rsi_array.get(1)
Final Notes
This library represents an advanced implementation of real-time data processing within Pine Script's constraints. By creating a reactive programming framework for handling continuous data streams, it enables sophisticated analysis typically only available in dedicated trading platforms.
The design principles employed—including state management, temporal processing, and object-oriented architecture—can serve as patterns for other advanced Pine Script development beyond this specific application.
------------------------
Library "real_time_candles"
A comprehensive library for creating real-time candles with customizable timeframes and sampling methods.
Supports both chart-time and custom-time candles with options for candlestick and Heikin-Ashi visualization.
Allows for tick-based or time-based sampling with moving average overlay capabilities.
get_tick(source, na_replace)
Captures the current price as a tick data point
Parameters:
source (float) : Optional - Price source to sample (defaults to close)
na_replace (float) : Optional - Value to use when source is na
Returns: TickData structure containing price, time since last update, and sequential index
candle_array(source, candle_type, sync_start, bullish_color, bearish_color)
Creates an array of candles based on price updates
Parameters:
source (float) : Optional - Price source to sample (defaults to close)
candle_type (simple CandleType) : Optional - Type of candle chart to create (candlestick or Heikin-Ashi)
sync_start (simple bool) : Optional - Whether to synchronize with the start of a new bar
bullish_color (color) : Optional - Color for bullish candles
bearish_color (color) : Optional - Color for bearish candles
Returns: Array of Candle objects ordered with most recent at index 0
candle_series(source, candle_type, wait_for_sync, bullish_color, bearish_color)
Provides a single candle based on the latest price data
Parameters:
source (float) : Optional - Price source to sample (defaults to close)
candle_type (simple CandleType) : Optional - Type of candle chart to create (candlestick or Heikin-Ashi)
wait_for_sync (simple bool) : Optional - Whether to wait for a new bar before starting
bullish_color (color) : Optional - Color for bullish candles
bearish_color (color) : Optional - Color for bearish candles
Returns: A single Candle object representing the current state
candle_tuple(source, candle_type, wait_for_sync, bullish_color, bearish_color)
Provides candle data as a tuple of OHLC values
Parameters:
source (float) : Optional - Price source to sample (defaults to close)
candle_type (simple CandleType) : Optional - Type of candle chart to create (candlestick or Heikin-Ashi)
wait_for_sync (simple bool) : Optional - Whether to wait for a new bar before starting
bullish_color (color) : Optional - Color for bullish candles
bearish_color (color) : Optional - Color for bearish candles
Returns: Tuple representing current candle values
method source(self, source, na_replace)
Extracts a specific price component from a Candle
Namespace types: Candle
Parameters:
self (Candle)
source (series Source) : Type of price data to extract (Open, High, Low, Close, or composite values)
na_replace (float) : Optional - Value to use when source value is na
Returns: The requested price value from the candle
method source(self, source)
Extracts a specific price component from a CandleCTF
Namespace types: CandleCTF
Parameters:
self (CandleCTF)
source (simple Source) : Type of price data to extract (Open, High, Low, Close, or composite values)
Returns: The requested price value from the candle as a varip
method candle_ctf_to_float(self, source)
Converts a specific price component from each CandleCTF to a float array
Namespace types: array
Parameters:
self (array)
source (simple Source) : Optional - Type of price data to extract (defaults to Close)
Returns: Array of float values extracted from the candles, ordered with most recent at index 0
method ctf_ema(self, ema_period)
Calculates an Exponential Moving Average for a CandleCTF array
Namespace types: array
Parameters:
self (array)
ema_period (simple float) : Period for the EMA calculation
Returns: Array of float values representing the EMA of the candle data, ordered with most recent at index 0
method draw_ctf_candles_time(self, sample_type, number_of_ticks, number_of_seconds, timezone)
Renders custom timeframe candles using bar time coordinates
Namespace types: array
Parameters:
self (array)
sample_type (simple SampleType) : Optional - Method for sampling data (Time or Ticks), used for tooltips
number_of_ticks (simple int) : Optional - Number of ticks per candle (used when sample_type is Ticks), used for tooltips
number_of_seconds (simple float) : Optional - Time duration per candle in seconds (used when sample_type is Time), used for tooltips
timezone (simple int) : Optional - Timezone offset from UTC (-12 to +12), used for tooltips
Returns: void - Renders candles on the chart using time-based x-coordinates
method draw_ctf_candles_index(self, sample_type, number_of_ticks, number_of_seconds, timezone)
Renders custom timeframe candles using bar index coordinates
Namespace types: array
Parameters:
self (array)
sample_type (simple SampleType) : Optional - Method for sampling data (Time or Ticks), used for tooltips
number_of_ticks (simple int) : Optional - Number of ticks per candle (used when sample_type is Ticks), used for tooltips
number_of_seconds (simple float) : Optional - Time duration per candle in seconds (used when sample_type is Time), used for tooltips
timezone (simple int) : Optional - Timezone offset from UTC (-12 to +12), used for tooltips
Returns: void - Renders candles on the chart using index-based x-coordinates
method draw_ctf_line_time(self, source, line_size, line_color)
Renders a line representing a price component from the candles using time coordinates
Namespace types: array
Parameters:
self (array)
source (simple Source) : Optional - Type of price data to extract (defaults to Close)
line_size (simple int) : Optional - Width of the line
line_color (simple color) : Optional - Color of the line
Returns: void - Renders a connected line on the chart using time-based x-coordinates
method draw_ctf_line_time(self, line_size, line_color)
Renders a line from a varip float array using time coordinates
Namespace types: array
Parameters:
self (array)
line_size (simple int) : Optional - Width of the line, defaults to 2
line_color (simple color) : Optional - Color of the line
Returns: void - Renders a connected line on the chart using time-based x-coordinates
method draw_ctf_line_index(self, source, line_size, line_color)
Renders a line representing a price component from the candles using index coordinates
Namespace types: array
Parameters:
self (array)
source (simple Source) : Optional - Type of price data to extract (defaults to Close)
line_size (simple int) : Optional - Width of the line
line_color (simple color) : Optional - Color of the line
Returns: void - Renders a connected line on the chart using index-based x-coordinates
method draw_ctf_line_index(self, line_size, line_color)
Renders a line from a varip float array using index coordinates
Namespace types: array
Parameters:
self (array)
line_size (simple int) : Optional - Width of the line, defaults to 2
line_color (simple color) : Optional - Color of the line
Returns: void - Renders a connected line on the chart using index-based x-coordinates
plot_ctf_tick_candles(source, candle_type, number_of_ticks, timezone, tied_open, ema_period, bullish_color, bearish_color, line_width, ema_color, use_time_indexing)
Plots tick-based candles with moving average
Parameters:
source (float) : Input price source to sample
candle_type (simple CandleType) : Type of candle chart to display
number_of_ticks (simple int) : Number of ticks per candle
timezone (simple int) : Timezone offset from UTC (-12 to +12)
tied_open (simple bool) : Whether to tie open price to close of previous candle
ema_period (simple float) : Period for the exponential moving average
bullish_color (color) : Optional - Color for bullish candles
bearish_color (color) : Optional - Color for bearish candles
line_width (simple int) : Optional - Width of the moving average line, defaults to 2
ema_color (color) : Optional - Color of the moving average line
use_time_indexing (simple bool) : Optional - When true the function will plot with xloc.time, when false it will plot using xloc.bar_index
Returns: void - Creates visual candle chart with EMA overlay
plot_ctf_tick_candles(source, candle_type, number_of_ticks, timezone, tied_open, bullish_color, bearish_color, use_time_indexing)
Plots tick-based candles without moving average
Parameters:
source (float) : Input price source to sample
candle_type (simple CandleType) : Type of candle chart to display
number_of_ticks (simple int) : Number of ticks per candle
timezone (simple int) : Timezone offset from UTC (-12 to +12)
tied_open (simple bool) : Whether to tie open price to close of previous candle
bullish_color (color) : Optional - Color for bullish candles
bearish_color (color) : Optional - Color for bearish candles
use_time_indexing (simple bool) : Optional - When true the function will plot with xloc.time, when false it will plot using xloc.bar_index
Returns: void - Creates visual candle chart without moving average
plot_ctf_time_candles(source, candle_type, number_of_seconds, timezone, tied_open, ema_period, bullish_color, bearish_color, line_width, ema_color, use_time_indexing)
Plots time-based candles with moving average
Parameters:
source (float) : Input price source to sample
candle_type (simple CandleType) : Type of candle chart to display
number_of_seconds (simple float) : Time duration per candle in seconds
timezone (simple int) : Timezone offset from UTC (-12 to +12)
tied_open (simple bool) : Whether to tie open price to close of previous candle
ema_period (simple float) : Period for the exponential moving average
bullish_color (color) : Optional - Color for bullish candles
bearish_color (color) : Optional - Color for bearish candles
line_width (simple int) : Optional - Width of the moving average line, defaults to 2
ema_color (color) : Optional - Color of the moving average line
use_time_indexing (simple bool) : Optional - When true the function will plot with xloc.time, when false it will plot using xloc.bar_index
Returns: void - Creates visual candle chart with EMA overlay
plot_ctf_time_candles(source, candle_type, number_of_seconds, timezone, tied_open, bullish_color, bearish_color, use_time_indexing)
Plots time-based candles without moving average
Parameters:
source (float) : Input price source to sample
candle_type (simple CandleType) : Type of candle chart to display
number_of_seconds (simple float) : Time duration per candle in seconds
timezone (simple int) : Timezone offset from UTC (-12 to +12)
tied_open (simple bool) : Whether to tie open price to close of previous candle
bullish_color (color) : Optional - Color for bullish candles
bearish_color (color) : Optional - Color for bearish candles
use_time_indexing (simple bool) : Optional - When true the function will plot with xloc.time, when false it will plot using xloc.bar_index
Returns: void - Creates visual candle chart without moving average
plot_ctf_candles(source, candle_type, sample_type, number_of_ticks, number_of_seconds, timezone, tied_open, ema_period, bullish_color, bearish_color, enable_ema, line_width, ema_color, use_time_indexing)
Unified function for plotting candles with comprehensive options
Parameters:
source (float) : Input price source to sample
candle_type (simple CandleType) : Optional - Type of candle chart to display
sample_type (simple SampleType) : Optional - Method for sampling data (Time or Ticks)
number_of_ticks (simple int) : Optional - Number of ticks per candle (used when sample_type is Ticks)
number_of_seconds (simple float) : Optional - Time duration per candle in seconds (used when sample_type is Time)
timezone (simple int) : Optional - Timezone offset from UTC (-12 to +12)
tied_open (simple bool) : Optional - Whether to tie open price to close of previous candle
ema_period (simple float) : Optional - Period for the exponential moving average
bullish_color (color) : Optional - Color for bullish candles
bearish_color (color) : Optional - Color for bearish candles
enable_ema (bool) : Optional - Whether to display the EMA overlay
line_width (simple int) : Optional - Width of the moving average line, defaults to 2
ema_color (color) : Optional - Color of the moving average line
use_time_indexing (simple bool) : Optional - When true the function will plot with xloc.time, when false it will plot using xloc.bar_index
Returns: void - Creates visual candle chart with optional EMA overlay
ctf_candles_array(source, candle_type, sample_type, number_of_ticks, number_of_seconds, tied_open, bullish_color, bearish_color)
Creates an array of custom timeframe candles without rendering them
Parameters:
source (float) : Input price source to sample
candle_type (simple CandleType) : Type of candle chart to create (candlestick or Heikin-Ashi)
sample_type (simple SampleType) : Method for sampling data (Time or Ticks)
number_of_ticks (simple int) : Optional - Number of ticks per candle (used when sample_type is Ticks)
number_of_seconds (simple float) : Optional - Time duration per candle in seconds (used when sample_type is Time)
tied_open (simple bool) : Optional - Whether to tie open price to close of previous candle
bullish_color (color) : Optional - Color for bullish candles
bearish_color (color) : Optional - Color for bearish candles
Returns: Array of CandleCTF objects ordered with most recent at index 0
Candle
Structure representing a complete candle with price data and display properties
Fields:
Open (series float) : Opening price of the candle
High (series float) : Highest price of the candle
Low (series float) : Lowest price of the candle
Close (series float) : Closing price of the candle
polarity (series bool) : Boolean indicating if candle is bullish (true) or bearish (false)
series_index (series int) : Sequential index identifying the candle in the series
candle_color (series color) : Color to use when rendering the candle
ready (series bool) : Boolean indicating if candle data is valid and ready for use
TickData
Structure for storing individual price updates
Fields:
price (series float) : The price value at this tick
time_delta (series float) : Time elapsed since the previous tick in milliseconds
series_index (series int) : Sequential index identifying this tick
CandleCTF
Structure representing a custom timeframe candle with additional time metadata
Fields:
Open (series float) : Opening price of the candle
High (series float) : Highest price of the candle
Low (series float) : Lowest price of the candle
Close (series float) : Closing price of the candle
polarity (series bool) : Boolean indicating if candle is bullish (true) or bearish (false)
series_index (series int) : Sequential index identifying the candle in the series
open_time (series int) : Timestamp marking when the candle was opened (in Unix time)
time_delta (series float) : Duration of the candle in milliseconds
candle_color (series color) : Color to use when rendering the candle

UT Bot Alerts – Time Filtered with ExitsThis indicator combines several technical approaches to generate precise entry and exit signals, while incorporating time filters that ensure signals are sent only during desired time windows and with defined cooldown periods. It is based on the original idea by QuantNomad.
Main Components:
ATR-based Trailing Stop:
Using the Average True Range (ATR) and an adjustable multiplier ("Key Value"), a dynamic trailing stop is calculated that adapts to the current price. This trailing stop forms the basis for the signal generation.
EMA-based Entry Signals:
A very short exponential moving average (EMA, period 1) is used in combination with the trailing stop to identify clear buy (long) and sell (short) signals via crossovers. An additional buffer zone helps reduce false signals.
Persistent Trade State:
The current state (long, short, or neutral) is maintained so that the system remains in the trend until a new signal is generated.
Linear Regression as Reference:
A linear regression line computed over a defined period serves as a reference for determining exit levels.
Exit Signals with Delay:
Exit signals are generated when the price deviates from the linear regression line by a defined percentage (Exit Signal Deviation) and the condition persists for at least a specified number of bars (Exit Signal Delay). Only one exit signal is issued per trade to avoid excessive exits.
Time Filters and Cooldown:
Session Filter: A user-defined session (e.g., "2200-0500") can disable signals during specified periods.
Cooldown Period: After a signal is triggered, a cooldown phase (in minutes) can be set during which no new signals are sent.
Visual Display and Alerts:
Entry Signals: Buy and sell signals are displayed as labels (green for long, red for short).
Exit Signals: Exit signals appear as triangles, with the exit long signal text displayed in white.
Reference Lines:
The upper exit level (Exit Short Level) is drawn as a solid line in turquoise (color.aqua).
The lower exit level (Exit Long Level) is drawn as a solid line in yellow.
Additionally, the ATR trailing stop and the linear regression line are clearly plotted on the chart.
Alerts can be configured for all signal types.
In Summary:
The indicator delivers precise entry signals based on an ATR trailing stop and a short EMA, supplemented by dynamic exit levels determined via linear regression. With integrated time filters (session and cooldown) and a flexible exit mechanism, this indicator offers controlled trade management—ideal for traders who wish to receive signals only during desired time periods.
Original Author: QuantNomad

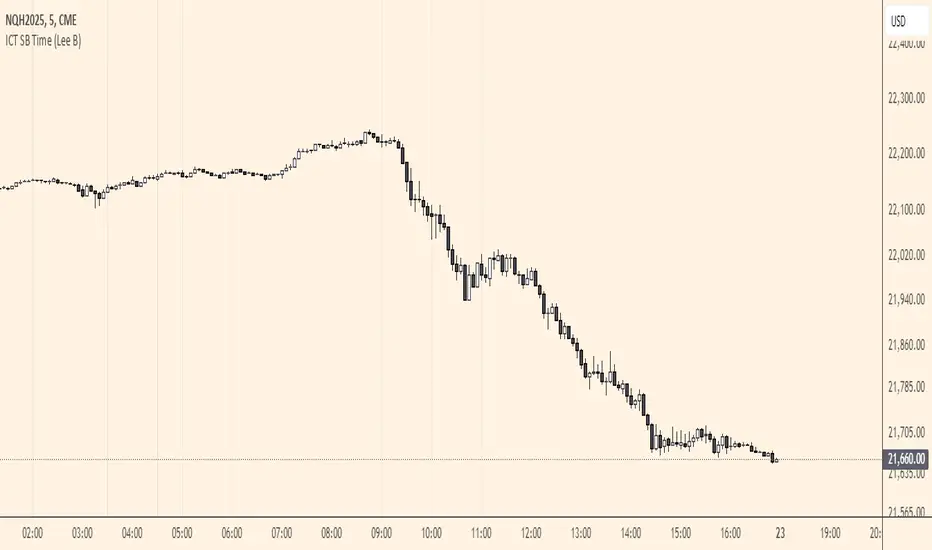
ICT SB Time (Lee B)A minimal and clean indicator that simply plots the ICT Silver Bullet time windows for you on the chart with vertical lines.
It also has the option to show other important times, like 00:00, 8:30, and 9:30. Toggles in settings let you change line color, turn any of them off temporarily, and can limit their visibility to only the lower timeframes for less clutter.
I hope you find this indicator useful... and happy trading!
Lee B
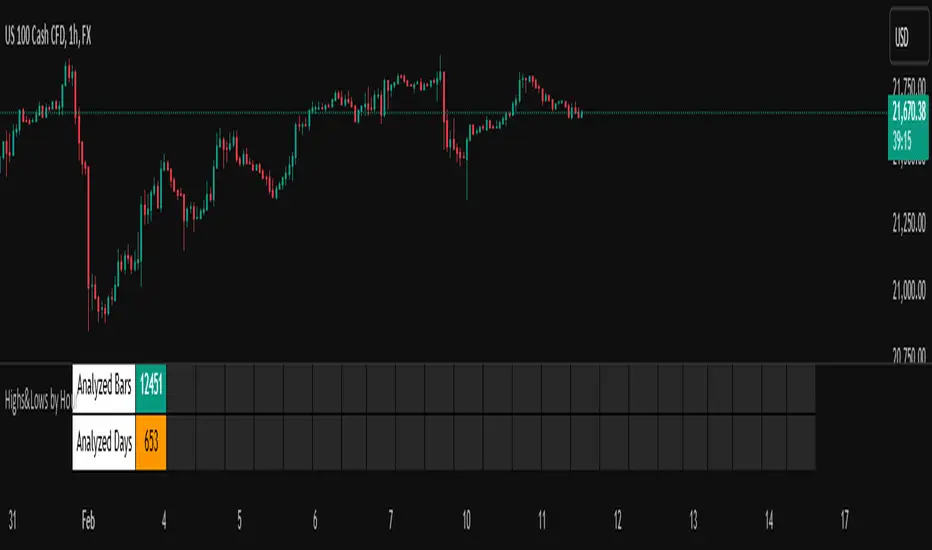
Highs&Lows by HourHighs & Lows by Hour
Description:
Highs & Lows by Hour is a TradingView indicator that helps traders identify the most frequent hours at which daily high and low price points occur. By analyzing historical price data directly from the TradingView chart, this tool provides valuable insights into market timing, allowing traders to optimize their strategies around key price movements.
This indicator is specifically designed for the one-hour (H1) timeframe . It does not display any data on other timeframes , as it relies on analyzing daily highs and lows within hourly periods.
This indicator processes the available data based on the number of historical bars loaded in the TradingView chart. The number of analyzed bars depends on the TradingView subscription plan , which determines how much historical data is accessible.
Key Features:
Works exclusively on the H1 timeframe , ensuring accurate analysis of daily highs and lows
Hourly highs and lows analysis to identify the most frequent hours when the market reaches its daily high and low
Sorted by frequency, displaying the most significant trading hours in descending order based on their recurrence
Customizable table and colors to fit the chart theme and trading style
Useful for scalpers, day traders, and swing traders to anticipate potential price reversals and breakouts
How It Works:
The indicator scans historical price data directly from the TradingView chart to detect the hour at which daily highs and daily lows occur.
It counts the frequency of highs and lows for each hour of the trading day based on the number of available bars in the TradingView chart.
The recorded data is displayed in a structured table, sorted by frequency from highest to lowest.
Users can customize colors to enhance readability and seamlessly integrate the indicator into their analysis.
Why Use This Indicator?
Identify key market patterns by recognizing the most critical hours when price extremes tend to form
Improve timing for trades by aligning entries and exits with high-probability time windows
Enhance market awareness by understanding when market volatility is likely to peak based on historical trends
Important Notes:
This indicator works only on the one-hour (H1) timeframe . It will not display any data on other timeframes
Works well on Forex, stocks, crypto, and futures , especially for intraday traders
The indicator analyzes only the historical bars available on the TradingView chart, which varies depending on the TradingView subscription plan (Free, Pro, Pro+, Premium)
This indicator does not generate buy or sell signals but serves as a data-driven tool for market analysis
How to Use:
Apply the Highs & Lows by Hour indicator to a one-hour (H1) chart on TradingView
Review the table displaying the most frequent hours for daily highs and lows
Adjust colors and settings for better visualization
Use the data to refine trading decisions and align strategy with historical price behavior
Killzones & Previous High-Low Liquidity [odnac]This indicator is designed for use in intraday trading to visualize key "Killzones" (specific time windows during different global market sessions) and highlight liquidity levels based on previous highs and lows from the previous day and week.
It helps traders identify potential market entry and exit points based on time-based trading zones and price action levels.
Key Features:
Killzone (Market Session Timeframes):
Asia (2000-0000 UTC): Displays a shaded box over the Asia trading session.
Europe (0200-0500 UTC): Highlights the European trading session.
New York AM (0830-1100 UTC): Represents the morning session of the NY market.
New York PM (1330-1600 UTC): Represents the afternoon session of the NY market.
Each of these timeframes can be customized in terms of session start and end times, and the shaded areas will help identify high liquidity periods when the market tends to be more active.
Previous High-Low Liquidity Zones:
Previous Week's High/Low: Displays lines at the high and low of the previous week.
These are important liquidity levels that can influence price action.
Previous Day's High/Low: Shows the high and low from the previous trading day.
These are also significant levels to watch for potential support and resistance.
Filters and Customization:
Position Filtering: The indicator allows users to filter out previous highs or lows if the current price doesn't align with those levels.
For example, it can filter out previous week highs if the current price is lower than that level.
Vertical Lines: Optional vertical lines to highlight key time points such as the start and end of the previous week and day.
How It Works:
The indicator visually draws "killzones" as shaded regions on the chart, indicating periods of increased market activity.
This can help traders align their strategies with the most liquid periods of the day.
The previous high and low lines (both for the previous week and the previous day) are drawn as solid lines and can be toggled on/off in the settings.
Labels are added to indicate the specific levels and periods.
The indicator provides clear visual cues, helping traders assess if the price is near important liquidity levels and whether the current market conditions align with those levels.
Customizable Settings:
You can control whether each Killzone and liquidity level is shown on the chart.
Color customization for the various zones and lines is also available.
The indicator also lets you decide whether to hide weekend data, set time-frame limits, and choose whether or not to show vertical lines at the beginning and end of each trading session.
This indicator is aimed at traders who want to trade based on high-liquidity periods and understand where key support and resistance levels are likely to emerge based on previous price action.

ICT Killzones + Macros [TakingProphets]The ICT Killzones indicator is a powerful tool designed to visualize key trading sessions and market timing elements used in ICT (Inner Circle Trader) methodology. It includes:
• Session Markers:
- Asia Session
- London Session
- NY AM Session
- NY Lunch Session
- NY PM Session
• Key Price Levels:
- Session high/low levels that extend until violated
- Midnight Open price level (dotted line)
- True Day Open price level (6 PM EST, dotted line)
• ICT Macro Timing:
- First Macro: 9:45 AM - 10:15 AM EST
- Second Macro: 10:45 AM - 11:15 AM EST
- Distinctive L-shaped brackets marking start and end times
Features:
• Fully customizable colors and styles for all elements
• Adjustable label positions and sizes
• Toggle options for each component
• Smart timeframe filtering
• Clean, uncluttered visual design
This indicator helps traders identify key market structure points, session transitions, and optimal trading windows based on ICT concepts.

Johnny's Volatility-Driven Trend Identifier w/ Reversal SignalsJohnny's Volatility-Driven Trend Identifier w/ Reversal Signals is designed to identify high-probability trend shifts and reversals by incorporating volatility, momentum, and impulse-based filtering. It is specifically built for traders who want to capture strong trend movements while minimizing false signals caused by low volatility noise.
By leveraging Rate of Change (ROC), Relative Strength Index (RSI), and Average True Range (ATR)-based volatility detection, the indicator dynamically adapts to market conditions. It highlights breakout trends, reversals, and early signs of momentum shifts using strategically placed labels and color-coded trend visualization.
Inspiration taken from Top G indicator .
What This Indicator Does
The Volatility-Driven Trend Identifier works by:
Measuring Market Extremes & Momentum:
Uses ROC normalization with standard deviation to identify impulse moves in price action.
Implements RSI filtering to determine overbought/oversold conditions that validate trend strength.
Utilizes ATR-based volatility tracking to ensure signals only appear when meaningful market movements are occurring.
Identifying Key Trend Events:
Power Peak (🔥): Marks a confirmed strong downtrend, ideal for shorting opportunities.
Surge (🚀): Indicates a confirmed strong uptrend, signaling a potential long entry.
Soft Surge (↗): Highlights a mild bullish reentry or early uptrend formation.
Soft Peak (↘): Shows a mild bearish reentry or early downtrend formation.
Providing Adaptive Filtering for Reliable Signals:
Filters out weak trends with a volatility check, ensuring signals appear only in strong market conditions.
Implements multi-level confirmation by combining trend strength metrics, preventing false breakouts.
Uses gradient-based visualization to color-code market sentiment for quick interpretation.
What This Indicator Signals
Breakouts & Impulse Moves: 🚀🔥
The Surge (🚀) and Power Peak (🔥) labels indicate confirmed momentum breakouts, where the trend has been validated by a combination of ROC impulse, RSI confirmation, and ATR volatility filtering.
These signals suggest that the market is entering a strong trend, and traders can align their entries accordingly.
Early Trend Formation & Reentries: ↗ ↘
The Soft Surge (↗) and Soft Peak (↘) labels indicate areas where a trend might be forming, but is not yet fully confirmed.
These signals help traders anticipate potential entries before the trend gains full strength.
Volatility-Adaptive Trend Filtering: 📊
Since the indicator only activates in volatile conditions, it avoids the pitfalls of low-range choppy markets where false signals frequently occur.
ATR-driven adaptive windowing allows the indicator to dynamically adjust its sensitivity based on real-time volatility conditions.
How to Use This Indicator
1. Identifying High-Probability Entries
Bullish Entries (Long Trades)
Look for 🚀 Surge signals in an uptrend.
Confirm with RSI (should be above 50 for momentum).
Ensure volatility is increasing to validate the breakout.
Use ↗ Soft Surge signals for early entries before the trend fully confirms.
Bearish Entries (Short Trades)
Look for 🔥 Power Peak signals in a downtrend.
RSI should be below 50, indicating downward momentum.
Volatility should be rising, ensuring market momentum is strong.
Use ↘ Soft Peak signals for early entries before a full bearish confirmation.
2. Avoiding False Signals
Ignore signals when the market is ranging (low ATR).
Check RSI and ROC alignment to ensure trend confirmation.
Use additional confluences (e.g., price action, support/resistance levels, moving averages) for enhanced accuracy.
3. Trend Confirmation & Filtering
The stronger the trend, the higher the likelihood that Surge (🚀) and Power Peak (🔥) signals will continue in their direction.
Soft Surge (↗) and Soft Peak (↘) act as early warning signals before major breakouts occur.
What Makes This a Machine Learning-Inspired Moving Average?
While this indicator is not a direct implementation of machine learning (as Pine Script lacks AI/ML capabilities), it mimics machine learning principles by adapting dynamically to market conditions using the following techniques:
Adaptive Trend Selection:
It does not rely on fixed moving averages but instead adapts dynamically based on volatility expansion and momentum detection.
ATR-based filtering adjusts the indicator’s sensitivity to real-time conditions.
Multi-Factor Confirmation (Feature Engineering Equivalent in ML):
Combines ROC, RSI, and ATR in a structured way, similar to how ML models use multiple inputs to filter and classify data.
Implements conditional trend recognition, ensuring that only valid signals pass through the filter.
Noise Reduction with Data Smoothing:
The algorithm avoids false signals by incorporating trend intensity thresholds, much like how ML models remove outliers to refine predictions.
Adaptive filtering ensures that low-volatility environments do not produce misleading signals.
Why Use This Indicator?
✔ Reduces False Signals: Multi-factor validation ensures only high-confidence signals are triggered.
✔ Works in All Market Conditions: Volatility-adaptive nature allows the indicator to perform well in both trending and ranging markets.
✔ Great for Swing & Intraday Trading: It helps spot momentum shifts early and allows traders to catch major market moves before they fully develop.
✔ Visually Intuitive: Color-coded trends and clear signal markers make it easy to interpret.

Smart Market Bias [PhenLabs]📊 Smart Market Bias Indicator (SMBI)
Version: PineScript™ v6
Description
The Smart Market Bias Indicator (SMBI) is an advanced technical analysis tool that combines multiple statistical approaches to determine market direction and strength. It utilizes complexity analysis, information theory (Kullback Leibler divergence), and traditional technical indicators to provide a comprehensive market bias assessment. The indicator features adaptive parameters based on timeframe and trading style, with real-time visualization through a sophisticated dashboard.
🔧 Components
Complexity Analysis: Measures price movement patterns and trend strength
KL Divergence: Statistical comparison of price distributions
Technical Overlays: RSI and Bollinger Bands integration
Filter System: Volume and trend validation
Visual Dashboard: Dynamic color-coded display of all components
Simultaneous current timeframe + higher time frame analysis
🚨Important Explanation Feature🚨
By hovering over each individual cell in this comprehensive dashboard, you will get a thorough and in depth explanation of what each cells is showing you
Visualization
HTF Visualization
📌 Usage Guidelines
Based on your own trading style you should alter the timeframe length that you would like to be analyzing with your dashboard
The longer the term of the position you are planning on entering the higher timeframe you should have your dashboard set to
Bias Interpretation:
Values > 50% indicate bullish bias
Values < 50% indicate bearish bias
Neutral zone: 45-55% suggests consolidation
✅ Best Practices:
Use appropriate timeframe preset for your trading style
Monitor all components for convergence/divergence
Consider filter strength for signal validation
Use color intensity as confidence indicator
⚠️ Limitations
Requires sufficient historical data for accurate calculations
Higher computational complexity on lower timeframes
May lag during extremely volatile conditions
Best performance during regular market hours
What Makes This Unique
Multi-Component Analysis: Combines complexity theory, statistical analysis, and traditional technical indicators
Adaptive Parameters: Automatically optimizes settings based on timeframe
Triple-Layer Filtering: Uses trend, volume, and minimum strength thresholds
Visual Confidence System: Color intensity indicates signal strength
Multi-Timeframe Capabilities: Allowing the trader to analyze not only their current time frame but also the higher timeframe bias
🔧 How It Works
The indicator processes market data through four main components:
Complexity Score (40% weight): Analyzes price returns and pattern complexity
Kullback Leibler Divergence (30% weight): Compares current and historical price distributions
RSI Analysis (20% weight): Momentum and oversold/overbought conditions
Bollinger Band Position (10% weight): Price position relative to volatility
Underlying Method
Maintains rolling windows of price data for multiple calculations
Applies custom normalization using hyperbolic tangent function
Weights component scores based on reliability and importance
Generates final bias percentage with confidence visualization
💡 Note: For optimal results, use in conjunction with price action analysis and consider multiple timeframe confirmation. The indicator performs best when all components show alignment.

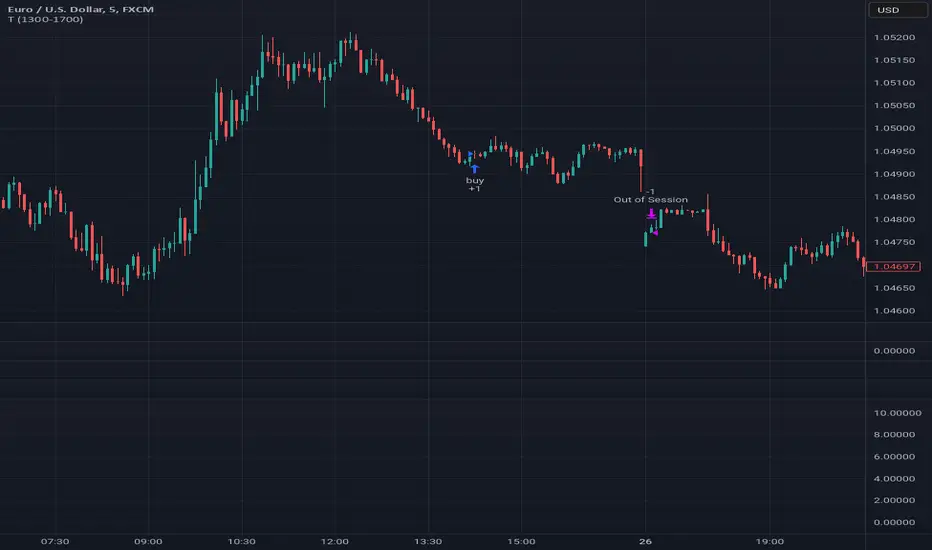
Tutorial - Adding sessions to strategiesA simple script to illustrate how to add sessions to trading strategies.
In this interactive tutorial, you'll learn how to add trading sessions to your strategies using Pine Script. By the end of this session (pun intended!), you'll be able to create custom trading windows that adapt to changing market conditions.
What You'll Learn:
Defining Trading Sessions: Understand how to set up specific time frames for buying and selling, tailored to your unique trading style.
RSI-Based Entry Signals: Discover how to use the Relative Strength Index (RSI) as a trigger for buy and sell signals, helping you capitalize on market trends.
Combining Session Logic with Trading Decisions: Learn how to integrate session-based logic into your strategy, ensuring that trades are executed only during designated times.
By combining these elements, we create an interactive strategy that:
1. Generates buy and sell signals based on RSI levels.
2. Checks if the market is open during a specific trading session (e.g., 1300-1700).
3. Executes trades only when both conditions are met.
**Tips & Variations:**
* Experiment with different RSI periods, thresholds, and sessions to optimize your strategy for various markets and time frames.
* Consider adding more advanced logic, such as stop-losses or position sizing, to further refine your trading approach.
Get ready to take your Pine Script skills to the next level!
~Description partially generated with Llama3_8B
Timed Ranges [mktrader]The Timed Ranges indicator helps visualize price ranges that develop during specific time periods. It's particularly useful for analyzing market behavior in instruments like NASDAQ, S&P 500, and Dow Jones, which often show reactions to sweeps of previous ranges and form reversals.
### Key Features
- Visualizes time-based ranges with customizable lengths (30 minutes, 90 minutes, etc.)
- Tracks high/low range development within specified time periods
- Shows multiple cycles per day for pattern recognition
- Supports historical analysis across multiple days
### Parameters
#### Settings
- **First Cycle (HHMM-HHMM)**: Define the time range of your first cycle. The duration of this range determines the length of all subsequent cycles (e.g., "0930-1000" creates 30-minute cycles)
- **Number of Cycles per Day**: How many consecutive cycles to display after the first cycle (1-20)
- **Maximum Days to Display**: Number of historical days to show the ranges for (1-50)
- **Timezone**: Select the appropriate timezone for your analysis
#### Style
- **Box Transparency**: Adjust the transparency of the range boxes (0-100)
### Usage Example
To track 30-minute ranges starting at market open:
1. Set First Cycle to "0930-1000" (creates 30-minute cycles)
2. Set Number of Cycles to 5 (will show ranges until 11:30)
3. The indicator will display:
- Range development during each 30-minute period
- Visual progression of highs and lows
- Color-coded cycles for easy distinction
### Use Cases
- Identify potential reversal points after range sweeps
- Track regular time-based support and resistance levels
- Analyze market structure within specific time windows
- Monitor range expansions and contractions during key market hours
### Tips
- Use in conjunction with volume analysis for better confirmation
- Pay attention to breaks and sweeps of previous ranges
- Consider market opens and key session times when setting cycles
- Compare range sizes across different time periods for volatility analysis

SW monthly Gann Days**Script Description:**
The script you are looking at is based on the work of W.D. Gann, a famous trader and market analyst in the early 20th century, known for his use of geometry, astrology, and numerology in market analysis. Gann believed that certain days in the market had significant importance, and he observed that markets often exhibited significant price moves around specific dates. These dates were typically associated with cyclical patterns in price movements, and Gann referred to these as "Gann Days."
In this script, we have focused on highlighting certain days of the month that Gann believed to have an influence on market behavior. The specific days in question are the **6th to 7th**, **9th to 10th**, **14th to 15th**, **19th to 20th**, **23rd to 24th**, and **29th to 31st** of each month. These ranges are based on Gann’s theory that there are recurring time cycles in the market that cause turning points or critical price movements to occur around certain days of the month.
### **Why Gann Used These Days:**
1. **Mathematical and Astrological Cycles:**
Gann believed that markets were influenced by natural cycles, and that certain dates (or combinations of dates) played a critical role in the price movements. These specific days are part of his broader theory of "time cycles" where the market would often change direction, reverse, or exhibit significant volatility on particular days. Gann's research was based on both mathematical principles and astrological observations, leading him to assign importance to these days.
2. **Gann's Universal Timing Theory:**
According to Gann, financial markets operate in a universe governed by geometric and astrological principles. These cycles repeat themselves over time, and specific days in a given month correspond to key turning points within these repeating cycles. Gann found that the 6th to 7th, 9th to 10th, 14th to 15th, 19th to 20th, 23rd to 24th, and 29th to 31st often marked significant changes in the market, making them particularly important for traders to watch.
3. **Market Psychology and Sentiment:**
These specific days likely correspond to key moments where market participants tend to react in predictable ways, influenced by past market behavior on similar dates. For example, news events or scheduled economic reports might fall within these time windows, causing the market to respond in a particular way. Gann's method involves using these cyclical patterns to predict turning points in market prices, enabling traders to anticipate when the market might make a reversal or face a significant shift in direction.
4. **Turning Points:**
Gann believed that markets often reversed or encountered critical points around specific dates. This is why he considered certain days more important than others. By identifying and focusing on these days, traders can better anticipate the market’s movement and make more informed trading decisions.
5. **Numerology:**
Gann also utilized numerology in his trading system, believing that numbers, and particularly certain key numbers, had significance in predicting market movements. The days selected in this script may correspond to numerological patterns that Gann identified in his analysis of the markets, such as recurring numbers in his astrological and geometric systems.
### **Purpose of the Script:**
This script highlights these "Gann Days" within a trading chart for 2024 and 2025. The color-coding or background highlighting is intended to draw attention to these dates, so traders can observe the potential for significant market movements during these times. By identifying these specific dates, traders following Gann's theories may gain insights into possible turning points, corrections, or key price movements based on the market's historical behavior around these days.
Overall, Gann’s use of specific days was based on his deep belief in the cyclical nature of the market and his attempt to tie those cycles to the natural laws of time, geometry, and astrology. By focusing on these dates, Gann aimed to give traders an edge in predicting significant market events and price shifts.

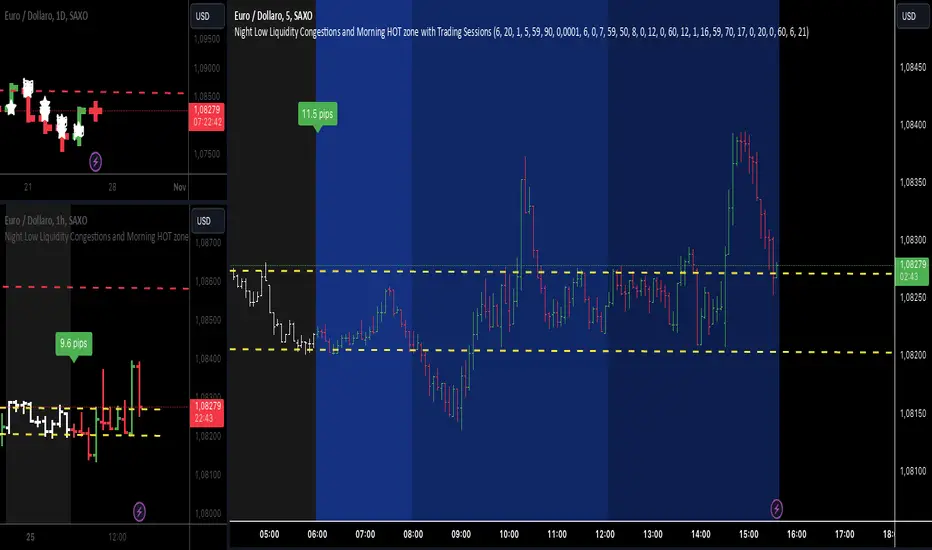
Night Low Liquidity Congestions with 4 Trading SessionsThis indicator is designed to help traders visualize and analyze key market periods of low liquidity during the night and identify high-activity zones in the morning. It also includes customizable time sessions for major global markets, including the European and American sessions, as well as the London Close session.
T he main functionalities include:
- Night Low Liquidity Phase: This highlights periods with typically low market activity during the night (default: 20:01–5:59). It also displays the total range (in pips) during this phase, allowing traders to identify potential price consolidations.
- Morning Hot Zone: This focuses on high-activity periods in the early morning (default: 6:00–7:59), providing visual cues without altering bar colors.
- European Trading Session: Displays the European market’s open hours (default: 8:00–12:00), shaded in blue, to mark increased volatility typically seen during this period.
- American Trading Session: Marks the active hours of the U.S. market (default: 12:01–16:59), where market activity tends to peak.
- London Close Area: Highlights the closing hours of the London market (default: 17:00–20:00), allowing traders to track potential liquidity shifts.
Key Features:
1. Customizable Time Sessions:
- The indicator allows for full customization of the start and end times for each market session, making it adaptable to different instruments and trading style.
- Traders can choose their preferred color and opacity for each time zone to suit their charting preferences.
2. Night Low Liquidity Pip Range Calculation:
- Automatically calculates and displays the pip range for the Night Low Liquidity phase.
- The range is colored red if it exceeds the specified threshold and green if it remains below it.
3. Alarm System:
- Customizable alerts for H1, M15, and M5 timeframes.
- Traders can set alerts to trigger just before a bar closes during specific sessions (European, American, or London Close) and on selected days of the week (Monday–Friday).
- The alarm system allows for full customization of active hours and days, giving traders full control over their notifications.
4. Clear Visual Cues:
- The indicator uses transparent shading to differentiate market sessions, making it easy to spot different phases of the trading day.
- Each session is visually distinct and can be toggled on or off based on trader preferences.
Ideal For:
- Traders who focus on intraday strategies and want to understand how market sessions affect liquidity and volatility.
- Those looking to trade during specific time windows like the Night Low Liquidity or Morning Hot Zones.
- Traders who need to automate their alerts based on specific market hours and close events for major timeframes.
Time Vertical LinesVLines - Time-Based Vertical Lines with Zones
This PineScript indicator creates vertical time lines with customizable zones between them. Perfect for marking trading sessions, key market times, or any time-based analysis.
Key Features:
- 5 configurable time lines
- 3 customizable zones (between lines 1-2, 2-3, and 4-5)
- Each zone features:
- Background shading
- Horizontal lines at high/low points
- Independent color controls
- Adjustable line styles and widths
- Time zone offset adjustment
- Option to show/hide historical lines
Installation Instructions:
1. Open TradingView's Pine Script Editor
2. Create a new script
3. Copy and paste the entire code
4. Add to Chart
Setup Guide:
1. Time Zone Adjustment:
- Find the "Time Zone Offset (Hours)" setting
- Adjust if lines appear at wrong times
- Example: If lines appear 3 hours early, set offset to 3
2. Basic Time Lines (1-3):
- Each line has settings for:
- Hour (0-23)
- Minute (0-59)
- Color
- Show/Hide toggle
3. Session Lines (4-5):
- Special lines typically used for session marking
- Same settings as basic lines
- Default red color to distinguish from other lines
4. Zone Customization:
Three separate zones are available:
- Zone 1-2 (between first and second lines)
- Zone 2-3 (between second and third lines)
- Zone 4-5 (between fourth and fifth lines)
Each zone can be customized with:
- Background color and transparency
- Horizontal line color
- Line style (Solid/Dashed/Dotted)
- Line width
- Individual show/hide toggles for zone and lines
5. Additional Settings:
- "Show Historical Lines" - toggle to show/hide lines on previous days
- Global line style and width settings for vertical lines
Suggested Uses:
1. Mark pre-market, market, and post-market sessions
2. Highlight specific trading windows
3. Track time-based support/resistance levels
4. Monitor price ranges during specific time periods
Tips:
- Start by setting just one zone to get familiar with the controls
- Use different colors for different sessions/time periods
- Adjust transparency to maintain chart visibility
- Use the show/hide toggles to focus on specific times
- The horizontal lines automatically mark the high/low range between time points

Williams %R StrategyThe Williams %R Strategy implemented in Pine Script™ is a trading system based on the Williams %R momentum oscillator. The Williams %R indicator, developed by Larry Williams in 1973, is designed to identify overbought and oversold conditions in a market, helping traders time their entries and exits effectively (Williams, 1979). This particular strategy aims to capitalize on short-term price reversals in the S&P 500 (SPY) by identifying extreme values in the Williams %R indicator and using them as trading signals.
Strategy Rules:
Entry Signal:
A long position is entered when the Williams %R value falls below -90, indicating an oversold condition. This threshold suggests that the market may be near a short-term bottom, and prices are likely to reverse or rebound in the short term (Murphy, 1999).
Exit Signal:
The long position is exited when:
The current close price is higher than the previous day’s high, or
The Williams %R indicator rises above -30, indicating that the market is no longer oversold and may be approaching an overbought condition (Wilder, 1978).
Technical Analysis and Rationale:
The Williams %R is a momentum oscillator that measures the level of the close relative to the high-low range over a specific period, providing insight into whether an asset is trading near its highs or lows. The indicator values range from -100 (most oversold) to 0 (most overbought). When the value falls below -90, it indicates an oversold condition where a reversal is likely (Achelis, 2000). This strategy uses this oversold threshold as a signal to initiate long positions, betting on mean reversion—an established principle in financial markets where prices tend to revert to their historical averages (Jegadeesh & Titman, 1993).
Optimization and Performance:
The strategy allows for an adjustable lookback period (between 2 and 25 days) to determine the range used in the Williams %R calculation. Empirical tests show that shorter lookback periods (e.g., 2 days) yield the most favorable outcomes, with profit factors exceeding 2. This finding aligns with studies suggesting that shorter timeframes can effectively capture short-term momentum reversals (Fama, 1970; Jegadeesh & Titman, 1993).
Scientific Context:
Mean Reversion Theory: The strategy’s core relies on mean reversion, which suggests that prices fluctuate around a mean or average value. Research shows that such strategies, particularly those using oscillators like Williams %R, can exploit these temporary deviations (Poterba & Summers, 1988).
Behavioral Finance: The overbought and oversold conditions identified by Williams %R align with psychological factors influencing trading behavior, such as herding and panic selling, which often create opportunities for price reversals (Shiller, 2003).
Conclusion:
This Williams %R-based strategy utilizes a well-established momentum oscillator to time entries and exits in the S&P 500. By targeting extreme oversold conditions and exiting when these conditions revert or exceed historical ranges, the strategy aims to capture short-term gains. Scientific evidence supports the effectiveness of short-term mean reversion strategies, particularly when using indicators sensitive to momentum shifts.
References:
Achelis, S. B. (2000). Technical Analysis from A to Z. McGraw Hill.
Fama, E. F. (1970). Efficient Capital Markets: A Review of Theory and Empirical Work. The Journal of Finance, 25(2), 383-417.
Jegadeesh, N., & Titman, S. (1993). Returns to Buying Winners and Selling Losers: Implications for Stock Market Efficiency. The Journal of Finance, 48(1), 65-91.
Murphy, J. J. (1999). Technical Analysis of the Financial Markets: A Comprehensive Guide to Trading Methods and Applications. New York Institute of Finance.
Poterba, J. M., & Summers, L. H. (1988). Mean Reversion in Stock Prices: Evidence and Implications. Journal of Financial Economics, 22(1), 27-59.
Shiller, R. J. (2003). From Efficient Markets Theory to Behavioral Finance. Journal of Economic Perspectives, 17(1), 83-104.
Williams, L. (1979). How I Made One Million Dollars… Last Year… Trading Commodities. Windsor Books.
Wilder, J. W. (1978). New Concepts in Technical Trading Systems. Trend Research.
This explanation provides a scientific and evidence-based perspective on the Williams %R trading strategy, aligning it with fundamental principles in technical analysis and behavioral finance.

HTFBands█ OVERVIEW
Contains type and methods for drawing higher-timeframe bands of several types:
Bollinger bands
Parabolic SAR
Supertrend
VWAP
By copy pasting ready made code sections to your script you can add as many multi-timeframe bands as necessary.
█ HOW TO USE
Please see instructions in the code. (Important: first fold all sections of the script: press Cmd + K then Cmd + - (for Windows Ctrl + K then Ctrl + -)
█ FULL LIST OF FUNCTIONS AND PARAMETERS
atr2(length)
An alternate ATR function to the `ta.atr()` built-in, which allows a "series float"
`length` argument.
Parameters:
length (float) : (series int/float) Length for the smoothing parameter calculation.
Returns: (float) The ATR value.
pine_supertrend2(factor, atrLength, wicks)
An alternate SuperTrend function to `supertrend()`, which allows a "series float"
`atrLength` argument.
Parameters:
factor (float) : (series int/float) Multiplier for the ATR value.
atrLength (float) : (series int/float) Length for the ATR smoothing parameter calculation.
wicks (simple bool) : (simple bool) Condition to determine whether to take candle wicks into account when
reversing trend, or to use the close price. Optional. Default is false.
Returns: ( ) A tuple of the superTrend value and trend direction.
method getDefaultBandQ1(bandType)
For a given BandType returns its default Q1
Namespace types: series BandTypes
Parameters:
bandType (series BandTypes)
method getDefaultBandQ2(bandType)
For a given BandType returns its default Q2
Namespace types: series BandTypes
Parameters:
bandType (series BandTypes)
method getDefaultBandQ3(bandType)
For a given BandType returns its default Q3
Namespace types: series BandTypes
Parameters:
bandType (series BandTypes)
method init(this, bandsType, q1, q2, q3, vwapAnchor)
Initiates RsParamsBands for each band (used in htfUpdate() withi req.sec())
Namespace types: RsParamsBands
Parameters:
this (RsParamsBands)
bandsType (series BandTypes)
q1 (float) : (float) Depending on type: BB - length, SAR - AF start, ST - ATR's prd
q2 (float) : (float) Depending on type: BB - StdDev mult, SAR - AF step, ST - mult
q3 (float) : (float) Depending on type: BB - not used, SAR - AF max, ST - not used
vwapAnchor (series VwapAnchors) : (VwapAnchors) VWAP ahcnor
method init(this, bandsType, tf, showRecentBars, lblsShow, lblsMaxLabels, lblSize, lnMidClr, lnUpClr, lnLoClr, fill, fillClr, lnWidth, lnSmoothen)
Initialises object with params (incl. input). Creates arrays if any.
Namespace types: HtfBands
Parameters:
this (HtfBands)
bandsType (series BandTypes) : (BandTypes) Just used to enable/disable - if BandTypes.none then disable )
tf (string) : (string) Timeframe
showRecentBars (int) : (int) Only show over this number of recent bars
lblsShow (bool) : (bool) Show labels
lblsMaxLabels (int) : (int) Max labels to show
lblSize (string) : (string) Size of the labels
lnMidClr (color) : (color) Middle band color
lnUpClr (color) : (color) Upper band color
lnLoClr (color) : (color) Lower band color
fill (bool)
fillClr (color) : (color) Fill color
lnWidth (int) : (int) Line width
lnSmoothen (bool) : (bool) Smoothen the bands
method htfUpdateTuple(rsPrms, repaint)
(HTF) Calculates Bands within request.security(). Returns tuple . If any or all of the bands are not available returns na as their value.
Namespace types: RsParamsBands
Parameters:
rsPrms (RsParamsBands) : (RsParamsBands) Parameters of the band.
repaint (bool) : (bool) If true does not update on realtime bars.
Returns: A tuple (corresponds to fields in RsReturnBands)
method importRsRetTuple(this, htfBi, mid, up, lo, dir)
Imports a tuple returned from req.sec() into an HtfBands object
Namespace types: HtfBands
Parameters:
this (HtfBands) : (HtfBands) Object to import to
htfBi (int) : (float) Higher timeframe's bar index (Default = na)
mid (float)
up (float) : (float) Value of upper band (Default = na)
lo (float) : (float) Value of lower band (Default = na)
dir (int) : (int) Direction (for bands like Parabolic SAR) (Default = na)
method addUpdDrawings(this, rsPrms)
Draws band's labels
Namespace types: HtfBands
Parameters:
this (HtfBands)
rsPrms (RsParamsBands)
method update(this)
Sets band's values to na on intrabars if `smoothen` is set.
Namespace types: HtfBands
Parameters:
this (HtfBands)
method newRsParamsBands(this)
A wraper for RsParamsBands.new()
Namespace types: LO_A
Parameters:
this (LO_A)
method newHtfBands(this)
A wraper for HtfBands.new()
Namespace types: LO_B
Parameters:
this (LO_B)
RsParamsBands
Used to pass bands' params to req.sec()
Fields:
bandsType (series BandTypes) : (enum BandTypes) Type of the band (BB, SAR etc.)
q1 (series float) : (float) Depending on type: BB - length, SAR - AF start, ST - ATR's prd
q2 (series float) : (float) Depending on type: BB - StdDev mult, SAR - AF step, ST - mult
q3 (series float) : (float) Depending on type: BB - not used, SAR - AF max, ST - not used
vwapAnchor (series VwapAnchors)
RsReturnBands
Used to return bands' data from req.sec(). Params of the bands are in RsParamsBands
Fields:
htfBi (series float) : (float) Higher timeframe's bar index (Default = na)
upBand (series float) : (float) Value of upper band (Default = na)
loBand (series float) : (float) Value of lower band (Default = na)
midBand (series float) : (float) Value of middle band (Default = na)
dir (series int) : (float) Direction (for bands like Parabolic SAR) (Default = na)
BandsDrawing
Contains plot visualization parameters and stores and keeps track of lines, labels and other visual objects (not plots)
Fields:
lnMidClr (series color) : (color) Middle band color
lnLoClr (series color) : (color) Lower band color
lnUpClr (series color) : (color) Upper band color
fillUpClr (series color)
fillLoClr (series color)
lnWidth (series int) : (int) Line width
lnSmoothen (series bool) : (bool) Smoothen the bands
showHistory (series bool) : (bool) If true show bands lines, otherwise only current level
showRecentBars (series int) : (int) Only show over this number of recent bars
arLbl (array) : (label Labels
lblsMaxLabels (series int) : (int) Max labels to show
lblsShow (series bool) : (bool) Show labels
lblSize (series string) : (string) Size of the labels
HtfBands
Calcs and draws HTF bands
Fields:
rsRet (RsReturnBands) : (RsReturnBands) Bands' values
rsRetNaObj (RsReturnBands) : (RsReturnBands) Dummy na obj for returning from request.security()
rsPrms (RsParamsBands) : (RsParamsBands) Band parameters (for htfUpdate() called in req.sec() )
drw (BandsDrawing) : (BandsDrawing) Contains plot visualization parameters and stores and keeps track of lines, labels and other visual objects (not plots)
enabled (series bool) : (bool) Toggles bands on/off
tf (series string) : (string) Timeframe
LO_A
LO Library object, whose only purpose is to serve as a shorthand for library name in script code.
Fields:
dummy (series string)
LO_B
LO Library object, whose only purpose is to serve as a shorthand for library name in script code.
Fields:
dummy (series string)

HTFMAs█ OVERVIEW
Contains a type HTFMA used to return data on six moving averages from a higher timeframe.
Several types of MA's are supported.
█ HOW TO USE
Please see instructions in the code (in library description). (Important: first fold all sections of the script: press Cmd + K then Cmd + - (for Windows Ctrl + K then Ctrl + -)
█ FULL LIST OF FUNCTIONS AND PARAMETERS
method getMaType(this)
Enumerator function, given a key returns `enum MaTypes` value
Namespace types: series string, simple string, input string, const string
Parameters:
this (string)
method init(this, enableAll, ma1Enabled, ma1MaType, ma1Src, ma1Prd, ma2Enabled, ma2MaType, ma2Src, ma2Prd, ma3Enabled, ma3MaType, ma3Src, ma3Prd, ma4Enabled, ma4MaType, ma4Src, ma4Prd, ma5Enabled, ma5MaType, ma5Src, ma5Prd, ma6Enabled, ma6MaType, ma6Src, ma6Prd)
Namespace types: RsParamsMAs
Parameters:
this (RsParamsMAs)
enableAll (simple MaEnable)
ma1Enabled (bool)
ma1MaType (series MaTypes)
ma1Src (string)
ma1Prd (int)
ma2Enabled (bool)
ma2MaType (series MaTypes)
ma2Src (string)
ma2Prd (int)
ma3Enabled (bool)
ma3MaType (series MaTypes)
ma3Src (string)
ma3Prd (int)
ma4Enabled (bool)
ma4MaType (series MaTypes)
ma4Src (string)
ma4Prd (int)
ma5Enabled (bool)
ma5MaType (series MaTypes)
ma5Src (string)
ma5Prd (int)
ma6Enabled (bool)
ma6MaType (series MaTypes)
ma6Src (string)
ma6Prd (int)
method init(this, enableAll, tf, rngAtrQ, showRecentBars, lblsOffset, lblsShow, lnOffset, lblSize, lblStyle, smoothen, ma1lnClr, ma1lnWidth, ma1lnStyle, ma2lnClr, ma2lnWidth, ma2lnStyle, ma3lnClr, ma3lnWidth, ma3lnStyle, ma4lnClr, ma4lnWidth, ma4lnStyle, ma5lnClr, ma5lnWidth, ma5lnStyle, ma6lnClr, ma6lnWidth, ma6lnStyle, ma1ShowHistory, ma2ShowHistory, ma3ShowHistory, ma4ShowHistory, ma5ShowHistory, ma6ShowHistory, ma1ShowLabel, ma2ShowLabel, ma3ShowLabel, ma4ShowLabel, ma5ShowLabel, ma6ShowLabel)
Namespace types: HTFMAs
Parameters:
this (HTFMAs)
enableAll (series MaEnable)
tf (string)
rngAtrQ (int)
showRecentBars (int)
lblsOffset (int)
lblsShow (bool)
lnOffset (int)
lblSize (string)
lblStyle (string)
smoothen (bool)
ma1lnClr (color)
ma1lnWidth (int)
ma1lnStyle (string)
ma2lnClr (color)
ma2lnWidth (int)
ma2lnStyle (string)
ma3lnClr (color)
ma3lnWidth (int)
ma3lnStyle (string)
ma4lnClr (color)
ma4lnWidth (int)
ma4lnStyle (string)
ma5lnClr (color)
ma5lnWidth (int)
ma5lnStyle (string)
ma6lnClr (color)
ma6lnWidth (int)
ma6lnStyle (string)
ma1ShowHistory (bool)
ma2ShowHistory (bool)
ma3ShowHistory (bool)
ma4ShowHistory (bool)
ma5ShowHistory (bool)
ma6ShowHistory (bool)
ma1ShowLabel (bool)
ma2ShowLabel (bool)
ma3ShowLabel (bool)
ma4ShowLabel (bool)
ma5ShowLabel (bool)
ma6ShowLabel (bool)
method get(this, id)
Namespace types: RsParamsMAs
Parameters:
this (RsParamsMAs)
id (int)
method set(this, id, prop, val)
Namespace types: RsParamsMAs
Parameters:
this (RsParamsMAs)
id (int)
prop (string)
val (string)
method set(this, id, prop, val)
Namespace types: HTFMAs
Parameters:
this (HTFMAs)
id (int)
prop (string)
val (string)
method htfUpdateTuple(rsParams, repaint)
Namespace types: RsParamsMAs
Parameters:
rsParams (RsParamsMAs)
repaint (bool)
method clear(this)
Namespace types: MaDrawing
Parameters:
this (MaDrawing)
method importRsRetTuple(this, htfBi, ma1, ma2, ma3, ma4, ma5, ma6)
Namespace types: HTFMAs
Parameters:
this (HTFMAs)
htfBi (int)
ma1 (float)
ma2 (float)
ma3 (float)
ma4 (float)
ma5 (float)
ma6 (float)
method getDrw(this, id)
Namespace types: HTFMAs
Parameters:
this (HTFMAs)
id (int)
method setDrwProp(this, id, prop, val)
Namespace types: HTFMAs
Parameters:
this (HTFMAs)
id (int)
prop (string)
val (string)
method initDrawings(this, rsPrms, dispBandWidth)
Namespace types: HTFMAs
Parameters:
this (HTFMAs)
rsPrms (RsParamsMAs)
dispBandWidth (float)
method updateDrawings(this, rsPrms, dispBandWidth)
Namespace types: HTFMAs
Parameters:
this (HTFMAs)
rsPrms (RsParamsMAs)
dispBandWidth (float)
method update(this)
Namespace types: HTFMAs
Parameters:
this (HTFMAs)
method importConfig(this, oCfg, maCount)
Imports HTF MAs settings from objProps (of any level) into `RsParamsMAs` child `RsMaCalcParams` objects (into the first first `maCount` of them)
Namespace types: RsParamsMAs
Parameters:
this (RsParamsMAs) : (RsParamsMAs) Target object to import prop values to.
oCfg (objProps type from moebius1977/CSVParser/1) : (CSVP.objProps) (one of objProps types) an objProps, ... opjProps8 containing properties' values in a child objProps objects
maCount (int) : (int) Number of tgtObj's RsMaCalcParams childs of tgtObj to set (1 to 6, starting from 1)
Returns: this
method importConfig(this, oCfg, maCount)
Imports HTF MAs settings from objProps (of any level) into `RsParamsMAs` child `RsMaCalcParams` objects (into the first first `maCount` of them)
Namespace types: RsParamsMAs
Parameters:
this (RsParamsMAs) : (RsParamsMAs) Target object to import prop values to.
oCfg (objProps0 type from moebius1977/CSVParser/1) : (CSVP.objProps) (one of objProps types) an objProps, ... opjProps8 containing properties' values in a child objProps objects
maCount (int) : (int) Number of tgtObj's RsMaCalcParams childs of tgtObj to set (1 to 6, starting from 1)
Returns: this
method importConfig(this, oCfg, maCount)
Imports HTF MAs settings from objProps (of any level) into `RsParamsMAs` child `RsMaCalcParams` objects (into the first first `maCount` of them)
Namespace types: RsParamsMAs
Parameters:
this (RsParamsMAs) : (RsParamsMAs) Target object to import prop values to.
oCfg (objProps1 type from moebius1977/CSVParser/1) : (CSVP.objProps) (one of objProps types) an objProps, ... opjProps8 containing properties' values in a child objProps objects
maCount (int) : (int) Number of tgtObj's RsMaCalcParams childs of tgtObj to set (1 to 6, starting from 1)
Returns: this
method importConfig(this, oCfg, maCount)
Imports HTF MAs settings from objProps (of any level) into `RsParamsMAs` child `RsMaCalcParams` objects (into the first first `maCount` of them)
Namespace types: RsParamsMAs
Parameters:
this (RsParamsMAs) : (RsParamsMAs) Target object to import prop values to.
oCfg (objProps2 type from moebius1977/CSVParser/1) : (CSVP.objProps) (one of objProps types) an objProps, ... opjProps8 containing properties' values in a child objProps objects
maCount (int) : (int) Number of tgtObj's RsMaCalcParams childs of tgtObj to set (1 to 6, starting from 1)
Returns: this
method importConfig(this, oCfg, maCount)
Imports HTF MAs settings from objProps (of any level) into `RsParamsMAs` child `RsMaCalcParams` objects (into the first first `maCount` of them)
Namespace types: RsParamsMAs
Parameters:
this (RsParamsMAs) : (RsParamsMAs) Target object to import prop values to.
oCfg (objProps3 type from moebius1977/CSVParser/1) : (CSVP.objProps) (one of objProps types) an objProps, ... opjProps8 containing properties' values in a child objProps objects
maCount (int) : (int) Number of tgtObj's RsMaCalcParams childs of tgtObj to set (1 to 6, starting from 1)
Returns: this
method importConfig(this, oCfg, maCount)
Imports HTF MAs settings from objProps (of any level) into `RsParamsMAs` child `RsMaCalcParams` objects (into the first first `maCount` of them)
Namespace types: RsParamsMAs
Parameters:
this (RsParamsMAs) : (RsParamsMAs) Target object to import prop values to.
oCfg (objProps4 type from moebius1977/CSVParser/1) : (CSVP.objProps) (one of objProps types) an objProps, ... opjProps8 containing properties' values in a child objProps objects
maCount (int) : (int) Number of tgtObj's RsMaCalcParams childs of tgtObj to set (1 to 6, starting from 1)
Returns: this
method importConfig(this, oCfg, maCount)
Imports HTF MAs settings from objProps (of any level) into `RsParamsMAs` child `RsMaCalcParams` objects (into the first first `maCount` of them)
Namespace types: RsParamsMAs
Parameters:
this (RsParamsMAs) : (RsParamsMAs) Target object to import prop values to.
oCfg (objProps5 type from moebius1977/CSVParser/1) : (CSVP.objProps) (one of objProps types) an objProps, ... opjProps8 containing properties' values in a child objProps objects
maCount (int) : (int) Number of tgtObj's RsMaCalcParams childs of tgtObj to set (1 to 6, starting from 1)
Returns: this
method importConfig(this, oCfg, maCount)
Imports HTF MAs settings from objProps (of any level) into `RsParamsMAs` child `RsMaCalcParams` objects (into the first first `maCount` of them)
Namespace types: RsParamsMAs
Parameters:
this (RsParamsMAs) : (RsParamsMAs) Target object to import prop values to.
oCfg (objProps6 type from moebius1977/CSVParser/1) : (CSVP.objProps) (one of objProps types) an objProps, ... opjProps8 containing properties' values in a child objProps objects
maCount (int) : (int) Number of tgtObj's RsMaCalcParams childs of tgtObj to set (1 to 6, starting from 1)
Returns: this
method importConfig(this, oCfg, maCount)
Namespace types: RsParamsMAs
Parameters:
this (RsParamsMAs)
oCfg (objProps7 type from moebius1977/CSVParser/1)
maCount (int)
method importConfig(this, oCfg, maCount)
Imports HTF MAs settings from objProps (of any level) into `HTFMAs` child `MaDrawing` objects (into the first first `maCount` of them)
Namespace types: RsParamsMAs
Parameters:
this (RsParamsMAs) : (HTFMAs) Target object to import prop values to.
oCfg (objProps8 type from moebius1977/CSVParser/1) : (CSVP.objProps) (one of objProps types) an objProps, ... opjProps8 containing properties' values in a child objProps objects
maCount (int) : (int) Number of tgtObj's RsMaCalcParams childs of tgtObj to set (1 to 6, starting from 1)
Returns: this
method importConfig(this, oCfg, maCount)
Imports HTF MAs settings from objProps (of any level) into `HTFMAs` child `MaDrawing` objects (into the first first `maCount` of them)
Namespace types: HTFMAs
Parameters:
this (HTFMAs) : (HTFMAs) Target object to import prop values to.
oCfg (objProps type from moebius1977/CSVParser/1) : (CSVP.objProps) (one of objProps types) an objProps, ... opjProps8 containing properties' values in a child objProps objects
maCount (int) : (int) Number of tgtObj's RsMaCalcParams childs of tgtObj to set (1 to 6, starting from 1)
Returns: this
method importConfig(this, oCfg, maCount)
Imports HTF MAs settings from objProps (of any level) into `HTFMAs` child `MaDrawing` objects (into the first first `maCount` of them)
Namespace types: HTFMAs
Parameters:
this (HTFMAs) : (HTFMAs) Target object to import prop values to.
oCfg (objProps0 type from moebius1977/CSVParser/1) : (CSVP.objProps) (one of objProps types) an objProps, ... opjProps8 containing properties' values in a child objProps objects
maCount (int) : (int) Number of tgtObj's RsMaCalcParams childs of tgtObj to set (1 to 6, starting from 1)
Returns: this
method importConfig(this, oCfg, maCount)
Imports HTF MAs settings from objProps (of any level) into `HTFMAs` child `MaDrawing` objects (into the first first `maCount` of them)
Namespace types: HTFMAs
Parameters:
this (HTFMAs) : (HTFMAs) Target object to import prop values to.
oCfg (objProps1 type from moebius1977/CSVParser/1) : (CSVP.objProps) (one of objProps types) an objProps, ... opjProps8 containing properties' values in a child objProps objects
maCount (int) : (int) Number of tgtObj's RsMaCalcParams childs of tgtObj to set (1 to 6, starting from 1)
Returns: this
method importConfig(this, oCfg, maCount)
Imports HTF MAs settings from objProps (of any level) into `HTFMAs` child `MaDrawing` objects (into the first first `maCount` of them)
Namespace types: HTFMAs
Parameters:
this (HTFMAs) : (HTFMAs) Target object to import prop values to.
oCfg (objProps2 type from moebius1977/CSVParser/1) : (CSVP.objProps) (one of objProps types) an objProps, ... opjProps8 containing properties' values in a child objProps objects
maCount (int) : (int) Number of tgtObj's RsMaCalcParams childs of tgtObj to set (1 to 6, starting from 1)
Returns: this
method importConfig(this, oCfg, maCount)
Imports HTF MAs settings from objProps (of any level) into `HTFMAs` child `MaDrawing` objects (into the first first `maCount` of them)
Namespace types: HTFMAs
Parameters:
this (HTFMAs) : (HTFMAs) Target object to import prop values to.
oCfg (objProps3 type from moebius1977/CSVParser/1) : (CSVP.objProps) (one of objProps types) an objProps, ... opjProps8 containing properties' values in a child objProps objects
maCount (int) : (int) Number of tgtObj's RsMaCalcParams childs of tgtObj to set (1 to 6, starting from 1)
Returns: this
method importConfig(this, oCfg, maCount)
Imports HTF MAs settings from objProps (of any level) into `HTFMAs` child `MaDrawing` objects (into the first first `maCount` of them)
Namespace types: HTFMAs
Parameters:
this (HTFMAs) : (HTFMAs) Target object to import prop values to.
oCfg (objProps4 type from moebius1977/CSVParser/1) : (CSVP.objProps) (one of objProps types) an objProps, ... opjProps8 containing properties' values in a child objProps objects
maCount (int) : (int) Number of tgtObj's RsMaCalcParams childs of tgtObj to set (1 to 6, starting from 1)
Returns: this
method importConfig(this, oCfg, maCount)
Imports HTF MAs settings from objProps (of any level) into `HTFMAs` child `MaDrawing` objects (into the first first `maCount` of them)
Namespace types: HTFMAs
Parameters:
this (HTFMAs) : (HTFMAs) Target object to import prop values to.
oCfg (objProps5 type from moebius1977/CSVParser/1) : (CSVP.objProps) (one of objProps types) an objProps, ... opjProps8 containing properties' values in a child objProps objects
maCount (int) : (int) Number of tgtObj's RsMaCalcParams childs of tgtObj to set (1 to 6, starting from 1)
Returns: this
method importConfig(this, oCfg, maCount)
Imports HTF MAs settings from objProps (of any level) into `HTFMAs` child `MaDrawing` objects (into the first first `maCount` of them)
Namespace types: HTFMAs
Parameters:
this (HTFMAs) : (HTFMAs) Target object to import prop values to.
oCfg (objProps6 type from moebius1977/CSVParser/1) : (CSVP.objProps) (one of objProps types) an objProps, ... opjProps8 containing properties' values in a child objProps objects
maCount (int) : (int) Number of tgtObj's RsMaCalcParams childs of tgtObj to set (1 to 6, starting from 1)
Returns: this
method importConfig(this, oCfg, maCount)
Namespace types: HTFMAs
Parameters:
this (HTFMAs)
oCfg (objProps7 type from moebius1977/CSVParser/1)
maCount (int)
method importConfig(this, oCfg, maCount)
Namespace types: HTFMAs
Parameters:
this (HTFMAs)
oCfg (objProps8 type from moebius1977/CSVParser/1)
maCount (int)
method newRsParamsMAs(this)
Namespace types: LO
Parameters:
this (LO)
method newHTFMAs(this)
Namespace types: LO
Parameters:
this (LO)
RsMaCalcParams
Parameters of one MA (only calculation params needed within req.sec(), visual parameters are within htfMAs type)
Fields:
enabled (series bool)
maType (series MaTypes) : MA type options: SMA / EMA / WMA / ...
src (series string)
prd (series int) : MA period
RsParamsMAs
Collection of parameters of 6 MAs. Used to pass params to req.sec()
Fields:
ma1CalcParams (RsMaCalcParams)
ma2CalcParams (RsMaCalcParams)
ma3CalcParams (RsMaCalcParams)
ma4CalcParams (RsMaCalcParams)
ma5CalcParams (RsMaCalcParams)
ma6CalcParams (RsMaCalcParams)
RsReturnMAs
Used to return data from req.sec().
Fields:
htfBi (series int)
ma1 (series float)
ma2 (series float)
ma3 (series float)
ma4 (series float)
ma5 (series float)
ma6 (series float)
MaDrawing
MA's plot parameters plus drawing objects for MA's current level (line and label).
Fields:
lnClr (series color) : (color) MA plot line color (like in plot())
lnWidth (series int) : (int) MA plot line width (like in plot())
lnStyle (series string) : (string) MA plot line style (like in plot())
showHistory (series bool) : (bool) Whether to plot the MA on historical bars or only show current level to the right of the latest bar.
showLabel (series bool) : (bool) Whether to show the name of the MA to the right of the MA's level
ln (series line) : (line) line to show MA"s current level
lbl (series label) : (label) label showing MA's name
HTFMAs
Contains data and drawing parameters for MA's of one timeframe (MA calculation parameters for MA's of one timeframe are in a separate object RsParamsMAs)
Fields:
rsRet (RsReturnMAs) : (RsReturnMAs) Contains data returned from req.sec(). Is set to na in between HTF bar changes if smoothing is enabled.
rsRetLast (RsReturnMAs) : (RsReturnMAs) Contains a copy of data returned from req.sec() in case rsRet is set to na for smoothing.
rsRetNaObj (RsReturnMAs) : (RsReturnMAs) An empty object as `na` placeholder
ma1Drawing (MaDrawing) : (MaDrawing) MA drawing properties
ma2Drawing (MaDrawing) : (MaDrawing) MA drawing properties
ma3Drawing (MaDrawing) : (MaDrawing) MA drawing properties
ma4Drawing (MaDrawing) : (MaDrawing) MA drawing properties
ma5Drawing (MaDrawing) : (MaDrawing) MA drawing properties
ma6Drawing (MaDrawing) : (MaDrawing) MA drawing properties
enabled (series bool) : (bool ) Enables/disables all of the MAs of one timeframe.
tf (series string) : (string) Timeframe
showHistory (series bool) : (bool ) Plot MA line on historical bars
rngAtrQ (series int) : (int ) A multiplier for atr(14). Determines a range within which the MA's will be plotted. MA's too far away will not be plotted.
showRecentBars (series int) : (int ) Only plot MA on these recent bars
smoothen (series bool) : (bool ) Smoothen MA plot. If false the same HTF value is returned on all chart bars within a HTF bar (intrabars), so the plot looks like steps.
lblsOffset (series int) : (int ) Show MA name this number of bars to the right off last bar.
lblsShow (series bool) : (bool ) Show MA name
lnOffset (series int) : (int ) Start line showing current level of the MA this number of bars to the right off the last bar.
lblSize (series string) : (string) Label size
lblStyle (series string) : (string) Label style
lblTxtAlign (series string) : (string) Label text align
bPopupLabel (series bool) : (bool ) Show current MA value as a tooltip to MA's name.
LO
LO Library object, whose only purpose is to serve as a shorthand for library name in script code.
Fields:
dummy (series string)
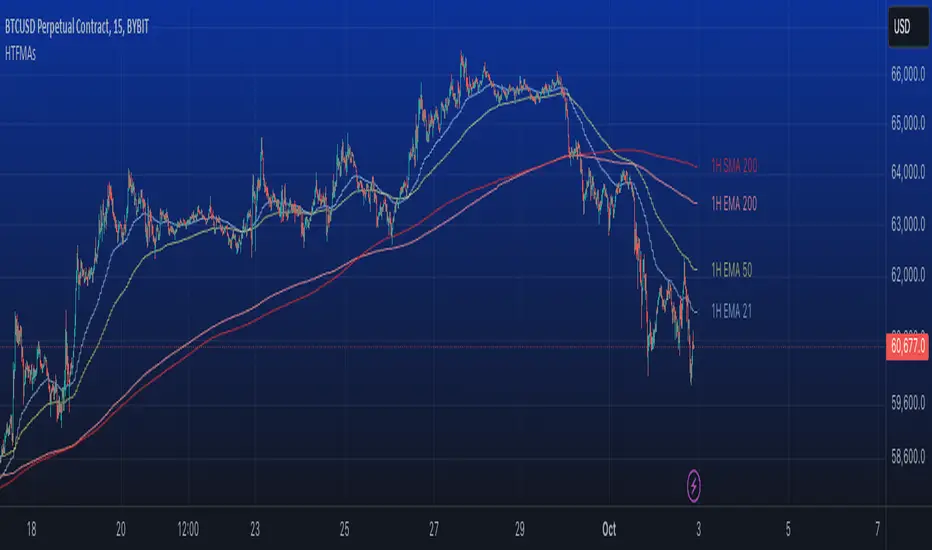
Custom Buy BID StrategyThis Pine Script strategy is designed to identify and capitalize on upward trends in the market using the Average True Range (ATR) as a core component of the analysis. The script provides the following features:
Customizable ATR Calculation: Users can switch between different methods of ATR calculation (traditional or simple moving average).
Adjustable Parameters: The strategy allows for adjustable ATR periods, ATR multipliers, and custom time windows for executing trades.
Buy Signal Alerts: The strategy generates buy signals when the market shifts from a downtrend to an uptrend, based on ATR and price action.
Profit and Stop-Loss Management: Built-in take profit and stop-loss conditions are calculated as a percentage of the entry price, allowing for automatic position management.
Visual Enhancements: The script highlights the uptrend with green lines and optionally colors bars to help visualize market direction.
Flexible Timeframe: Users can configure a specific date range to activate the strategy, offering more control over when trades are executed.
This strategy is ideal for traders looking to automate their buy entries and manage risk with a straightforward trend-following approach. By utilizing customizable settings, it adapts to various market conditions and timeframes.

Decline and Rise Detective [CHE]Decline and Rise Detective
TradingView Indicator (Best Timeframe: 1H or Higher)
1. Introduction
The "Decline and Rise Detective " is a TradingView indicator designed to identify the hours within a trading day that experience the largest price declines and rises. This indicator provides a visual representation of this data, offering traders valuable insights into the most frequent hours for significant price movements. It is most effective when used with a timeframe of 1 hour or greater.
2. Key Features of the Indicator
2.1. Display Options
Display Option: Users can choose between two display options:
Label: Displays the information as a text label directly on the chart.
Table: Displays the information in a table format in the top right corner of the chart.
2.2. Time Zone Settings
Time Zone: The indicator allows the user to manually set the time zone or use the exchange's time zone.
Time Zone Offset: Adjust the time zone via a UTC offset.
2.3. Day Change Detection
The indicator automatically detects the change between trading days to ensure data is correctly assigned.
3. Analysis of Price Declines and Rises
3.1. Calculation of Largest Declines and Rises
The indicator compares the high and low of each hour to determine the largest decline and rise within a trading day.
3.2. Frequency Counting
For each hour of the day, the number of times the largest declines and rises occur is counted to identify the hours with the most significant price movements.
3.3. Data Sorting
The hours are sorted by the number of occurrences of declines and rises to highlight the most frequent hours. This sorting was implemented using the MA Sorter function, inspired by Duyck's Array Sorter. Special thanks to Duyck for providing the Array Sorter on TradingView, which greatly influenced this feature
4. Interpretation and Trading Applications
4.1. Identifying High Volatility Periods
The hours identified by the indicator as having the most frequent and significant price movements are typically periods of high volatility. These periods are crucial for traders who seek to capitalize on market fluctuations.
4.2. Determining Optimal Trade Entries
Long Trades: The hours with the most significant price rises can be used to identify optimal times to enter long positions.
Short Trades: Conversely, the hours with the most significant price declines can indicate good opportunities for short trades.
4.3. Display of Top 5 Hours
The indicator shows the five hours with the most declines and rises.
Depending on the selected display option, this information is shown either as a text label or as a table in the chart.
4.4. Background Color
The background color of the chart changes at day change to clearly mark it.
5. Application of the Indicator
5.1. Trading Use
Traders can use the indicator to identify time windows with high volatility and adjust their trading strategies accordingly. This allows for more informed decisions on when to go long or short, depending on the market conditions during those hours.
5.2. Customization Options
Various input options allow the user to customize the indicator to fit personal needs and trading hours.
6. Summary
The "Decline and Rise Detective " indicator is a powerful tool for analyzing hourly price movements in the markets. By providing detailed information on the most frequent hours for significant price declines and rises, this indicator offers valuable insights into periods of high volatility. Traders can use this data to make more informed decisions on entering long or short trades. It is particularly effective when used with timeframes of 1 hour or greater.
Best regards and happy trading
Chervolino
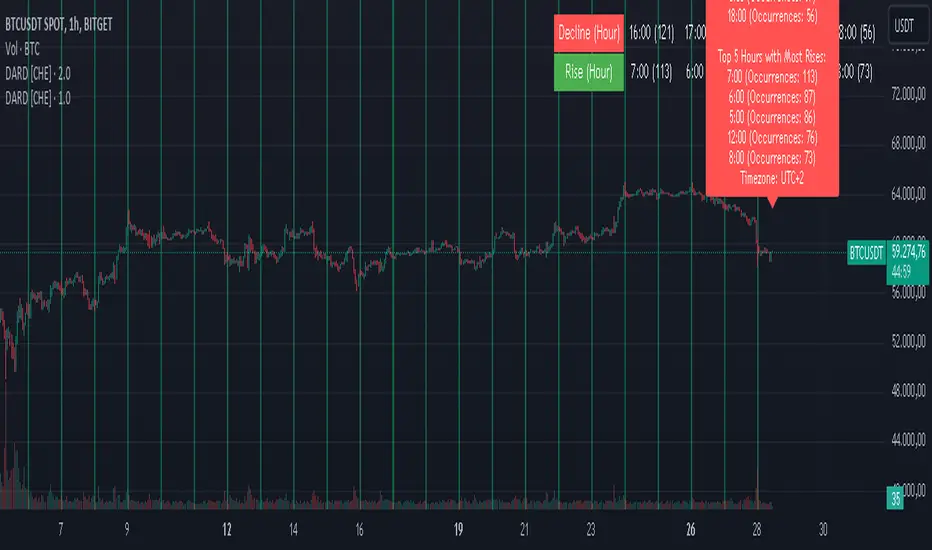
Advanced Awesome Oscillator [CryptoSea]Advanced AO Analysis Indicator
The Advanced AO Analysis indicator is a sophisticated tool designed to evaluate the Awesome Oscillator (AO) in search of regular and hidden divergences that signal potential price reversals. By tracking the intensity and duration of the AO's movements, this indicator aids traders in pinpointing critical points in price action.
Key Features
Divergence Detection: Identifies both regular and hidden bullish and bearish divergences, providing early signs of potential market reversals.
Customizable Lookback Periods: Allows users to set specific lookback windows to define the strength and relevance of detected divergences.
Adaptive Oscillator Display: Features customizable display options for the AO, enabling users to view data in different modes suited to their analysis needs.
Alert System: Includes configurable alerts to notify users of potential divergence formations, helping traders respond promptly.
How it Works
AO Calculation: Computes the AO as the difference between short-term and long-term moving averages of the midpoints of bars, highlighting momentum shifts.
Pivot Point Analysis: Utilizes advanced algorithms to find low and high pivot points based on the oscillator values, crucial for spotting trend reversals.
Range Validation: Verifies that divergences occur within a predefined range from pivot points, ensuring their validity and strength.
Visualisation: Plots AO values and potential divergences directly on the chart, aiding in quick visual analysis.
Application
Strategic Decision-Making: Assists traders in making informed decisions by providing detailed analysis of AO movements and divergence.
Trend Confirmation: Reinforces trading strategies by confirming potential reversals with pivot point detection and divergence analysis.
Behavioural Insight: Offers insights into market dynamics and sentiment by analyzing the depth and duration of AO cycles above and below zero.
The Advanced AO Analysis indicator equips traders with a powerful analytical tool for studying the Awesome Oscillator in-depth, enhancing their ability to spot and act on divergence-based trading opportunities in the cryptocurrency markets.
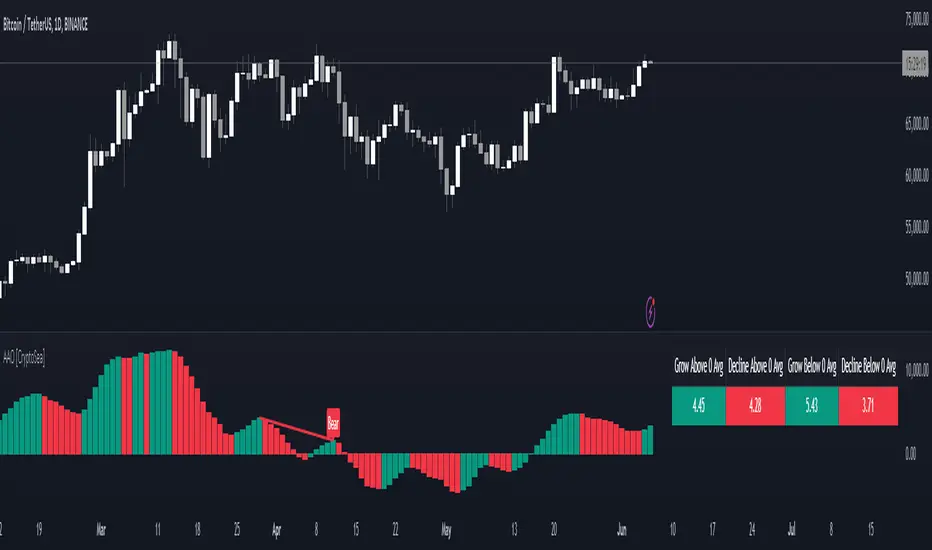
Sector Rotation Hedging With Volatility Index [TradeDots]The "Sector Rotation Hedging Strategy With Volatility Index" is a comprehensive trading indicator developed to optimally leverage the S&P500 volatility index. It is designed to switch between distinct ETF sectors, strategically hedging to moderate risk exposure during harsh market volatility.
HOW DOES IT WORK
The core of this indicator is grounded on the S&P500 volatility index (VIX) close price and its 60-day moving average. This serves to determine whether the prevailing market volatility is above or below the quarterly average.
In periods of elevated market volatility, risk exposure escalates significantly. Traders retaining stocks in sectors with disproportionately high volatility face increased vulnerability to negative returns. To tackle this, our indicator employs a two-pronged approach utilizing two sequential candlestick close prices to confirm if volatility surpasses the average value.
Upon confirming above-average volatility, a hedging table is deployed to spotlight ETFs with low volatility, such as the Utilities Select Sector SPDR Fund (XLU), to derisk the overall portfolio.
Conversely, in low-volatility conditions, sectors yielding higher returns like the Technology Select Sector SPDR Fund (XLK) are preferred. The hedging table is utilized to earmark high-return sector ETFs.
Thus, during highly volatile market periods, the strategy recommends enhancing portfolio allocation to low-volatility ETFs. During low-volatility windows, the portfolio is calibrated towards high-volatility ETFs for heightened returns.
IMPORTANT CONSIDERATION
In real trading, additional considerations encompassing trading commissions, management fees, and ancillary rotation costs should be factored in. False signals may arise, potentially leading to losses from these fees.
RISK DISCLAIMER
Trading entails substantial risk, and most day traders incur losses. All content, tools, scripts, articles, and education provided by TradeDots serve purely informational and educational purposes. Past performances are not definitive predictors of future results.

itradesize /\ Silver Bullet x Macro x KillzoneThis indicator shows the best way to annotate ICT Killzones, Silver Bullet and Macro times on the chart. With the help of a new pane, it will not distract your chart and will not cause any distractions to your eye, or brain but you can see when will they happen.
The indicator also draws everything beforehand when a proper new day starts.
You can customize them how you want to show up.
Collapsed or full view?
You can hide any of them and keep only the ones you would like to.
All the colors can be customized, texts & sizes or just use shortened texts and you are also able to hide those drawings which are older than the actual day.
You should minimize the pane where the script has been automatically drawn to therefore you will have the best experience and not show any distractions.
The script automatically shows the time-based boxes, based on the New York timezone.
Killzone Time windows ( for indices ):
London KZ 02:00 - 05:00
New York AM KZ 07:00 - 10:00
New York PM KZ 13:30 - 16:00
Silver Bullet times:
03:00 - 04:00
10:00 - 11:00
14:00 - 15:00
Macro times:
02:33 - 03:00
04:03 - 04:30
08:50 - 0910
09:50 - 10:10
10:50 - 11:10
11:50 - 12:50
