RSI + Elder Bull-Bear pressure RSI + Bull/Bear (Elder-Ray enhanced RSI)
What it is
An extended RSI that overlays Elder-Ray Bull/Bear Power on the same, zero-centered scale. You get classic RSI regime cues plus a live read of buy/sell pressure, with optional smoothing, bands, and right-edge value labels.
Key features
RSI with bands – default bands 30 / 50 / 70 (editable).
Bull/Bear Power (Elder) – ATR-normalized; optional EMA/SMA/RMA/HMA smoothing.
One-pane overlay – RSI and Bull/Bear share a common midline (RSI-50 ↔ panel 0).
Right-edge labels – always visible at the chart’s right margin with adjustable offsets.
How to read it
Cyan line = RSI (normalized)
Above the mid band = bullish regime; below = bearish regime.
Green = Bull Power, Red = Bear Power
Columns/lines above 0 show buy pressure; below 0 show sell pressure.
Smoothing reduces noise; zero-line remains your key reference.
Trade logic (simple playbook)
Entry
BUY (primary):
RSI crosses up through 50 (regime turns bullish), and
Bull (green) crosses up through 0 (buy pressure confirms).
SELL (primary):
RSI crosses down through 50, and
Bear (red) crosses down through 0 (sell pressure confirms).
Alternative momentum entries
Aggressive BUY: Bull (green) pushes above RSI-80 band (strong upside impulse).
Aggressive SELL: Bear (red) pushes below RSI-30 band (strong downside impulse).
Exits / trade management
In a long: consider exiting or tightening stops if Bear (red) dips below the 0 line (rising sell pressure) or RSI loses 50.
In a short: consider exiting or tightening if Bull (green) rises above 0 or RSI reclaims 50.
Tip: “0” on the panel is your pressure zero-line (maps to RSI-50). Most whipsaws happen near this line; smoothing (e.g., EMA 21) helps.
Defaults (on first load)
RSI bands: 30 / 50 / 70 with subtle fills.
Labels: tiny, pushed far right (large offsets).
Bull/Bear smoothing: EMA(21), smoothed line plot mode.
RSI plotted normalized so it overlaps the pressure lines cleanly.
Tighten or loosen the Bull/Bear thresholds (e.g., Bull ≥ +0.5 ATR, Bear ≤ −0.5 ATR) to demand stronger confirmation.
Settings that matter
Smoothing length/type – balances responsiveness vs. noise.
Power/RSI Gain – visual scaling only (doesn’t change logic).
Band placement – keep raw 30/50/80 or switch to “distance from 50” if you prefer symmetric spacing.
Label offsets – move values clear of the last bar/scale clutter.
Good practices
Combine with structure/ATR stops (e.g., 1–1.5× ATR, swing high/low).
In trends, hold while RSI stays above/below 50 and the opposite pressure line doesn’t dominate.
In ranges, favor signals occurring near the mid band and take profits at the opposite band.
Disclaimer: This is a research/visual tool, not financial advice at any kind. Test your rules on multiple markets/timeframes and size positions responsibly.
在腳本中搜尋"富时中国50期指"

Market Strength Buy Sell Indicator [TradeDots]A specialized tool designed to assist traders in evaluating market conditions through a multifaceted analysis of relative performance, beta-adjusted returns, momentum, and volume—allowing you to identify optimal points for long or short trades. By integrating multiple benchmarks (default S&P 500) and percentile-based thresholds, the script provides clear, actionable insights suitable for both day trading and higher-level timeframe assessments.
📝 HOW IT WORKS
1. Multi-Factor Composite Score
Relative Performance (RS Ratio): Compares your asset’s performance to a chosen benchmark (default: SPY). Values above 1.0 indicate outperformance, while below 1.0 suggest underperformance.
Beta-Adjusted Returns: Checks the ticker’s excess movement relative to expected market-related moves. This helps distinguish pure “alpha” from broad market effects.
Volume & Correlation: Volume spikes often confirm the momentum behind a move, while correlation measures how closely the asset tracks or diverges from its benchmark.
These components merge into a 0–100 composite score. Scores above 50 frequently imply bullish strength; drops below 50 often point to underperformance—potentially flagging short opportunities.
2. Intraday & Day Trading Focus
Monitoring Below 50: During the trading day, the script calculates live data against the benchmark, offering an intraday-sensitive composite score. A dip under 50 may indicate a short bias for that session, especially when accompanied by high volume or momentum shifts.
3. Higher Timeframe Monitoring
Daily Strategies: On daily or weekly charts, the script reveals overall relative strength or weakness compared to the S&P 500. This higher-level perspective helps form broader trading biases—crucial for swing or position trades spanning multiple days.
Long/Short Thresholds: Persistent readings above 50 on a daily chart typically reinforce a long bias, while consistent dips below 50 can sustain a short or cautious outlook.
4. Pair Trading Applications
Custom Benchmark Selection: By setting a specific ticker pair as your benchmark instead of the default S&P 500, you can identify spread trading opportunities between two correlated assets. This allows you to go long the outperforming asset while shorting the underperforming one when the spread reaches extreme levels.
4. Color-Coded Signals & Alerts
Visual Zones (25–75): Color-coded bands highlight strong outperformance (above 75) or pronounced underperformance (below 25).
Alerts on Strong Shifts: Automatic alerts can notify you of sudden entries or exits from bullish or bearish zones, so you can potentially act on new market information without delay.
⚙️ HOW TO USE
1. Select Your Timeframe: For scalping or day trading, lower intervals (e.g., 5-minute) offer immediate data resets at the session’s start. For multi-day insight, daily or weekly charts reveal broader performance trends.
2. Watch Key Levels Around 50: Intraday dips under 50 may be a cue to consider short trades, while bounces above 50 can confirm renewed strength.
3. Assess Benchmark Relationships: Compare your asset’s score and signals to the broader market. A stock falling below its pair’s relative strength line might lag overall market momentum.
4. Combine Tools & Validate: This script excels when integrated with other technical analysis methods (e.g., support/resistance, chart patterns) and fundamental factors for a holistic market view.
❗ LIMITATIONS
No Direction Guarantee: The indicator identifies relative strength but does not guarantee directional price moves.
Delayed Updates: Since calculations update after each bar close, sudden intrabar changes may not immediately reflect.
Market-Specific Behaviors: Some assets or unusual market conditions may deviate from typical benchmarks, weakening signal reliability.
Past ≠ Future: High or low relative strength in the past may not predict continued performance.
RISK DISCLAIMER
All forms of trading and investing involve risk, including the possible loss of principal. This indicator analyzes relative performance but cannot assure profits or eliminate losses. Past performance of any strategy does not guarantee future results. Always combine analysis with proper risk management and your broader trading plan. Consult a licensed financial advisor if you are unsure of your individual risk tolerance or investment objectives.

Ergodic Market Divergence (EMD)Ergodic Market Divergence (EMD)
Bridging Statistical Physics and Market Dynamics Through Ensemble Analysis
The Revolutionary Concept: When Physics Meets Trading
After months of research into ergodic theory—a fundamental principle in statistical mechanics—I've developed a trading system that identifies when markets transition between predictable and unpredictable states. This indicator doesn't just follow price; it analyzes whether current market behavior will persist or revert, giving traders a scientific edge in timing entries and exits.
The Core Innovation: Ergodic Theory Applied to Markets
What Makes Markets Ergodic or Non-Ergodic?
In statistical physics, ergodicity determines whether a system's future resembles its past. Applied to trading:
Ergodic Markets (Mean-Reverting)
- Time averages equal ensemble averages
- Historical patterns repeat reliably
- Price oscillates around equilibrium
- Traditional indicators work well
Non-Ergodic Markets (Trending)
- Path dependency dominates
- History doesn't predict future
- Price creates new equilibrium levels
- Momentum strategies excel
The Mathematical Framework
The Ergodic Score combines three critical divergences:
Ergodic Score = (Price Divergence × Market Stress + Return Divergence × 1000 + Volatility Divergence × 50) / 3
Where:
Price Divergence: How far current price deviates from market consensus
Return Divergence: Momentum differential between instrument and market
Volatility Divergence: Volatility regime misalignment
Market Stress: Adaptive multiplier based on current conditions
The Ensemble Analysis Revolution
Beyond Single-Instrument Analysis
Traditional indicators analyze one chart in isolation. EMD monitors multiple correlated markets simultaneously (SPY, QQQ, IWM, DIA) to detect systemic regime changes. This ensemble approach:
Reveals Hidden Divergences: Individual stocks may diverge from market consensus before major moves
Filters False Signals: Requires broader market confirmation
Identifies Regime Shifts: Detects when entire market structure changes
Provides Context: Shows if moves are isolated or systemic
Dynamic Threshold Adaptation
Unlike fixed-threshold systems, EMD's boundaries evolve with market conditions:
Base Threshold = SMA(Ergodic Score, Lookback × 3)
Adaptive Component = StDev(Ergodic Score, Lookback × 2) × Sensitivity
Final Threshold = Smoothed(Base + Adaptive)
This creates context-aware signals that remain effective across different market environments.
The Confidence Engine: Know Your Signal Quality
Multi-Factor Confidence Scoring
Every signal receives a confidence score based on:
Signal Clarity (0-35%): How decisively the ergodic threshold is crossed
Momentum Strength (0-25%): Rate of ergodic change
Volatility Alignment (0-20%): Whether volatility supports the signal
Market Quality (0-20%): Price convergence and path dependency factors
Real-Time Confidence Updates
The Live Confidence metric continuously updates, showing:
- Current opportunity quality
- Market state clarity
- Historical performance influence
- Signal recency boost
- Visual Intelligence System
Adaptive Ergodic Field Bands
Dynamic bands that expand and contract based on market state:
Primary Color: Ergodic state (mean-reverting)
Danger Color: Non-ergodic state (trending)
Band Width: Expected price movement range
Squeeze Indicators: Volatility compression warnings
Quantum Wave Ribbons
Triple EMA system (8, 21, 55) revealing market flow:
Compressed Ribbons: Consolidation imminent
Expanding Ribbons: Directional move developing
Color Coding: Matches current ergodic state
Phase Transition Signals
Clear entry/exit markers at regime changes:
Bull Signals: Ergodic restoration (mean reversion opportunity)
Bear Signals: Ergodic break (trend following opportunity)
Confidence Labels: Percentage showing signal quality
Visual Intensity: Stronger signals = deeper colors
Professional Dashboard Suite
Main Analytics Panel (Top Right)
Market State Monitor
- Current regime (Ergodic/Non-Ergodic)
- Ergodic score with threshold
- Path dependency strength
- Quantum coherence percentage
Divergence Metrics
- Price divergence with severity
- Volatility regime classification
- Strategy mode recommendation
- Signal strength indicator
Live Intelligence
- Real-time confidence score
- Color-coded risk levels
- Dynamic strategy suggestions
Performance Tracking (Left Panel)
Signal Analytics
- Total historical signals
- Win rate with W/L breakdown
- Current streak tracking
- Closed trade counter
Regime Analysis
- Current market behavior
- Bars since last signal
- Recommended actions
- Average confidence trends
Strategy Command Center (Bottom Right)
Adaptive Recommendations
- Active strategy mode
- Primary approach (mean reversion/momentum)
- Suggested indicators ("weapons")
- Entry/exit methodology
- Risk management guidance
- Comprehensive Input Guide
Core Algorithm Parameters
Analysis Period (10-100 bars)
Scalping (10-15): Ultra-responsive, more signals, higher noise
Day Trading (20-30): Balanced sensitivity and stability
Swing Trading (40-100): Smooth signals, major moves only Default: 20 - optimal for most timeframes
Divergence Threshold (0.5-5.0)
Hair Trigger (0.5-1.0): Catches every wiggle, many false signals
Balanced (1.5-2.5): Good signal-to-noise ratio
Conservative (3.0-5.0): Only extreme divergences Default: 1.5 - best risk/reward balance
Path Memory (20-200 bars)
Short Memory (20-50): Recent behavior focus, quick adaptation
Medium Memory (50-100): Balanced historical context
Long Memory (100-200): Emphasizes established patterns Default: 50 - captures sufficient history without lag
Signal Spacing (5-50 bars)
Aggressive (5-10): Allows rapid-fire signals
Normal (15-25): Prevents clustering, maintains flow
Conservative (30-50): Major setups only Default: 15 - optimal trade frequency
Ensemble Configuration
Select markets for consensus analysis:
SPY: Broad market sentiment
QQQ: Technology leadership
IWM: Small-cap risk appetite
DIA: Blue-chip stability
More instruments = stronger consensus but potentially diluted signals
Visual Customization
Color Themes (6 professional options):
Quantum: Cyan/Pink - Modern trading aesthetic
Matrix: Green/Red - Classic terminal look
Heat: Blue/Red - Temperature metaphor
Neon: Cyan/Magenta - High contrast
Ocean: Turquoise/Coral - Calming palette
Sunset: Red-orange/Teal - Warm gradients
Display Controls:
- Toggle each visual component
- Adjust transparency levels
- Scale dashboard text
- Show/hide confidence scores
- Trading Strategies by Market State
- Ergodic State Strategy (Primary Color Bands)
Market Characteristics
- Price oscillates predictably
- Support/resistance hold
- Volume patterns repeat
- Mean reversion dominates
Optimal Approach
Entry: Fade moves at band extremes
Target: Middle band (equilibrium)
Stop: Just beyond outer bands
Size: Full confidence-based position
Recommended Tools
- RSI for oversold/overbought
- Bollinger Bands for extremes
- Volume profile for levels
- Non-Ergodic State Strategy (Danger Color Bands)
Market Characteristics
- Price trends persistently
- Levels break decisively
- Volume confirms direction
- Momentum accelerates
Optimal Approach
Entry: Breakout from bands
Target: Trail with expanding bands
Stop: Inside opposite band
Size: Scale in with trend
Recommended Tools
- Moving average alignment
- ADX for trend strength
- MACD for momentum
- Advanced Features Explained
Quantum Coherence Metric
Measures phase alignment between individual and ensemble behavior:
80-100%: Perfect sync - strong mean reversion setup
50-80%: Moderate alignment - mixed signals
0-50%: Decoherence - trending behavior likely
Path Dependency Analysis
Quantifies how much history influences current price:
Low (<30%): Technical patterns reliable
Medium (30-50%): Mixed influences
High (>50%): Fundamental shift occurring
Volatility Regime Classification
Contextualizes current volatility:
Normal: Standard strategies apply
Elevated: Widen stops, reduce size
Extreme: Defensive mode required
Signal Strength Indicator
Real-time opportunity quality:
- Distance from threshold
- Momentum acceleration
- Cross-validation factors
Risk Management Framework
Position Sizing by Confidence
90%+ confidence = 100% position size
70-90% confidence = 75% position size
50-70% confidence = 50% position size
<50% confidence = 25% or skip
Dynamic Stop Placement
Ergodic State: ATR × 1.0 from entry
Non-Ergodic State: ATR × 2.0 from entry
Volatility Adjustment: Multiply by current regime
Multi-Timeframe Alignment
- Check higher timeframe regime
- Confirm ensemble consensus
- Verify volume participation
- Align with major levels
What Makes EMD Unique
Original Contributions
First Ergodic Theory Trading Application: Transforms abstract physics into practical signals
Ensemble Market Analysis: Revolutionary multi-market divergence system
Adaptive Confidence Engine: Institutional-grade signal quality metrics
Quantum Coherence: Novel market alignment measurement
Smart Signal Management: Prevents clustering while maintaining responsiveness
Technical Innovations
Dynamic Threshold Adaptation: Self-adjusting sensitivity
Path Memory Integration: Historical dependency weighting
Stress-Adjusted Scoring: Market condition normalization
Real-Time Performance Tracking: Built-in strategy analytics
Optimization Guidelines
By Timeframe
Scalping (1-5 min)
Period: 10-15
Threshold: 0.5-1.0
Memory: 20-30
Spacing: 5-10
Day Trading (5-60 min)
Period: 20-30
Threshold: 1.5-2.5
Memory: 40-60
Spacing: 15-20
Swing Trading (1H-1D)
Period: 40-60
Threshold: 2.0-3.0
Memory: 80-120
Spacing: 25-35
Position Trading (1D-1W)
Period: 60-100
Threshold: 3.0-5.0
Memory: 100-200
Spacing: 40-50
By Market Condition
Trending Markets
- Increase threshold
- Extend memory
- Focus on breaks
Ranging Markets
- Decrease threshold
- Shorten memory
- Focus on restores
Volatile Markets
- Increase spacing
- Raise confidence requirement
- Reduce position size
- Integration with Other Analysis
- Complementary Indicators
For Ergodic States
- RSI divergences
- Bollinger Band squeezes
- Volume profile nodes
- Support/resistance levels
For Non-Ergodic States
- Moving average ribbons
- Trend strength indicators
- Momentum oscillators
- Breakout patterns
- Fundamental Alignment
- Check economic calendar
- Monitor sector rotation
- Consider market themes
- Evaluate risk sentiment
Troubleshooting Guide
Too Many Signals:
- Increase threshold
- Extend signal spacing
- Raise confidence minimum
Missing Opportunities
- Decrease threshold
- Reduce signal spacing
- Check ensemble settings
Poor Win Rate
- Verify timeframe alignment
- Confirm volume participation
- Review risk management
Disclaimer
This indicator is for educational and informational purposes only. It does not constitute financial advice. Trading involves substantial risk of loss and is not suitable for all investors. Past performance does not guarantee future results.
The ergodic framework provides unique market insights but cannot predict future price movements with certainty. Always use proper risk management, conduct your own analysis, and never risk more than you can afford to lose.
This tool should complement, not replace, comprehensive trading strategies and sound judgment. Markets remain inherently unpredictable despite advanced analysis techniques.
Transform market chaos into trading clarity with Ergodic Market Divergence.
Created with passion for the TradingView community
Trade with insight. Trade with anticipation.
— Dskyz , for DAFE Trading Systems

Entropy Chart Analysis [PhenLabs]📊 Entropy Chart analysis -
Version: PineScript™ v6
📌 Description
The Entropy Chart indicator analysis applies Approximate Entropy (ApEn) to identify zones of potential support and resistance on your price chart. It is designed to locate changes in the market’s predictability, with a focus on zones near significant psychological price levels (e.g., multiples of 50). By quantifying entropy, the indicator aims to identify zones where price action might stabilize (potential support) or become randomized (potential resistance).
This tool automates the visualization of these key areas for traders, which may have the effect of revealing reversal levels or consolidation zones that would be hard to discern through traditional means. It also filters the signals by proximity to key levels in an attempt to reduce noise and highlight higher-probability setups. These dynamic zones adapt to changing market conditions by stretching, merging, and expiring based on user-inputted rules.
🚀 Points of Innovation
Combines Approximate Entropy (ApEn) calculation with price action near significant levels.
Filters zone signals based on proximity (in ticks) to predefined significant price levels (multiples of 50).
Dynamically merges overlapping or nearby zones to consolidate signals and reduce chart clutter.
Uses ApEn crossovers relative to its moving average as the core trigger mechanism.
Provides distinct visual coloring for bullish, bearish, and merged (mixed-signal) zones.
Offers comprehensive customization for entropy calculation, zone sensitivity, level filtering, and visual appearance.
🔧 Core Components
Approximate Entropy (ApEn) Calculation : Measures the regularity or randomness of price fluctuations over a specified window. Low ApEn suggests predictability, while high ApEn suggests randomness.
Zone Trigger Logic : Creates potential support zones when ApEn crosses below its average (indicating increasing predictability) and potential resistance zones when it crosses above (indicating increasing randomness).
Significant Level Filter : Validates zone triggers only if they occur within a user-defined tick distance from significant price levels (multiples of 50).
Dynamic Zone Management : Automatically creates, extends, merges nearby zones based on tick distance, and removes the oldest zones to maintain a maximum limit.
Zone Visualization : Draws and updates colored boxes on the chart to represent active support, resistance, or mixed zones.
🔥 Key Features
Entropy-Based S/R Detection : Uses ApEn to identify potential support (low entropy) and resistance (high entropy) areas.
Significant Level Filtering : Enhances signal quality by focusing on entropy changes near key psychological price points.
Automatic Zone Drawing & Merging : Visualizes zones dynamically, merging close signals for clearer interpretation.
Highly Customizable : Allows traders to adjust parameters for ApEn calculation, zone detection thresholds, level filter sensitivity, merging distance, and visual styles.
Integrated Alerts : Provides built-in alert conditions for the formation of new bullish or bearish zones near significant levels.
Clear Visual Output : Uses distinct, customizable colors for buy (support), sell (resistance), and mixed (merged) zones.
🎨 Visualization
Buy Zones : Represented by greenish boxes (default: #26a69a), indicating potential support areas formed during low entropy periods near significant levels.
Sell Zones : Represented by reddish boxes (default: #ef5350), indicating potential resistance areas formed during high entropy periods near significant levels.
Mixed Zones : Represented by bluish/purple boxes (default: #8894ff), formed when a buy zone and a sell zone merge, indicating areas of potential consolidation or conflict.
Dynamic Extension : Active zones are automatically extended to the right with each new bar.
📖 Usage Guidelines
Calculation Parameters
Window Length
Default: 15
Range: 10-100
Description: Lookback period for ApEn calculation. Shorter lengths are more responsive; longer lengths are smoother.
Embedding Dimension (m)
Default: 2
Range: 1-6
Description: Length of patterns compared in ApEn calculation. Higher values detect more complex patterns but require more data.
Tolerance (r)
Default: 0.5
Range: 0.1-1.0 (step 0.1)
Description: Sensitivity factor for pattern matching (as a multiple of standard deviation). Lower values require closer matches (more sensitive).
Zone Settings
Zone Lookback
Default: 5
Range: 5-50
Description: Lookback period for the moving average of ApEn used in threshold calculations.
Zone Threshold
Default: 0.5
Range: 0.5-3.0
Description: Multiplier for the ApEn average to set crossover trigger levels. Higher values require larger ApEn deviations to create zones.
Maximum Zones
Default: 5
Range: 1-10
Description: Maximum number of active zones displayed. The oldest zones are removed first when the limit is reached.
Zone Merge Distance (Ticks)
Default: 5
Range: 1-50
Description: Maximum distance in ticks for two separate zones to be merged into one.
Level Filter Settings
Tick Size
Default: 0.25
Description: The minimum price increment for the asset. Must be set correctly for the specific instrument to ensure accurate level filtering.
Max Ticks Distance from Levels
Default: 40
Description: Maximum allowed distance (in ticks) from a significant level (multiple of 50) for a zone trigger to be valid.
Visual Settings
Buy Zone Color : Default: color.new(#26a69a, 83). Sets the fill color for support zones.
Sell Zone Color : Default: color.new(#ef5350, 83). Sets the fill color for resistance zones.
Mixed Zone Color : Default: color.new(#8894ff, 83). Sets the fill color for merged zones.
Buy Border Color : Default: #26a69a. Sets the border color for support zones.
Sell Border Color : Default: #ef5350. Sets the border color for resistance zones.
Mixed Border Color : Default: color.new(#a288ff, 50). Sets the border color for mixed zones.
Border Width : Default: 1, Range: 1-3. Sets the thickness of zone borders.
✅ Best Use Cases
Identifying potential support/resistance near significant psychological price levels (e.g., $50, $100 increments).
Detecting potential market turning points or consolidation zones based on shifts in price predictability.
Filtering entries or exits by confirming signals occurring near significant levels identified by the indicator.
Adding context to other technical analysis approaches by highlighting entropy-derived zones.
⚠️ Limitations
Parameter Dependency : Indicator performance is sensitive to parameter settings ( Window Length , Tolerance , Zone Threshold , Max Ticks Distance ), which may need optimization for different assets and timeframes.
Volatility Sensitivity : High market volatility or erratic price action can affect ApEn calculations and potentially lead to less reliable zone signals.
Fixed Level Filter : The significant level filter is based on multiples of 50. While common, this may not capture all relevant levels for every asset or market condition. Accurate Tick Size input is essential.
Not Standalone : Should be used in conjunction with other analysis methods (price action, volume, other indicators) for confirmation, not as a sole basis for trading decisions.
💡 What Makes This Unique
Entropy + Level Context : Uniquely combines ApEn analysis with a specific filter for proximity to significant price levels (multiples of 50), adding locational context to entropy signals.
Intelligent Zone Merging : Automatically consolidates nearby buy/sell zones based on tick distance, simplifying visual analysis and highlighting stronger confluence areas.
Targeted Signal Generation : Focuses alerts and zone creation on specific market conditions (entropy shifts near key levels).
🔬 How It Works
Calculate Entropy : The script computes the Approximate Entropy (ApEn) of the closing prices over the defined Window Length to quantify price predictability.
Check Triggers : It monitors ApEn relative to its moving average. A crossunder below a calculated threshold (avg_apen / zone_threshold) indicates potential support; a crossover above (avg_apen * zone_threshold) indicates potential resistance.
Filter by Level : A potential zone trigger is confirmed only if the low (for support) or high (for resistance) of the trigger bar is within the Max Ticks Distance of a significant price level (multiple of 50).
Manage & Draw Zones : If a trigger is confirmed, a new zone box is created. The script checks for overlaps with existing zones within the Zone Merge Distance and merges them if necessary. Zones are extended forward, and the oldest are removed to respect the Maximum Zones limit. Active zones are drawn and updated on the chart.
💡 Note:
Crucially, set the Tick Size parameter correctly for your specific trading instrument in the “Level Filter Settings”. Incorrect Tick Size will make the significant level filter inaccurate.
Experiment with parameters, especially Window Length , Tolerance (r) , Zone Threshold , and Max Ticks Distance , to tailor the indicator’s sensitivity to your preferred asset and timeframe.
Always use this indicator as part of a comprehensive trading plan, incorporating risk management and seeking confirmation from other analysis techniques.

Adv EMA Cloud v6 (ADX, Alerts)Summary:
This indicator provides a multi-faceted view of market trends using Exponential Moving Averages (EMAs) arranged in visually intuitive clouds, enhanced with an optional ADX-based range filter and configurable alerts for key market conditions. It aims to help traders quickly gauge trend alignment across short, medium, and long timeframes while filtering signals during potentially choppy market conditions.
Key Features:
Multiple EMAs: Displays 10-period (Fast), 20-period (Mid), and 50-period (Slow) EMAs.
Long-Term Trend Filter: Includes a 200-period EMA to provide context for the overall dominant trend direction.
Dual EMA Clouds:
Fast/Mid Cloud (10/20 EMA): Fills the area between the 10 and 20 EMAs. Defaults to Green when 10 > 20 (bullish short-term momentum) and Red when 10 < 20 (bearish short-term momentum).
Mid/Slow Cloud (20/50 EMA): Fills the area between the 20 and 50 EMAs. Defaults to Aqua when 20 > 50 (bullish mid-term trend) and Fuchsia when 20 < 50 (bearish mid-term trend).
Optional ADX Range Filter: Uses the Average Directional Index (ADX) to identify potentially non-trending or choppy markets. When enabled and ADX falls below a user-defined threshold, the EMA clouds will turn grey, visually warning that trend-following signals may be less reliable.
Configurable Alerts: Provides several built-in alert conditions using Pine Script's alertcondition function:
Confluence Condition: Triggers when a 10/20 EMA crossover occurs while both EMA clouds show alignment (both bullish/green/aqua or both bearish/red/fuchsia) and price respects the 200 EMA filter and the ADX filter indicates a trend (if filters are enabled).
MA Filter Cross: Triggers when price crosses above or below the 200 EMA filter line.
Full Alignment Start: Triggers on the first bar where full bullish or bearish alignment occurs (both clouds aligned + MA filter respected + ADX trending, if filters are enabled).
How It Works:
EMA Calculation: Standard Exponential Moving Averages are calculated for the 10, 20, 50, and 200 periods based on the closing price.
Cloud Creation: The fill() function visually shades the area between the 10 & 20 EMAs and the 20 & 50 EMAs.
Cloud Coloring: The color of each cloud is determined by the relationship between the two EMAs that define it (e.g., if EMA 10 is above EMA 20, the first cloud is bullish-colored).
ADX Filter Logic: The script calculates the ADX value. If the "Use ADX Trend Filter?" input is checked and the calculated ADX is below the specified "ADX Trend Threshold", the script considers the market potentially ranging.
ADX Visual Effect: During detected ranging periods (if the ADX filter is active), the plotCloud12Color and plotCloud23Color variables are assigned a neutral grey color instead of their normal bullish/bearish colors before being passed to the fill() function.
Alert Logic: Boolean variables track the specific conditions (crossovers, cloud alignment, filter positions, ADX state). The alertcondition() function creates triggerable alerts based on these pre-defined conditions.
Potential Interpretation (Not Financial Advice):
Trend Alignment: When both clouds share the same directional color (e.g., both bullish - Green & Aqua) and price is on the corresponding side of the 200 EMA filter, it may suggest a stronger, more aligned trend. Conversely, conflicting cloud colors may indicate indecision or transition.
Dynamic Support/Resistance: The EMA lines themselves (especially the 20, 50, and 200) can sometimes act as dynamic levels where price might react.
Range Warning: Greyed-out clouds (when ADX filter is enabled) serve as a visual warning that trend-based strategies might face increased difficulty or whipsaws.
Confluence Alerts: The specific confluence alerts signal moments where multiple conditions align (crossover + cloud agreement + filters), which some traders might view as higher-probability setups.
Customization:
All EMA lengths (10, 20, 50, 200) are adjustable via the Inputs menu.
The ADX length and threshold are configurable.
The MA Trend Filter and ADX Trend Filter can be independently enabled or disabled.
Disclaimer:
This indicator is provided for informational and educational purposes only. Trading financial markets involves significant risk. Past performance is not indicative of future results. Always conduct your own thorough analysis and consider your risk tolerance before making any trading decisions. This indicator should be used in conjunction with other analysis methods and tools. Do not trade based solely on the signals or visuals provided by this indicator.

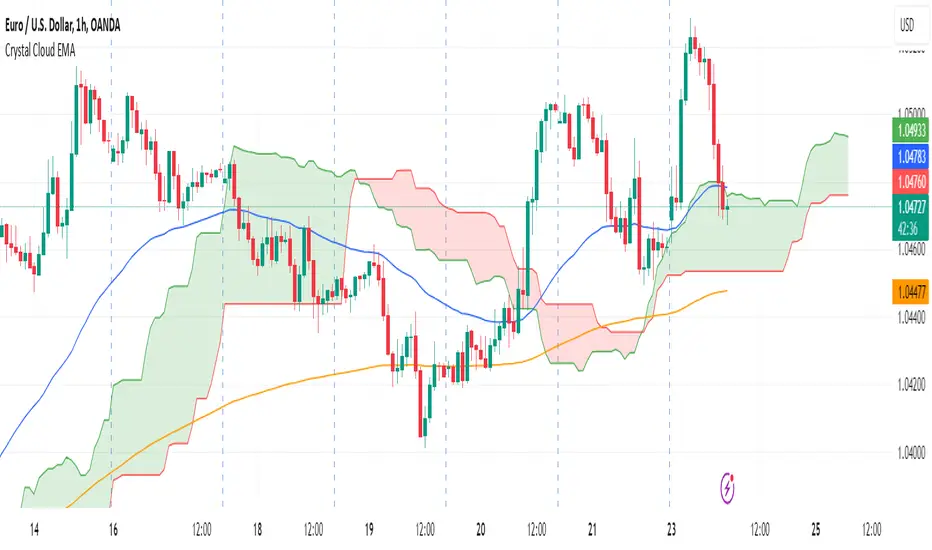
Crystal Cloud EMA# Crystal Cloud EMA Indicator 🚀
The **Crystal Cloud EMA Indicator** is a hybrid technical analysis tool that uniquely merges the multi-dimensional perspective of the Ichimoku Cloud with the precision of EMA crossovers (EMA 50 & EMA 200). This integration is designed to help traders identify key market trends, dynamic support and resistance zones, and potential momentum shifts with enhanced clarity and reliability.
---
## Key Components & Originality
### Ichimoku Cloud
- **Dynamic Support & Resistance:**
Utilizes standard Ichimoku calculations to form a cloud (Kumo) that highlights areas where price may find support or resistance.
- **Visual Clarity:**
The cloud’s upper and lower boundaries provide clear visual cues of market sentiment, helping to identify potential reversal or consolidation zones.
### EMA 50 & EMA 200
- **Trend Confirmation:**
These exponential moving averages smooth price data to reveal underlying trends.
- **Crossover Signals:**
A crossover of EMA 50 and EMA 200 is used as a signal confirmation—when EMA 50 crosses above EMA 200, it suggests a bullish trend; when it crosses below, it indicates a bearish trend.
### Unique Integration
- **Combined Analysis for Enhanced Accuracy:**
By fusing the Ichimoku Cloud’s dynamic support/resistance zones with the precise timing of EMA crossovers, the indicator minimizes false signals.
- **Confluence of Methods:**
Only when both the cloud position and EMA crossover align does the indicator generate a trading signal, offering a more robust framework than using either method in isolation.
---
## How It Works
1. **Cloud Evaluation:**
- The indicator calculates the Ichimoku Cloud using traditional parameters, establishing dynamic zones where price reactions are likely.
- It monitors how price interacts with these zones, signaling potential momentum shifts when the price moves in or out of the cloud.
2. **EMA Crossover Analysis:**
- Simultaneously, it computes EMA 50 and EMA 200.
- **Bullish Condition:** When price is above the cloud and EMA 50 crosses above EMA 200.
- **Bearish Condition:** When price is below the cloud and EMA 50 crosses below EMA 200.
3. **Signal Confirmation:**
- A breakout from the cloud, in conjunction with a crossover, further validates the strength of the trend.
- This dual confirmation approach filters out market noise and increases the reliability of the signals.
---
## Trading Strategy & Usage
### Buy Signal
- **Conditions:**
- Price is trading above the Ichimoku Cloud.
- EMA 50 crosses above EMA 200.
- A confirmed breakout above the cloud supports the bullish trend.
- **Application:**
- Enter long positions when these conditions align.
- Use the cloud’s lower boundary for potential stop-loss placement and set profit targets based on key resistance levels identified by the cloud.
### Sell Signal
- **Conditions:**
- Price is trading below the Ichimoku Cloud.
- EMA 50 crosses below EMA 200.
- A breakdown below the cloud reinforces the bearish trend.
- **Application:**
- Enter short positions under these conditions.
- Use the cloud’s upper boundary as a reference for setting stop-loss orders and profit targets.
### Best Timeframes & Trading Styles
- **Timeframes:**
Optimally used on M30 and higher timeframes to ensure trend reliability and reduce market noise.
- **Trading Styles:**
Suitable for swing trading, intraday trading, and momentum-based strategies.
- **Risk Management:**
Always complement indicator signals with additional analysis (like volume or price action) and apply proper risk management techniques.
---
## Important Note
This indicator is a **technical analysis tool** designed to assist traders in identifying market trends and potential reversal points. It should be used in conjunction with comprehensive market analysis and proper risk management. Trading decisions should not rely solely on this indicator.
EMA RSI Trend Reversal Ver.1Overview:
The EMA RSI Trend Reversal indicator combines the power of two well-known technical indicators—Exponential Moving Averages (EMAs) and the Relative Strength Index (RSI)—to identify potential trend reversal points in the market. The strategy looks for key crossovers between the fast and slow EMAs, and uses the RSI to confirm the strength of the trend. This combination helps to avoid false signals during sideways market conditions.
How It Works:
Buy Signal:
The Fast EMA (9) crosses above the Slow EMA (21), indicating a potential shift from a downtrend to an uptrend.
The RSI is above 50, confirming strong bullish momentum.
Visual Signal: A green arrow below the price bar and a Buy label are plotted on the chart.
Sell Signal:
The Fast EMA (9) crosses below the Slow EMA (21), indicating a potential shift from an uptrend to a downtrend.
The RSI is below 50, confirming weak or bearish momentum.
Visual Signal: A red arrow above the price bar and a Sell label are plotted on the chart.
Key Features:
EMA Crossovers: The Fast EMA crossing above the Slow EMA signals potential buying opportunities, while the Fast EMA crossing below the Slow EMA signals potential selling opportunities.
RSI Confirmation: The RSI helps confirm trend strength—values above 50 indicate bullish momentum, while values below 50 indicate bearish momentum.
Visual Cues: The strategy uses green arrows and red arrows along with Buy and Sell labels for clear visual signals of when to enter or exit trades.
Signal Interpretation:
Green Arrow / Buy Label: The Fast EMA (9) has crossed above the Slow EMA (21), and the RSI is above 50. This is a signal to buy or enter a long position.
Red Arrow / Sell Label: The Fast EMA (9) has crossed below the Slow EMA (21), and the RSI is below 50. This is a signal to sell or exit the long position.
Strategy Settings:
Fast EMA Length: Set to 9 (this determines how sensitive the fast EMA is to recent price movements).
Slow EMA Length: Set to 21 (this smooths out price movements to identify the broader trend).
RSI Length: Set to 14 (default setting to track momentum strength).
RSI Level: Set to 50 (used to confirm the strength of the trend—above 50 for buy signals, below 50 for sell signals).
Risk Management (Optional):
Use take profit and stop loss based on your preferred risk-to-reward ratio. For example, you can set a 2:1 risk-to-reward ratio (2x take profit for every 1x stop loss).
Backtesting and Optimization:
Backtest the strategy on TradingView by opening the Strategy Tester tab. This will allow you to see how the strategy would have performed on historical data.
Optimization: Adjust the EMA lengths, RSI period, and risk-to-reward settings based on your asset and time frame.
Limitations:
False Signals in Sideways Markets: Like any trend-following strategy, this indicator may generate false signals during periods of low volatility or sideways movement.
Not Suitable for All Market Conditions: This indicator performs best in trending markets. It may underperform in choppy or range-bound markets.
Strategy Example:
XRP/USD Example:
If you're trading XRP/USD and the Fast EMA (9) crosses above the Slow EMA (21), while the RSI is above 50, the indicator will signal a Buy.
Conversely, if the Fast EMA (9) crosses below the Slow EMA (21), and the RSI is below 50, the indicator will signal a Sell.
Bitcoin (BTC/USD):
On the BTC/USD chart, when the indicator shows a green arrow and a Buy label, it’s signaling a potential long entry. Similarly, a red arrow and Sell label indicate a short entry or exit from a previous long position.
Summary:
The EMA RSI Trend Reversal Indicator helps traders identify potential trend reversals with clear buy and sell signals based on the EMA crossovers and RSI confirmations. By using green arrows and red arrows, along with Buy and Sell labels, this strategy offers easy-to-understand visual signals for entering and exiting trades. Combine this with effective risk management and backtesting to optimize your trading performance.

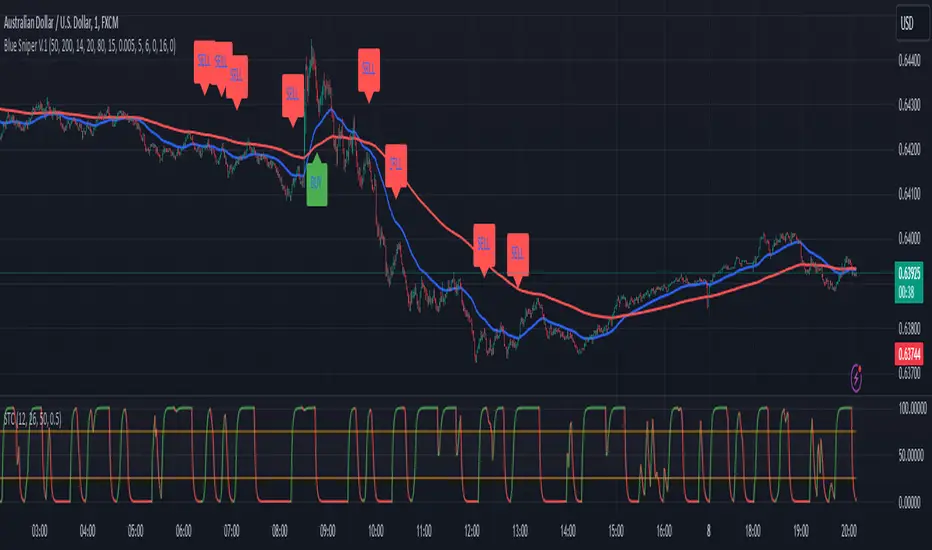
Blue Sniper V.1Overview
This Pine Script indicator is designed to generate Buy and Sell signals based on proximity to the 50 EMA, stochastic oscillator levels, retracement conditions, and EMA slopes. It is tailored for trending market conditions, making it ideal for identifying high-probability entry points during strong bullish or bearish trends.
Key Features:
Filters out signals in non-trending conditions.
Focuses on retracements near the 50 EMA for precise entries.
Supports alert notifications for Buy and Sell signals.
Includes a cooldown mechanism to prevent signal spamming.
Allows time-based filtering to restrict signals to a specific trading window.
How It Works
Trending Market Conditions
The indicator is most effective when the market exhibits a clear trend. It uses two exponential moving averages (50 EMA and 200 EMA) to determine the overall market trend:
Bullish Trend: 50 EMA is above the 200 EMA, and both EMAs have upward slopes.
Bearish Trend: 50 EMA is below the 200 EMA, and both EMAs have downward slopes.
Buy and Sell Conditions
Buy Signal:
The market is in a bullish trend.
Stochastic oscillator is in the oversold zone.
Price retraces upwards, breaking away from the recent low by more than 1.5 ATR.
Price is near the 50 EMA (within the defined proximity percentage).
Sell Signal:
The market is in a bearish trend.
Stochastic oscillator is in the overbought zone.
Price retraces downwards, breaking away from the recent high by more than 1.5 ATR.
Price is near the 50 EMA.
Outputs
Signals:
Buy Signal: Green "BUY" label below the price bar.
Sell Signal: Red "SELL" label above the price bar.
Alerts:
Alerts are triggered for Buy and Sell signals if conditions are met within the specified time window (if enabled).
EMA Visualization:
50 EMA (blue line).
200 EMA (red line).
Limitations
Not Suitable for Non-Trending Markets: This script is designed for trending conditions. Sideways or choppy markets may produce false signals.
Proximity Tolerance: Adjust the proximityPercent to prevent signals from triggering too frequently during minor oscillations around the 50 EMA.
No Guarantee of Accuracy: As with any technical indicator, it should be used in conjunction with other tools and analysis.
Prometheus Polarized Fractal Efficiency (PFE)This indicator uses market data to calculate Polarized Fractal Efficiency (PFE) on an asset, so traders can have a better idea of which direction it may go.
Users can control the lookback length for the fractal calculation, the lookback length for the Exponential Moving Average (EMA), and whether or not to display lines at the -50 and 50 level, or -25 and 25 level.
Polarized Fractal Efficiency:
The Polarized Fractal Efficiency (PFE) indicator is a value between -100 and 100 with 0 as a midpoint.
A PFE above 0 indicates the asset may trend higher, a PFE below 0 indicates the asset may trend lower.
There are many ways to trade with PFE, the intuitive trend riding as described above, or reversals.
Even when the PFE is above 0, if it gets high enough, it may also be an indication of a reversal. A PFE of 90 - 100, or -100 - -90, may indicate price is ready to revert the other direction. Furthermore, traders already in a position may look to breaks of other levels to be their take profit or stop out spot.
Calculation:
Pi = 100 x (Price - Price )2 + N2 / Summation, j= 0, to N-2 (Price - Price )2 + 1
If Close < Close Pi = -Pi
PFEi = EMA(Pi, M)
Where:
N = period of indicator
M = smoothing period
Citation: www.investopedia.com
Scenarios:
Inputs are (9, 5) and every display option is on.
Trend example
Step 1: A short trade appears as PFE crosses below -25. We reach a safe take profit as PFE crosses below -50. Traders can use these levels to exit as well as enter.
Step 2: On the cross above 25 there is a safe long. As the PFE value breaks 0 a safe, early take profit could be appropriate for this trade. No guarantee we would see 50.
Step 3: Long scenario at break of 25, straight to 50. Simple, straightforward setup.
Step 4: This long results in a stop loss. Once again entry as PFE crosses 25, but as we cross the 0 line it is for a loss.
Step 5: The last trade in this example is reminiscent of step 3. This is a short trade entry at break of 25 and exit at break of 50.
Traders have liberty to use the PFE value to determine spots to enter and exit trades, long or short. 25 and 50 were chosen arbitrarily, values like 10 and 60 may work as well, we encourage traders to use their own discretion along with tools.
Reversal example
Step 1: PFE is around -100, crossing below it at one point! Strong zone for a potential reversal.
Step 2: PFE crosses above 25 adding conviction.
Step 3: Option to exit at 70.
Step 4: Option to exit at 90.
There is no “one size fits all method”, this approach may be more intuitive for some users and is just as feasible as the first.
Longer trend example
Step 1: Using -50 and 50 this time instead of -25 and 25 to be safer on our entries we see a short here. Was a good entry and as the value gets closer to -70 we can safely close.
Step 2: On this candle we see a long for the break of 50. On the next candle we break the 0 line, but because of our safe entry at 50, we could hold this and only stop out at a break of -25. We get close but stay in it and close at 70.
Step 3: Break of 50 for a long once again. This time the break of 0 line occurs as we are in profit, not letting a green trade go red is a golden rule of trading, so an early exit here.
Step 4: Same at step 2, break of 50 to long and stay in it, not stopping out at break of 0 line. The PFE value eventually reaches 70 and there is a good exit.
Quicker Reversal example
Step 1: Notice a close with PFE below -90, enter long for the reversal. Then close for profit when the PFE crosses above 70.
Step 2: When the PFE breaks above 90 we have a short entry. Like the long closing it when it crosses below -70.
Step 3: This step is the same setup as step 2. As PFE breaks above 90 we have a short entry. Closing it when it crosses below -70.
Recap:
Described above are 4 different examples with many different trades. Both trend and reversal trades. The PFE value is an indicator that can be used by traders in many different ways and Prometheus encourages traders to use their own discretion along with tools and not follow indicators blindly.
Options:
Users can control the input for the lookback of the indicator. The default is 9.
The smoothing factor for the EMA is also changeable, default is 5.
Users have options to display lines at -50, -25, 25, and 50.

Williams Fractal Hariss 369The core concept of this indictor is to detect fractal high and fractal low where price reaction is stronger- whether in bullish or bearish structure. Trading with indicator is very simple. No need to go with any complex data / calculation.
Buy when price crosses and closes above the last fractal high. To strengthen the strategy, buy when prices crosses and closes above last fractal high and price is above 50 SMA. 50 SMA is nice moving average to catch intraday movement. Stop loss is last swing low or below 50 SMA. Target, 1:2 or trail with 50 SMA. Keep trailing till price is above 50 SMA. You can also exit when price crosses below last fractal low. SL is purely one's risk appetite.
To sell, let price crosses and closes below the last fractal low and price is below 50 SMA. SL is above 50 SMA or just above last fractal high. Target 1:2 or trail with 50 SMA.
Before trading with this indicator, open any asset and place this indicator. Check the suitability of this indicator for trading see your comfortability and risk concern.

RSI VWAP EMA ON CHART1. Understand the components
VWAP (Volume Weighted Average Price)
Green: price is above VWAP → bullish trend
Red: price is below VWAP → bearish trend
Blue: price exactly at VWAP → neutral
Acts as a dynamic trend line and support/resistance.
4 Moving Averages (MA1–MA4)
Customizable lengths and type (SMA or EMA).
Useful for trend confirmation and dynamic support/resistance.
Typically:
MA1 = fastest (short-term)
MA4 = slowest (long-term)
When price is above multiple MAs → strong bullish trend; below → bearish trend.
RSI Overlay with VWAP Alignment
RSI line normalized to price scale.
Background shading indicates momentum aligned with VWAP trend:
Green shading: RSI > 50 and price above VWAP → bullish momentum
Red shading: RSI < 50 and price below VWAP → bearish momentum
Gray areas: neutral or momentum does not align with VWAP.
2. Basic usage workflow
Trend Confirmation
Look at VWAP color: price above → bullish, below → bearish.
Check RSI + VWAP shading: green confirms bullish momentum, red confirms bearish momentum.
Check MA alignment: shorter MAs above longer MAs = stronger bullish trend; vice versa for bearish.
Entry Signals (Scalping)
Long (Buy) Setup
Price above VWAP (green)
RSI green shading (RSI > 50)
Shorter MAs above longer MAs (trend support)
Short (Sell) Setup
Price below VWAP (red)
RSI red shading (RSI < 50)
Shorter MAs below longer MAs
Exits / Stops
Exit if price closes against VWAP trend (e.g., price drops below VWAP during a bullish trade).
Use nearest MA support/resistance as stop-loss or take-profit zones.
3. Optional adjustments for scalping
RSI length / thresholds
Shorter RSI (7–10) → faster response for scalping.
Standard RSI (14) → smoother, fewer false signals.
MA lengths
Short-term: 20–50
Medium-term: 50–100
Long-term: 100–200
Can tweak for the timeframe you trade (1m, 5m, 15m).
Timeframe
VWAP works best on intraday charts (1m, 5m, 15m).
Use higher timeframe (e.g., 15m or 1h) for trend direction and lower timeframe (1m–5m) for entries.
4. Example Scalping Setup
Bullish setup (buy):
Price above VWAP → VWAP green
RSI > 50 and green shading
Shorter MAs above longer MAs
Enter on small pullback or breakout
Stop: below nearest MA or VWAP
Bearish setup (sell):
Price below VWAP → VWAP red
RSI < 50 and red shading
Shorter MAs below longer MAs
Enter on minor bounce or breakdown
Stop: above nearest MA or VWAP
5. Visual cues summary
Element Interpretation
VWAP Green Price above VWAP → bullish trend
VWAP Red Price below VWAP → bearish trend
RSI Green Shading Bullish momentum aligns with VWAP
RSI Red Shading Bearish momentum aligns with VWAP
MA Alignment Trend strength (short above long = bullish, short below long = bearish)

VWAP + 4 MAs with RSI Overlay & VWAP Alignment1. Understand the components
VWAP (Volume Weighted Average Price)
Green: price is above VWAP → bullish trend
Red: price is below VWAP → bearish trend
Blue: price exactly at VWAP → neutral
Acts as a dynamic trend line and support/resistance.
4 Moving Averages (MA1–MA4)
Customizable lengths and type (SMA or EMA).
Useful for trend confirmation and dynamic support/resistance.
Typically:
MA1 = fastest (short-term)
MA4 = slowest (long-term)
When price is above multiple MAs → strong bullish trend; below → bearish trend.
RSI Overlay with VWAP Alignment
RSI line normalized to price scale.
Background shading indicates momentum aligned with VWAP trend:
Green shading: RSI > 50 and price above VWAP → bullish momentum
Red shading: RSI < 50 and price below VWAP → bearish momentum
Gray areas: neutral or momentum does not align with VWAP.
2. Basic usage workflow
Trend Confirmation
Look at VWAP color: price above → bullish, below → bearish.
Check RSI + VWAP shading: green confirms bullish momentum, red confirms bearish momentum.
Check MA alignment: shorter MAs above longer MAs = stronger bullish trend; vice versa for bearish.
Entry Signals (Scalping)
Long (Buy) Setup
Price above VWAP (green)
RSI green shading (RSI > 50)
Shorter MAs above longer MAs (trend support)
Short (Sell) Setup
Price below VWAP (red)
RSI red shading (RSI < 50)
Shorter MAs below longer MAs
Exits / Stops
Exit if price closes against VWAP trend (e.g., price drops below VWAP during a bullish trade).
Use nearest MA support/resistance as stop-loss or take-profit zones.
3. Optional adjustments for scalping
RSI length / thresholds
Shorter RSI (7–10) → faster response for scalping.
Standard RSI (14) → smoother, fewer false signals.
MA lengths
Short-term: 20–50
Medium-term: 50–100
Long-term: 100–200
Can tweak for the timeframe you trade (1m, 5m, 15m).
Timeframe
VWAP works best on intraday charts (1m, 5m, 15m).
Use higher timeframe (e.g., 15m or 1h) for trend direction and lower timeframe (1m–5m) for entries.
4. Example Scalping Setup
Bullish setup (buy):
Price above VWAP → VWAP green
RSI > 50 and green shading
Shorter MAs above longer MAs
Enter on small pullback or breakout
Stop: below nearest MA or VWAP
Bearish setup (sell):
Price below VWAP → VWAP red
RSI < 50 and red shading
Shorter MAs below longer MAs
Enter on minor bounce or breakdown
Stop: above nearest MA or VWAP
5. Visual cues summary
Element Interpretation
VWAP Green Price above VWAP → bullish trend
VWAP Red Price below VWAP → bearish trend
RSI Green Shading Bullish momentum aligns with VWAP
RSI Red Shading Bearish momentum aligns with VWAP
MA Alignment Trend strength (short above long = bullish, short below long = bearish)

Market Electromagnetic Field [The_lurker]Market Electromagnetic Field
An innovative analytical indicator that presents a completely new model for understanding market dynamics, inspired by the laws of electromagnetic physics — but it's not a rhetorical metaphor, rather a complete mathematical system.
Unlike traditional indicators that focus on price or momentum, this indicator portrays the market as a closed physical system, where:
⚡ Candles = Electric charges (positive at bullish close, negative at bearish)
⚡ Buyers and Sellers = Two opposing poles where pressure accumulates
⚡ Market tension = Voltage difference between the poles
⚡ Price breakout = Electrical discharge after sufficient energy accumulation
█ Core Concept
Markets don't move randomly, but follow a clear physical cycle:
Accumulation → Tension → Discharge → Stabilization → New Accumulation
When charges accumulate (through strong candles with high volume) and exceed a certain "electrical capacitance" threshold, the indicator issues a "⚡ DISCHARGE IMMINENT" alert — meaning a price explosion is imminent, giving the trader an opportunity to enter before the move begins.
█ Competitive Advantage
- Predictive forecasting (not confirmatory after the event)
- Smart multi-layer filtering reduces false signals
- Animated 3D visual representation makes reading price conditions instant and intuitive — without need for number analysis
█ Theoretical Physical Foundation
The indicator doesn't use physical terms for decoration, but applies mathematical laws with precise market adjustments:
⚡ Coulomb's Law
Physics: F = k × (q₁ × q₂) / r²
Market: Field Intensity = 4 × norm_positive × norm_negative
Peaks at equilibrium (0.5 × 0.5 × 4 = 1.0), and decreases at dominance — because conflict increases at parity.
⚡ Ohm's Law
Physics: V = I × R
Market: Voltage = norm_positive − norm_negative
Measures balance of power:
- +1 = Absolute buying dominance
- −1 = Absolute selling dominance
- 0 = Balance
⚡ Capacitance
Physics: C = Q / V
Market: Capacitance = |Voltage| × Field Intensity
Represents stored energy ready for discharge — increases with bias combined with high interaction.
⚡ Electrical Discharge
Physics: Occurs when exceeding insulation threshold
Market: Discharge Probability = min(Capacitance / Discharge Threshold, 1.0)
When ≥ 0.9: "⚡ DISCHARGE IMMINENT"
📌 Key Note:
Maximum capacitance doesn't occur at absolute dominance (where field intensity = 0), nor at perfect balance (where voltage = 0), but at moderate bias (±30–50%) with high interaction (field intensity > 25%) — i.e., in moments of "pressure before breakout".
█ Detailed Calculation Mechanism
⚡ Phase 1: Candle Polarity
polarity = (close − open) / (high − low)
- +1.0: Complete bullish candle (Bullish Marubozu)
- −1.0: Complete bearish candle (Bearish Marubozu)
- 0.0: Doji (no decision)
- Intermediate values: Represent the ratio of candle body to its range — reducing the effect of long-shadow candles
⚡ Phase 2: Volume Weight
vol_weight = volume / SMA(volume, lookback)
A candle with 150% of average volume = 1.5x stronger charge
⚡ Phase 3: Adaptive Factor
adaptive_factor = ATR(lookback) / SMA(ATR, lookback × 2)
- In volatile markets: Increases sensitivity
- In quiet markets: Reduces noise
- Always recommended to keep it enabled
⚡ Phase 4–6: Charge Accumulation and Normalization
Charges are summed over lookback candles, then ratios are normalized:
norm_positive = positive_charge / total_charge
norm_negative = negative_charge / total_charge
So that: norm_positive + norm_negative = 1 — for easier comparison
⚡ Phase 7: Field Calculations
voltage = norm_positive − norm_negative
field_intensity = 4 × norm_positive × norm_negative × field_sensitivity
capacitance = |voltage| × field_intensity
discharge_prob = min(capacitance / discharge_threshold, 1.0)
█ Settings
⚡ Electromagnetic Model
Lookback Period
- Default: 20
- Range: 5–100
- Recommendations:
- Scalping: 10–15
- Day Trading: 20
- Swing: 30–50
- Investing: 50–100
Discharge Threshold
- Default: 0.7
- Range: 0.3–0.95
- Recommendations:
- Speed + Noise: 0.5–0.6
- Balance: 0.7
- High Accuracy: 0.8–0.95
Field Sensitivity
- Default: 1.0
- Range: 0.5–2.0
- Recommendations:
- Amplify Conflict: 1.2–1.5
- Natural: 1.0
- Calm: 0.5–0.8
Adaptive Mode
- Default: Enabled
- Always keep it enabled
🔬 Dynamic Filters
All enabled filters must pass for discharge signal to appear.
Volume Filter
- Condition: volume > SMA(volume) × vol_multiplier
- Function: Excludes "weak" candles not supported by volume
- Recommendation: Enabled (especially for stocks and forex)
Volatility Filter
- Condition: STDEV > SMA(STDEV) × 0.5
- Function: Ignores sideways stagnation periods
- Recommendation: Always enabled
Trend Filter
- Condition: Voltage alignment with fast/slow EMA
- Function: Reduces counter-trend signals
- Recommendation: Enabled for swing/investing only
Volume Threshold
- Default: 1.2
- Recommendations:
- 1.0–1.2: High sensitivity
- 1.5–2.0: Exclusive to high volume
🎨 Visual Settings
Settings improve visual reading experience — don't affect calculations.
Scale Factor
- Default: 600
- Higher = Larger scene (200–1200)
Horizontal Shift
- Default: 180
- Horizontal shift to the left — to focus on last candle
Pole Size
- Default: 60
- Base sphere size (30–120)
Field Lines
- Default: 8
- Number of field lines (4–16) — 8 is ideal balance
Colors
- Green/Red/Blue/Orange
- Fully customizable
█ Visual Representation: A Visual Language for Diagnosing Price Conditions
✨ Design Philosophy
The representation isn't "decoration", but a complete cognitive model — each element carries information, and element interaction tells a complete story.
The brain perceives changes in size, color, and movement 60,000 times faster than reading numbers — so you can "sense" the change before your eye finishes scanning.
═════════════════════════════════════════════════════════════
🟢 Positive Pole (Green Sphere — Left)
═════════════════════════════════════════════════════════════
What does it represent?
Active buying pressure accumulation — not just an uptrend, but real demand force supported by volume and volatility.
● Dynamic Size
Size = pole_size × (0.7 + norm_positive × 0.6)
- 70% of base size = No significant charge
- 130% of base size = Complete dominance
- The larger the sphere: Greater buyer dominance, higher probability of bullish continuation
Size Interpretation:
- Large sphere (>55%): Strong buying pressure — Buyers dominate
- Medium sphere (45–55%): Relative balance with buying bias
- Small sphere (<45%): Weak buying pressure — Sellers dominate
● Lighting and Transparency
- 20% transparency (when Bias = +1): Pole currently active — Bullish direction
- 50% transparency (when Bias ≠ +1): Pole inactive — Not the prevailing direction
Lighting = Current activity, while Size = Historical accumulation
● Pulsing Inner Glow
A smaller sphere pulses automatically when Bias = +1:
inner_pulse = 0.4 + 0.1 × sin(anim_time × 3)
Symbolizes continuity of buy order flow — not static dominance.
● Orbital Rings
Two rings rotating at different speeds and directions:
- Inner: 1.3× sphere size — Direct influence range
- Outer: 1.6× sphere size — Extended influence range
Represent "influence zone" of buyers:
- Continuous rotation = Stability and momentum
- Slowdown = Momentum exhaustion
● Percentage
Displayed below sphere: norm_positive × 100
- >55% = Clear dominance
- 45–55% = Balance
- <45% = Weakness
═════════════════════════════════════════════════════════════
🔴 Negative Pole (Red Sphere — Right)
═════════════════════════════════════════════════════════════
What does it represent?
Active selling pressure accumulation — whether cumulative selling (smart distribution) or panic selling (position liquidation).
● Visual Dynamics
Same size, lighting, and inner glow mechanism — but in red.
Key Difference:
- Rotation is reversed (counter-clockwise)
- Visually distinguishes "buy flow" from "sell flow"
- Allows reading direction at a glance — even for colorblind users
📌 Pole Reading Summary:
🟢 Large + Bright green sphere = Active buying force
🔴 Large + Bright red sphere = Active selling force
🟢🔴 Both large but dim = Energy accumulation (before discharge)
⚪ Both small = Stagnation / Low liquidity
═════════════════════════════════════════════════════════════
🔵 Field Lines (Curved Blue Lines)
═════════════════════════════════════════════════════════════
What do they represent?
Energy flow paths between poles — the arena where price battle is fought.
● Number of Lines
4–16 lines (Default: 8)
More lines: Greater sense of "interaction density"
● Arc Height
arc_h = (i − half_lines) × 15 × field_intensity × 2
- High field intensity = Highly elevated lines (like waves)
- Low intensity = Nearly straight lines
● Oscillating Transparency
transp = 30 + phase × 40
where phase = sin(anim_time × 2 + i × 0.5) × 0.5 + 0.5
Creates illusion of "flowing current" — not static lines
● Asymmetric Curvature
- Upper lines curve upward
- Lower lines curve downward
- Adds 3D depth and shows "pressure" direction
⚡ Pro Tip:
When you see lines suddenly "contract" (straighten), while both spheres are large — this is an early indicator of impending discharge, because the interaction is losing its flexibility.
═════════════════════════════════════════════════════════════
⚪ Moving Particles
═════════════════════════════════════════════════════════════
What do they represent?
Real liquidity flow in the market — who's driving price right now.
● Number and Movement
- 6 particles covering most field lines
- Move sinusoidally along the arc:
t = (sin(phase_val) + 1) / 2
- High speed = High trading activity
- Clustering at a pole = That side's control
● Color Gradient
From green (at positive pole) to red (at negative)
Shows "energy transformation":
- Green particle = Pure buying energy
- Orange particle = Conflict zone
- Red particle = Pure selling energy
📌 How to Read Them?
- Moving left to right (🟢 → 🔴): Buy flow → Bullish push
- Moving right to left (🔴 → 🟢): Sell flow → Bearish push
- Clustered in middle: Balanced conflict — Wait for breakout
═════════════════════════════════════════════════════════════
🟠 Discharge Zone (Orange Glow — Center)
═════════════════════════════════════════════════════════════
What does it represent?
Point of stored energy accumulation not yet discharged — heart of the early warning system.
● Glow Stages
Initial Warning (discharge_prob > 0.3):
- Dim orange circle (70% transparency)
- Meaning: Watch, don't enter yet
High Tension (discharge_prob ≥ 0.7):
- Stronger glow + "⚠️ HIGH TENSION" text
- Meaning: Prepare — Set pending orders
Imminent Discharge (discharge_prob ≥ 0.9):
- Bright glow + "⚡ DISCHARGE IMMINENT" text
- Meaning: Enter with direction (after candle confirmation)
● Layered Glow Effect (Glow Layering)
3 concentric circles with increasing transparency:
- Inner: 20%
- Middle: 35%
- Outer: 50%
Result: Realistic aura resembling actual electrical discharge.
📌 Why in the Center?
Because discharge always starts from the relative balance zone — where opposing pressures meet.
═════════════════════════════════════════════════════════════
📊 Voltage Meter (Bottom of Scene)
═════════════════════════════════════════════════════════════
What does it represent?
Simplified numeric indicator of voltage difference — for those who prefer numerical reading.
● Components
- Gray bar: Full range (−100% to +100%)
- Green fill: Positive voltage (extends right)
- Red fill: Negative voltage (extends left)
- Lightning symbol (⚡): Above center — reminder it's an "electrical gauge"
- Text value: Like "+23.4%" — in direction color
● Voltage Reading Interpretation
+50% to +100%:
Overwhelming buying dominance — Beware of saturation, may precede correction
+20% to +50%:
Strong buying dominance — Suitable for buying with trend
+5% to +20%:
Slight bullish bias — Wait for additional confirmation
−5% to +5%:
Balance/Neutral — Avoid entry or wait for breakout
−5% to −20%:
Slight bearish bias — Wait for confirmation
−20% to −50%:
Strong selling dominance — Suitable for selling with trend
−50% to −100%:
Overwhelming selling dominance — Beware of saturation, may precede bounce
═════════════════════════════════════════════════════════════
📈 Field Strength Indicator (Top of Scene)
═════════════════════════════════════════════════════════════
What it displays: "Field: XX.X%"
Meaning: Strength of conflict between buyers and sellers.
● Reading Interpretation
0–5%:
- Appearance: Nearly straight lines, transparent
- Meaning: Complete control by one side
- Strategy: Trend Following
5–15%:
- Appearance: Slight curvature
- Meaning: Clear direction with light resistance
- Strategy: Enter with trend
15–25%:
- Appearance: Medium curvature, clear lines
- Meaning: Balanced conflict
- Strategy: Range trading or waiting
25–35%:
- Appearance: High curvature, clear density
- Meaning: Strong conflict, high uncertainty
- Strategy: Volatility trading or prepare for discharge
35%+:
- Appearance: Very high lines, strong glow
- Meaning: Peak tension
- Strategy: Best discharge opportunities
📌 Golden Relationship:
Highest discharge probability when:
Field Strength (25–35%) + Voltage (±30–50%) + High Volume
← This is the "red zone" to monitor carefully.
█ Comprehensive Visual Reading
To read market condition at a glance, follow this sequence:
Step 1: Which sphere is larger?
- 🟢 Green larger ← Dominant buying pressure
- 🔴 Red larger ← Dominant selling pressure
- Equal ← Balance/Conflict
Step 2: Which sphere is bright?
- 🟢 Green bright ← Current bullish direction
- 🔴 Red bright ← Current bearish direction
- Both dim ← Neutral/No clear direction
Step 3: Is there orange glow?
- None ← Discharge probability <30%
- 🟠 Dim glow ← Discharge probability 30–70%
- 🟠 Strong glow with text ← Discharge probability >70%
Step 4: What's the voltage meter reading?
- Strong positive ← Confirms buying dominance
- Strong negative ← Confirms selling dominance
- Near zero ← No clear direction
█ Practical Visual Reading Examples
Example 1: Ideal Buy Opportunity ⚡🟢
- Green sphere: Large and bright with inner pulse
- Red sphere: Small and dim
- Orange glow: Strong with "DISCHARGE IMMINENT" text
- Voltage meter: +45%
- Field strength: 28%
Interpretation: Strong accumulated buying pressure, bullish explosion imminent
Example 2: Ideal Sell Opportunity ⚡🔴
- Green sphere: Small and dim
- Red sphere: Large and bright with inner pulse
- Orange glow: Strong with "DISCHARGE IMMINENT" text
- Voltage meter: −52%
- Field strength: 31%
Interpretation: Strong accumulated selling pressure, bearish explosion imminent
Example 3: Balance/Wait ⚖️
- Both spheres: Approximately equal in size
- Lighting: Both dim
- Orange glow: Strong
- Voltage meter: +3%
- Field strength: 24%
Interpretation: Strong conflict without clear winner, wait for breakout
Example 4: Clear Uptrend (No Discharge) 📈
- Green sphere: Large and bright
- Red sphere: Very small and dim
- Orange glow: None
- Voltage meter: +68%
- Field strength: 8%
Interpretation: Clear buying control, limited conflict, suitable for following bullish trend
Example 5: Potential Buying Saturation ⚠️
- Green sphere: Very large and bright
- Red sphere: Very small
- Orange glow: Dim
- Voltage meter: +88%
- Field strength: 4%
Interpretation: Absolute buying dominance, may precede bearish correction
█ Trading Signals
⚡ DISCHARGE IMMINENT
Appearance Conditions:
- discharge_prob ≥ 0.9
- All enabled filters passed
- Confirmed (after candle close)
Interpretation:
- Very large energy accumulation
- Pressure reached critical level
- Price explosion expected within 1–3 candles
How to Trade:
1. Determine voltage direction:
• Positive = Expect rise
• Negative = Expect fall
2. Wait for confirmation candle:
• For rise: Bullish candle closing above its open
• For fall: Bearish candle closing below its open
3. Entry: With next candle's open
4. Stop Loss: Behind last local low/high
5. Target: Risk/Reward ratio of at least 1:2
✅ Pro Tips:
- Best results when combined with support/resistance levels
- Avoid entry if voltage is near zero (±5%)
- Increase position size when field strength > 30%
⚠️ HIGH TENSION
Appearance Conditions:
- 0.7 ≤ discharge_prob < 0.9
Interpretation:
- Market in energy accumulation state
- Likely strong move soon, but not immediate
- Accumulation may continue or discharge may occur
How to Benefit:
- Prepare: Set pending orders at potential breakouts
- Monitor: Watch following candles for momentum candle
- Select: Don't enter every signal — choose those aligned with overall trend
█ Trading Strategies
📈 Strategy 1: Discharge Trading (Basic)
Principle: Enter at "DISCHARGE IMMINENT" in voltage direction
Steps:
1. Wait for "⚡ DISCHARGE IMMINENT"
2. Check voltage direction (+/−)
3. Wait for confirmation candle in voltage direction
4. Enter with next candle's open
5. Stop loss behind last low/high
6. Target: 1:2 or 1:3 ratio
Very high success rate when following confirmation conditions.
📈 Strategy 2: Dominance Following
Principle: Trade with dominant pole (largest and brightest sphere)
Steps:
1. Identify dominant pole (largest and brightest)
2. Trade in its direction
3. Beware when sizes converge (conflict)
Suitable for higher timeframes (H1+).
📈 Strategy 3: Reversal Hunting
Principle: Counter-trend entry under certain conditions
Conditions:
- High field strength (>30%)
- Extreme voltage (>±40%)
- Divergence with price (e.g., new price high with declining voltage)
⚠️ High risk — Use small position size.
📈 Strategy 4: Integration with Technical Analysis
Strong Confirmation Examples:
- Resistance breakout + Bullish discharge = Excellent buy signal
- Support break + Bearish discharge = Excellent sell signal
- Head & Shoulders pattern + Increasing negative voltage = Pattern confirmation
- RSI divergence + High field strength = Potential reversal
█ Ready Alerts
Bullish Discharge
- Condition: discharge_prob ≥ 0.9 + Positive voltage + All filters
- Message: "⚡ Bullish discharge"
- Use: High probability buy opportunity
Bearish Discharge
- Condition: discharge_prob ≥ 0.9 + Negative voltage + All filters
- Message: "⚡ Bearish discharge"
- Use: High probability sell opportunity
✅ Tip: Use these alerts with "Once Per Bar" setting to avoid repetition.
█ Data Window Outputs
Bias
- Values: −1 / 0 / +1
- Interpretation: −1 = Bearish, 0 = Neutral, +1 = Bullish
- Use: For integration in automated strategies
Discharge %
- Range: 0–100%
- Interpretation: Discharge probability
- Use: Monitor tension progression (e.g., from 40% to 85% in 5 candles)
Field Strength
- Range: 0–100%
- Interpretation: Conflict intensity
- Use: Identify "opportunity window" (25–35% ideal for discharge)
Voltage
- Range: −100% to +100%
- Interpretation: Balance of power
- Use: Monitor extremes (potential buying/selling saturation)
█ Optimal Settings by Trading Style
Scalping
- Timeframe: 1M–5M
- Lookback: 10–15
- Threshold: 0.5–0.6
- Sensitivity: 1.2–1.5
- Filters: Volume + Volatility
Day Trading
- Timeframe: 15M–1H
- Lookback: 20
- Threshold: 0.7
- Sensitivity: 1.0
- Filters: Volume + Volatility
Swing Trading
- Timeframe: 4H–D1
- Lookback: 30–50
- Threshold: 0.8
- Sensitivity: 0.8
- Filters: Volatility + Trend
Position Trading
- Timeframe: D1–W1
- Lookback: 50–100
- Threshold: 0.85–0.95
- Sensitivity: 0.5–0.8
- Filters: All filters
█ Tips for Optimal Use
1. Start with Default Settings
Try it first as is, then adjust to your style.
2. Watch for Element Alignment
Best signals when:
- Clear voltage (>│20%│)
- Moderate–high field strength (15–35%)
- High discharge probability (>70%)
3. Use Multiple Timeframes
- Higher timeframe: Determine overall trend
- Lower timeframe: Time entry
- Ensure signal alignment between frames
4. Integrate with Other Tools
- Support/Resistance levels
- Trend lines
- Candle patterns
- Volume indicators
5. Respect Risk Management
- Don't risk more than 1–2% of account
- Always use stop loss
- Don't enter every signal — choose the best
█ Important Warnings
⚠️ Not for Standalone Use
The indicator is an analytical support tool — don't use it isolated from technical or fundamental analysis.
⚠️ Doesn't Predict the Future
Calculations are based on historical data — Results are not guaranteed.
⚠️ Markets Differ
You may need to adjust settings for each market:
- Forex: Focus on Volume Filter
- Stocks: Add Trend Filter
- Crypto: Lower Threshold slightly (more volatile)
⚠️ News and Events
The indicator doesn't account for sudden news — Avoid trading before/during major news.
█ Unique Features
✅ First Application of Electromagnetism to Markets
Innovative mathematical model — Not just an ordinary indicator
✅ Predictive Detection of Price Explosions
Alerts before the move happens — Not after
✅ Multi-Layer Filtering
4 smart filters reduce false signals to minimum
✅ Smart Volatility Adaptation
Automatically adjusts sensitivity based on market conditions
✅ Animated 3D Visual Representation
Makes reading instant — Even for beginners
✅ High Flexibility
Works on all assets: Stocks, Forex, Crypto, Commodities
✅ Built-in Ready Alerts
No complex setup needed — Ready for immediate use
█ Conclusion: When Art Meets Science
Market Electromagnetic Field is not just an indicator — but a new analytical philosophy.
It's the bridge between:
- Physics precision in describing dynamic systems
- Market intelligence in generating trading opportunities
- Visual psychology in facilitating instant reading
The result: A tool that isn't read — but watched, felt, and sensed.
When you see the green sphere expanding, the glow intensifying, and particles rushing rightward — you're not seeing numbers, you're seeing market energy breathing.
⚠️ Disclaimer:
This indicator is for educational and analytical purposes only. It does not constitute financial, investment, or trading advice. Use it in conjunction with your own strategy and risk management. Neither TradingView nor the developer is liable for any financial decisions or losses.
المجال الكهرومغناطيسي للسوق - Market Electromagnetic Field
مؤشر تحليلي مبتكر يقدّم نموذجًا جديدًا كليًّا لفهم ديناميكيات السوق، مستوحى من قوانين الفيزياء الكهرومغناطيسية — لكنه ليس استعارة بلاغية، بل نظام رياضي متكامل.
على عكس المؤشرات التقليدية التي تُركّز على السعر أو الزخم، يُصوّر هذا المؤشر السوق كـنظام فيزيائي مغلق، حيث:
⚡ الشموع = شحنات كهربائية (موجبة عند الإغلاق الصاعد، سالبة عند الهابط)
⚡ المشتريون والبائعون = قطبان متعاكسان يتراكم فيهما الضغط
⚡ التوتر السوقي = فرق جهد بين القطبين
⚡ الاختراق السعري = تفريغ كهربائي بعد تراكم طاقة كافية
█ الفكرة الجوهرية
الأسواق لا تتحرك عشوائيًّا، بل تخضع لدورة فيزيائية واضحة:
تراكم → توتر → تفريغ → استقرار → تراكم جديد
عندما تتراكم الشحنات (من خلال شموع قوية بحجم مرتفع) وتتجاوز "السعة الكهربائية" عتبة معيّنة، يُصدر المؤشر تنبيه "⚡ DISCHARGE IMMINENT" — أي أن انفجارًا سعريًّا وشيكًا، مما يمنح المتداول فرصة الدخول قبل بدء الحركة.
█ الميزة التنافسية
- تنبؤ استباقي (ليس تأكيديًّا بعد الحدث)
- فلترة ذكية متعددة الطبقات تقلل الإشارات الكاذبة
- تمثيل بصري ثلاثي الأبعاد متحرك يجعل قراءة الحالة السعرية فورية وبديهية — دون حاجة لتحليل أرقام
█ الأساس النظري الفيزيائي
المؤشر لا يستخدم مصطلحات فيزيائية للزينة، بل يُطبّق القوانين الرياضية مع تعديلات سوقيّة دقيقة:
⚡ قانون كولوم (Coulomb's Law)
الفيزياء: F = k × (q₁ × q₂) / r²
السوق: شدة الحقل = 4 × norm_positive × norm_negative
تصل لذروتها عند التوازن (0.5 × 0.5 × 4 = 1.0)، وتنخفض عند الهيمنة — لأن الصراع يزداد عند التكافؤ.
⚡ قانون أوم (Ohm's Law)
الفيزياء: V = I × R
السوق: الجهد = norm_positive − norm_negative
يقيس ميزان القوى:
- +1 = هيمنة شرائية مطلقة
- −1 = هيمنة بيعية مطلقة
- 0 = توازن
⚡ السعة الكهربائية (Capacitance)
الفيزياء: C = Q / V
السوق: السعة = |الجهد| × شدة الحقل
تمثّل الطاقة المخزّنة القابلة للتفريغ — تزداد عند وجود تحيّز مع تفاعل عالي.
⚡ التفريغ الكهربائي (Discharge)
الفيزياء: يحدث عند تجاوز عتبة العزل
السوق: احتمال التفريغ = min(السعة / عتبة التفريغ, 1.0)
عندما ≥ 0.9: "⚡ DISCHARGE IMMINENT"
📌 ملاحظة جوهرية:
أقصى سعة لا تحدث عند الهيمنة المطلقة (حيث شدة الحقل = 0)، ولا عند التوازن التام (حيث الجهد = 0)، بل عند انحياز متوسط (±30–50%) مع تفاعل عالي (شدة حقل > 25%) — أي في لحظات "الضغط قبل الاختراق".
█ آلية الحساب التفصيلية
⚡ المرحلة 1: قطبية الشمعة
polarity = (close − open) / (high − low)
- +1.0: شمعة صاعدة كاملة (ماروبوزو صاعد)
- −1.0: شمعة هابطة كاملة (ماروبوزو هابط)
- 0.0: دوجي (لا قرار)
- القيم الوسيطة: تمثّل نسبة جسم الشمعة إلى مداها — مما يقلّل تأثير الشموع ذات الظلال الطويلة
⚡ المرحلة 2: وزن الحجم
vol_weight = volume / SMA(volume, lookback)
شمعة بحجم 150% من المتوسط = شحنة أقوى بـ 1.5 مرة
⚡ المرحلة 3: معامل التكيف (Adaptive Factor)
adaptive_factor = ATR(lookback) / SMA(ATR, lookback × 2)
- في الأسواق المتقلبة: يزيد الحساسية
- في الأسواق الهادئة: يقلل الضوضاء
- يوصى دائمًا بتركه مفعّلًا
⚡ المرحلة 4–6: تراكم وتوحيد الشحنات
تُجمّع الشحنات على lookback شمعة، ثم تُوحّد النسب:
norm_positive = positive_charge / total_charge
norm_negative = negative_charge / total_charge
بحيث: norm_positive + norm_negative = 1 — لتسهيل المقارنة
⚡ المرحلة 7: حسابات الحقل
voltage = norm_positive − norm_negative
field_intensity = 4 × norm_positive × norm_negative × field_sensitivity
capacitance = |voltage| × field_intensity
discharge_prob = min(capacitance / discharge_threshold, 1.0)
█ الإعدادات
⚡ Electromagnetic Model
Lookback Period
- الافتراضي: 20
- النطاق: 5–100
- التوصيات:
- المضاربة: 10–15
- اليومي: 20
- السوينغ: 30–50
- الاستثمار: 50–100
Discharge Threshold
- الافتراضي: 0.7
- النطاق: 0.3–0.95
- التوصيات:
- سرعة + ضوضاء: 0.5–0.6
- توازن: 0.7
- دقة عالية: 0.8–0.95
Field Sensitivity
- الافتراضي: 1.0
- النطاق: 0.5–2.0
- التوصيات:
- تضخيم الصراع: 1.2–1.5
- طبيعي: 1.0
- تهدئة: 0.5–0.8
Adaptive Mode
- الافتراضي: مفعّل
- أبقِه دائمًا مفعّلًا
🔬 Dynamic Filters
يجب اجتياز جميع الفلاتر المفعّلة لظهور إشارة التفريغ.
Volume Filter
- الشرط: volume > SMA(volume) × vol_multiplier
- الوظيفة: يستبعد الشموع "الضعيفة" غير المدعومة بحجم
- التوصية: مفعّل (خاصة للأسهم والعملات)
Volatility Filter
- الشرط: STDEV > SMA(STDEV) × 0.5
- الوظيفة: يتجاهل فترات الركود الجانبي
- التوصية: مفعّل دائمًا
Trend Filter
- الشرط: توافق الجهد مع EMA سريع/بطيء
- الوظيفة: يقلل الإشارات المعاكسة للاتجاه العام
- التوصية: مفعّل للسوينغ/الاستثمار فقط
Volume Threshold
- الافتراضي: 1.2
- التوصيات:
- 1.0–1.2: حساسية عالية
- 1.5–2.0: حصرية للحجم العالي
🎨 Visual Settings
الإعدادات تُحسّن تجربة القراءة البصرية — لا تؤثر على الحسابات.
Scale Factor
- الافتراضي: 600
- كلما زاد: المشهد أكبر (200–1200)
Horizontal Shift
- الافتراضي: 180
- إزاحة أفقيّة لليسار — ليركّز على آخر شمعة
Pole Size
- الافتراضي: 60
- حجم الكرات الأساسية (30–120)
Field Lines
- الافتراضي: 8
- عدد خطوط الحقل (4–16) — 8 توازن مثالي
الألوان
- أخضر/أحمر/أزرق/برتقالي
- قابلة للتخصيص بالكامل
█ التمثيل البصري: لغة بصرية لتشخيص الحالة السعرية
✨ الفلسفة التصميمية
التمثيل ليس "زينة"، بل نموذج معرفي متكامل — كل عنصر يحمل معلومة، وتفاعل العناصر يروي قصة كاملة.
العقل يدرك التغيير في الحجم، اللون، والحركة أسرع بـ 60,000 مرة من قراءة الأرقام — لذا يمكنك "الإحساس" بالتغير قبل أن تُنهي العين المسح.
═════════════════════════════════════════════════════════════
🟢 القطب الموجب (الكرة الخضراء — يسار)
═════════════════════════════════════════════════════════════
ماذا يمثّل؟
تراكم ضغط الشراء النشط — ليس مجرد اتجاه صاعد، بل قوة طلب حقيقية مدعومة بحجم وتقلّب.
● الحجم المتغير
حجم = pole_size × (0.7 + norm_positive × 0.6)
- 70% من الحجم الأساسي = لا شحنة تُذكر
- 130% من الحجم الأساسي = هيمنة تامة
- كلما كبرت الكرة: زاد تفوّق المشترين، وارتفع احتمال الاستمرار الصعودي
تفسير الحجم:
- كرة كبيرة (>55%): ضغط شراء قوي — المشترون يسيطرون
- كرة متوسطة (45–55%): توازن نسبي مع ميل للشراء
- كرة صغيرة (<45%): ضعف ضغط الشراء — البائعون يسيطرون
● الإضاءة والشفافية
- شفافية 20% (عند Bias = +1): القطب نشط حالياً — الاتجاه صعودي
- شفافية 50% (عند Bias ≠ +1): القطب غير نشط — ليس الاتجاه السائد
الإضاءة = النشاط الحالي، بينما الحجم = التراكم التاريخي
● التوهج الداخلي النابض
كرة أصغر تنبض تلقائيًّا عند Bias = +1:
inner_pulse = 0.4 + 0.1 × sin(anim_time × 3)
يرمز إلى استمرارية تدفق أوامر الشراء — وليس هيمنة جامدة.
● الحلقات المدارية
حلقتان تدوران بسرعات واتجاهات مختلفة:
- الداخلية: 1.3× حجم الكرة — نطاق التأثير المباشر
- الخارجية: 1.6× حجم الكرة — نطاق التأثير الممتد
تمثّل "نطاق تأثير" المشترين:
- الدوران المستمر = استقرار وزخم
- التباطؤ = نفاد الزخم
● النسبة المئوية
تظهر تحت الكرة: norm_positive × 100
- >55% = هيمنة واضحة
- 45–55% = توازن
- <45% = ضعف
═════════════════════════════════════════════════════════════
🔴 القطب السالب (الكرة الحمراء — يمين)
═════════════════════════════════════════════════════════════
ماذا يمثّل؟
تراكم ضغط البيع النشط — سواء كان بيعًا تراكميًّا (التوزيع الذكي) أو بيعًا هستيريًّا (تصفية مراكز).
● الديناميكيات البصرية
نفس آلية الحجم والإضاءة والتوهج الداخلي — لكن باللون الأحمر.
الفرق الجوهري:
- الدوران معكوس (عكس اتجاه عقارب الساعة)
- يُميّز بصريًّا بين "تدفق الشراء" و"تدفق البيع"
- يسمح بقراءة الاتجاه بنظرة واحدة — حتى للمصابين بعَمَى الألوان
📌 ملخص قراءة القطبين:
🟢 كرة خضراء كبيرة + مضيئة = قوة شرائية نشطة
🔴 كرة حمراء كبيرة + مضيئة = قوة بيعية نشطة
🟢🔴 كرتان كبيرتان لكن خافتتان = تراكم طاقة (قبل التفريغ)
⚪ كرتان صغيرتان = ركود / سيولة منخفضة
═════════════════════════════════════════════════════════════
🔵 خطوط الحقل (الخطوط الزرقاء المنحنية)
═════════════════════════════════════════════════════════════
ماذا تمثّل؟
مسارات تدفق الطاقة بين القطبين — أي الساحة التي تُدار فيها المعركة السعرية.
● عدد الخطوط
4–16 خط (الافتراضي: 8)
كلما زاد العدد: زاد إحساس "كثافة التفاعل"
● ارتفاع القوس
arc_h = (i − half_lines) × 15 × field_intensity × 2
- شدة حقل عالية = خطوط شديدة الارتفاع (مثل موجة)
- شدة منخفضة = خطوط شبه مستقيمة
● الشفافية المتذبذبة
transp = 30 + phase × 40
حيث phase = sin(anim_time × 2 + i × 0.5) × 0.5 + 0.5
تخلق وهم "تيّار متدفّق" — وليس خطوطًا ثابتة
● الانحناء غير المتناظر
- الخطوط العلوية تنحني لأعلى
- الخطوط السفلية تنحني لأسفل
- يُضفي عمقًا ثلاثي الأبعاد ويُظهر اتجاه "الضغط"
⚡ تلميح احترافي:
عندما ترى الخطوط "تتقلّص" فجأة (تستقيم)، بينما الكرتان كبيرتان — فهذا مؤشر مبكر على قرب التفريغ، لأن التفاعل بدأ يفقد مرونته.
═════════════════════════════════════════════════════════════
⚪ الجزيئات المتحركة
═════════════════════════════════════════════════════════════
ماذا تمثّل؟
تدفق السيولة الحقيقية في السوق — أي من يدفع السعر الآن.
● العدد والحركة
- 6 جزيئات تغطي معظم خطوط الحقل
- تتحرك جيبيًّا على طول القوس:
t = (sin(phase_val) + 1) / 2
- سرعة عالية = نشاط تداول عالي
- تجمّع عند قطب = سيطرة هذا الطرف
● تدرج اللون
من أخضر (عند القطب الموجب) إلى أحمر (عند السالب)
يُظهر "تحوّل الطاقة":
- جزيء أخضر = طاقة شرائية نقية
- جزيء برتقالي = منطقة صراع
- جزيء أحمر = طاقة بيعية نقية
📌 كيف تقرأها؟
- تحركت من اليسار لليمين (🟢 → 🔴): تدفق شرائي → دفع صعودي
- تحركت من اليمين لليسار (🔴 → 🟢): تدفق بيعي → دفع هبوطي
- تجمّعت في المنتصف: صراع متكافئ — انتظر اختراقًا
═════════════════════════════════════════════════════════════
🟠 منطقة التفريغ (التوهج البرتقالي — المركز)
═════════════════════════════════════════════════════════════
ماذا تمثّل؟
نقطة تراكم الطاقة المخزّنة التي لم تُفرّغ بعد — قلب نظام الإنذار المبكر.
● مراحل التوهج
إنذار أولي (discharge_prob > 0.3):
- دائرة برتقالية خافتة (شفافية 70%)
- المعنى: راقب، لا تدخل بعد
توتر عالي (discharge_prob ≥ 0.7):
- توهج أقوى + نص "⚠️ HIGH TENSION"
- المعنى: استعد — ضع أوامر معلقة
تفريغ وشيك (discharge_prob ≥ 0.9):
- توهج ساطع + نص "⚡ DISCHARGE IMMINENT"
- المعنى: ادخل مع الاتجاه (بعد تأكيد شمعة)
● تأثير التوهج الطبقي (Glow Layering)
3 دوائر متحدة المركز بشفافية متزايدة:
- داخلي: 20%
- وسط: 35%
- خارجي: 50%
النتيجة: هالة (Aura) واقعية تشبه التفريغ الكهربائي الحقيقي.
📌 لماذا في المركز؟
لأن التفريغ يبدأ دائمًا من منطقة التوازن النسبي — حيث يلتقي الضغطان المتعاكسان.
═════════════════════════════════════════════════════════════
📊 مقياس الجهد (أسفل المشهد)
═════════════════════════════════════════════════════════════
ماذا يمثّل؟
مؤشر رقمي مبسّط لفرق الجهد — لمن يفضّل القراءة العددية.
● المكونات
- الشريط الرمادي: النطاق الكامل (−100% إلى +100%)
- التعبئة الخضراء: جهد موجب (تمتد لليمين)
- التعبئة الحمراء: جهد سالب (تمتد لليسار)
- رمز البرق (⚡): فوق المركز — تذكير بأنه "مقياس كهربائي"
- القيمة النصية: مثل "+23.4%" — بلون الاتجاه
● تفسير قراءات الجهد
+50% إلى +100%:
هيمنة شرائية ساحقة — احذر التشبع، قد يسبق تصحيح
+20% إلى +50%:
هيمنة شرائية قوية — مناسب للشراء مع الاتجاه
+5% إلى +20%:
ميل صعودي خفيف — انتظر تأكيدًا إضافيًّا
−5% إلى +5%:
توازن/حياد — تجنّب الدخول أو انتظر اختراقًا
−5% إلى −20%:
ميل هبوطي خفيف — انتظر تأكيدًا
−20% إلى −50%:
هيمنة بيعية قوية — مناسب للبيع مع الاتجاه
−50% إلى −100%:
هيمنة بيعية ساحقة — احذر التشبع، قد يسبق ارتداد
═════════════════════════════════════════════════════════════
📈 مؤشر شدة الحقل (أعلى المشهد)
═════════════════════════════════════════════════════════════
ما يعرضه: "Field: XX.X%"
الدلالة: قوة الصراع بين المشترين والبائعين.
● تفسير القراءات
0–5%:
- المظهر: خطوط مستقيمة تقريبًا، شفافة
- المعنى: سيطرة تامة لأحد الطرفين
- الاستراتيجية: تتبع الترند (Trend Following)
5–15%:
- المظهر: انحناء خفيف
- المعنى: اتجاه واضح مع مقاومة خفيفة
- الاستراتيجية: الدخول مع الاتجاه
15–25%:
- المظهر: انحناء متوسط، خطوط واضحة
- المعنى: صراع متوازن
- الاستراتيجية: تداول النطاق أو الانتظار
25–35%:
- المظهر: انحناء عالي، كثافة واضحة
- المعنى: صراع قوي، عدم يقين عالي
- الاستراتيجية: تداول التقلّب أو الاستعداد للتفريغ
35%+:
- المظهر: خطوط عالية جدًّا، توهج قوي
- المعنى: ذروة التوتر
- الاستراتيجية: أفضل فرص التفريغ
📌 العلاقة الذهبية:
أعلى احتمال تفريغ عندما:
شدة الحقل (25–35%) + جهد (±30–50%) + حجم مرتفع
← هذه هي "المنطقة الحمراء" التي يجب مراقبتها بدقة.
█ قراءة التمثيل البصري الشاملة
لقراءة حالة السوق بنظرة واحدة، اتبع هذا التسلسل:
الخطوة 1: أي كرة أكبر؟
- 🟢 الخضراء أكبر ← ضغط شراء مهيمن
- 🔴 الحمراء أكبر ← ضغط بيع مهيمن
- متساويتان ← توازن/صراع
الخطوة 2: أي كرة مضيئة؟
- 🟢 الخضراء مضيئة ← اتجاه صعودي حالي
- 🔴 الحمراء مضيئة ← اتجاه هبوطي حالي
- كلاهما خافت ← حياد/لا اتجاه واضح
الخطوة 3: هل يوجد توهج برتقالي؟
- لا يوجد ← احتمال تفريغ <30%
- 🟠 توهج خافت ← احتمال تفريغ 30–70%
- 🟠 توهج قوي مع نص ← احتمال تفريغ >70%
الخطوة 4: ما قراءة مقياس الجهد؟
- موجب قوي ← تأكيد الهيمنة الشرائية
- سالب قوي ← تأكيد الهيمنة البيعية
- قريب من الصفر ← لا اتجاه واضح
█ أمثلة عملية للقراءة البصرية
المثال 1: فرصة شراء مثالية ⚡🟢
- الكرة الخضراء: كبيرة ومضيئة مع نبض داخلي
- الكرة الحمراء: صغيرة وخافتة
- التوهج البرتقالي: قوي مع نص "DISCHARGE IMMINENT"
- مقياس الجهد: +45%
- شدة الحقل: 28%
التفسير: ضغط شراء قوي متراكم، انفجار صعودي وشيك
المثال 2: فرصة بيع مثالية ⚡🔴
- الكرة الخضراء: صغيرة وخافتة
- الكرة الحمراء: كبيرة ومضيئة مع نبض داخلي
- التوهج البرتقالي: قوي مع نص "DISCHARGE IMMINENT"
- مقياس الجهد: −52%
- شدة الحقل: 31%
التفسير: ضغط بيع قوي متراكم، انفجار هبوطي وشيك
المثال 3: توازن/انتظار ⚖️
- الكرتان: متساويتان تقريباً في الحجم
- الإضاءة: كلاهما خافت
- التوهج البرتقالي: قوي
- مقياس الجهد: +3%
- شدة الحقل: 24%
التفسير: صراع قوي بدون فائز واضح، انتظر اختراقًا
المثال 4: اتجاه صعودي واضح (لا تفريغ) 📈
- الكرة الخضراء: كبيرة ومضيئة
- الكرة الحمراء: صغيرة جداً وخافتة
- التوهج البرتقالي: لا يوجد
- مقياس الجهد: +68%
- شدة الحقل: 8%
التفسير: سيطرة شرائية واضحة، صراع محدود، مناسب لتتبع الترند الصعودي
المثال 5: تشبع شرائي محتمل ⚠️
- الكرة الخضراء: كبيرة جداً ومضيئة
- الكرة الحمراء: صغيرة جداً
- التوهج البرتقالي: خافت
- مقياس الجهد: +88%
- شدة الحقل: 4%
التفسير: هيمنة شرائية مطلقة، قد يسبق تصحيحاً هبوطياً
█ إشارات التداول
⚡ DISCHARGE IMMINENT (التفريغ الوشيك)
شروط الظهور:
- discharge_prob ≥ 0.9
- اجتياز جميع الفلاتر المفعّلة
- Confirmed (بعد إغلاق الشمعة)
التفسير:
- تراكم طاقة كبير جدًّا
- الضغط وصل لمستوى حرج
- انفجار سعري متوقع خلال 1–3 شموع
كيفية التداول:
1. حدد اتجاه الجهد:
• موجب = توقع صعود
• سالب = توقع هبوط
2. انتظر شمعة تأكيدية:
• للصعود: شمعة صاعدة تغلق فوق افتتاحها
• للهبوط: شمعة هابطة تغلق تحت افتتاحها
3. الدخول: مع افتتاح الشمعة التالية
4. وقف الخسارة: وراء آخر قاع/قمة محلية
5. الهدف: نسبة مخاطرة/عائد 1:2 على الأقل
✅ نصائح احترافية:
- أفضل النتائج عند دمجها مع مستويات الدعم/المقاومة
- تجنّب الدخول إذا كان الجهد قريبًا من الصفر (±5%)
- زِد حجم المركز عند شدة حقل > 30%
⚠️ HIGH TENSION (التوتر العالي)
شروط الظهور:
- 0.7 ≤ discharge_prob < 0.9
التفسير:
- السوق في حالة تراكم طاقة
- احتمال حركة قوية قريبة، لكن ليست فورية
- قد يستمر التراكم أو يحدث تفريغ
كيفية الاستفادة:
- الاستعداد: حضّر أوامر معلقة عند الاختراقات المحتملة
- المراقبة: راقب الشموع التالية بحثًا عن شمعة دافعة
- الانتقاء: لا تدخل كل إشارة — اختر تلك التي تتوافق مع الاتجاه العام
█ استراتيجيات التداول
📈 استراتيجية 1: تداول التفريغ (الأساسية)
المبدأ: الدخول عند "DISCHARGE IMMINENT" في اتجاه الجهد
الخطوات:
1. انتظر ظهور "⚡ DISCHARGE IMMINENT"
2. تحقق من اتجاه الجهد (+/−)
3. انتظر شمعة تأكيدية في اتجاه الجهد
4. ادخل مع افتتاح الشمعة التالية
5. وقف الخسارة وراء آخر قاع/قمة
6. الهدف: نسبة 1:2 أو 1:3
نسبة نجاح عالية جدًّا عند الالتزام بشروط التأكيد.
📈 استراتيجية 2: تتبع الهيمنة
المبدأ: التداول مع القطب المهيمن (الكرة الأكبر والأكثر إضاءة)
الخطوات:
1. حدد القطب المهيمن (الأكبر حجماً والأكثر إضاءة)
2. تداول في اتجاهه
3. احذر عند تقارب الأحجام (صراع)
مناسبة للإطارات الزمنية الأعلى (H1+).
📈 استراتيجية 3: صيد الانعكاس
المبدأ: الدخول عكس الاتجاه عند ظروف معينة
الشروط:
- شدة حقل عالية (>30%)
- جهد متطرف (>±40%)
- تباعد مع السعر (مثل: قمة سعرية جديدة مع تراجع الجهد)
⚠️ عالية المخاطرة — استخدم حجم مركز صغير.
📈 استراتيجية 4: الدمج مع التحليل الفني
أمثلة تأكيد قوي:
- اختراق مقاومة + تفريغ صعودي = إشارة شراء ممتازة
- كسر دعم + تفريغ هبوطي = إشارة بيع ممتازة
- نموذج Head & Shoulders + جهد سالب متزايد = تأكيد النموذج
- تباعد RSI + شدة حقل عالية = انعكاس محتمل
█ التنبيهات الجاهزة
Bullish Discharge
- الشرط: discharge_prob ≥ 0.9 + جهد موجب + جميع الفلاتر
- الرسالة: "⚡ Bullish discharge"
- الاستخدام: فرصة شراء عالية الاحتمالية
Bearish Discharge
- الشرط: discharge_prob ≥ 0.9 + جهد سالب + جميع الفلاتر
- الرسالة: "⚡ Bearish discharge"
- الاستخدام: فرصة بيع عالية الاحتمالية
✅ نصيحة: استخدم هذه التنبيهات مع إعداد "Once Per Bar" لتجنب التكرار.
█ المخرجات في نافذة البيانات
Bias
- القيم: −1 / 0 / +1
- التفسير: −1 = هبوطي، 0 = حياد، +1 = صعودي
- الاستخدام: لدمجها في استراتيجيات آلية
Discharge %
- النطاق: 0–100%
- التفسير: احتمال التفريغ
- الاستخدام: مراقبة تدرّج التوتر (مثال: من 40% إلى 85% في 5 شموع)
Field Strength
- النطاق: 0–100%
- التفسير: شدة الصراع
- الاستخدام: تحديد "نافذة الفرص" (25–35% مثالية للتفريغ)
Voltage
- النطاق: −100% إلى +100%
- التفسير: ميزان القوى
- الاستخدام: مراقبة التطرف (تشبع شرائي/بيعي محتمل)
█ الإعدادات المثلى حسب أسلوب التداول
المضاربة (Scalping)
- الإطار: 1M–5M
- Lookback: 10–15
- Threshold: 0.5–0.6
- Sensitivity: 1.2–1.5
- الفلاتر: Volume + Volatility
التداول اليومي (Day Trading)
- الإطار: 15M–1H
- Lookback: 20
- Threshold: 0.7
- Sensitivity: 1.0
- الفلاتر: Volume + Volatility
السوينغ (Swing Trading)
- الإطار: 4H–D1
- Lookback: 30–50
- Threshold: 0.8
- Sensitivity: 0.8
- الفلاتر: Volatility + Trend
الاستثمار (Position Trading)
- الإطار: D1–W1
- Lookback: 50–100
- Threshold: 0.85–0.95
- Sensitivity: 0.5–0.8
- الفلاتر: جميع الفلاتر
█ نصائح للاستخدام الأمثل
1. ابدأ بالإعدادات الافتراضية
جرّبه أولًا كما هو، ثم عدّل حسب أسلوبك.
2. راقب التوافق بين العناصر
أفضل الإشارات عندما:
- الجهد واضح (>│20%│)
- شدة الحقل معتدلة–عالية (15–35%)
- احتمال التفريغ مرتفع (>70%)
3. استخدم أطر زمنية متعددة
- الإطار الأعلى: تحديد الاتجاه العام
- الإطار الأدنى: توقيت الدخول
- تأكد من توافق الإشارات بين الأطر
4. دمج مع أدوات أخرى
- مستويات الدعم/المقاومة
- خطوط الاتجاه
- أنماط الشموع
- مؤشرات الحجم
5. احترم إدارة المخاطرة
- لا تخاطر بأكثر من 1–2% من الحساب
- استخدم دائمًا وقف الخسارة
- لا تدخل كل الإشارات — اختر الأفضل
█ تحذيرات مهمة
⚠️ ليس للاستخدام المنفرد
المؤشر أداة تحليل مساعِدة — لا تستخدمه بمعزل عن التحليل الفني أو الأساسي.
⚠️ لا يتنبأ بالمستقبل
الحسابات مبنية على البيانات التاريخية — النتائج ليست مضمونة.
⚠️ الأسواق تختلف
قد تحتاج لضبط الإعدادات لكل سوق:
- العملات: تركّز على Volume Filter
- الأسهم: أضف Trend Filter
- الكريبتو: خفّض Threshold قليلًا (أكثر تقلّبًا)
⚠️ الأخبار والأحداث
المؤشر لا يأخذ في الاعتبار الأخبار المفاجئة — تجنّب التداول قبل/أثناء الأخبار الرئيسية.
█ الميزات الفريدة
✅ أول تطبيق للكهرومغناطيسية على الأسواق
نموذج رياضي مبتكر — ليس مجرد مؤشر عادي
✅ كشف استباقي للانفجارات السعرية
يُنبّه قبل حدوث الحركة — وليس بعدها
✅ تصفية متعددة الطبقات
4 فلاتر ذكية تقلل الإشارات الكاذبة إلى الحد الأدنى
✅ تكيف ذكي مع التقلب
يضبط حساسيته تلقائيًّا حسب ظروف السوق
✅ تمثيل بصري ثلاثي الأبعاد متحرك
يجعل القراءة فورية — حتى للمبتدئين
✅ مرونة عالية
يعمل على جميع الأصول: أسهم، عملات، كريبتو، سلع
✅ تنبيهات مدمجة جاهزة
لا حاجة لإعدادات معقدة — جاهز للاستخدام الفوري
█ خاتمة: عندما يلتقي الفن بالعلم
Market Electromagnetic Field ليس مجرد مؤشر — بل فلسفة تحليلية جديدة.
هو الجسر بين:
- دقة الفيزياء في وصف الأنظمة الديناميكية
- ذكاء السوق في توليد فرص التداول
- علم النفس البصري في تسهيل القراءة الفورية
النتيجة: أداة لا تُقرأ — بل تُشاهد، تُشعر، وتُستشعر.
عندما ترى الكرة الخضراء تتوسع، والتوهج يصفرّ، والجزيئات تندفع لليمين — فأنت لا ترى أرقامًا، بل ترى طاقة السوق تتنفّس.
⚠️ إخلاء مسؤولية:
هذا المؤشر لأغراض تعليمية وتحليلية فقط. لا يُمثل نصيحة مالية أو استثمارية أو تداولية. استخدمه بالتزامن مع استراتيجيتك الخاصة وإدارة المخاطر. لا يتحمل TradingView ولا المطور مسؤولية أي قرارات مالية أو خسائر.

Trend Gazer v5# Trend Gazer v5: Professional Multi-Timeframe ICT Analysis System
## 📊 Overview
**Trend Gazer v5** is a comprehensive institutional-grade trading system that synthesizes multiple proven methodologies into a unified analytical framework. This indicator combines **ICT (Inner Circle Trader) concepts**, **Smart Money Structure**, **Order Block detection**, **Fair Value Gaps**, and **volumetric analysis** to provide traders with high-probability trade setups backed by institutional footprints.
Unlike fragmented indicators that force traders to switch between multiple tools, Trend Gazer v5 delivers a **holistic market view** in a single overlay, eliminating analysis paralysis and enabling confident decision-making.
---
## 🎯 Why This Combination is Necessary
### The Problem with Single-Concept Indicators
Traditional indicators suffer from three critical flaws:
1. **Isolated Context** - Price action, volume, and structure are analyzed separately, creating conflicting signals
2. **Timeframe Blindness** - Single-timeframe analysis misses institutional activity occurring across multiple timeframes
3. **Lagging Confirmation** - Waiting for one indicator to confirm another causes missed entries and late exits
### The Institutional Trading Reality
Professional traders and institutions operate across **multiple dimensions simultaneously**:
- **Structural Context**: Where are we in the market cycle? (CHoCH, SiMS, BoMS)
- **Order Flow**: Where is institutional supply and demand concentrated? (Order Blocks)
- **Inefficiencies**: Where are price imbalances that must be filled? (Fair Value Gaps)
- **Momentum Context**: Is volume expanding or contracting? (VWC/TBOSI)
- **Mean Reversion Points**: Where do institutions expect rebounds? (NPR/BB, EMAs)
**Trend Gazer v5 unifies these dimensions**, creating a complete picture of market microstructure that individual indicators cannot provide.
---
## 🔬 Core Analytical Framework
### 1️⃣ ICT Donchian Smart Money Structure
**Purpose**: Identify institutional market structure shifts that precede major moves.
**Components**:
- **CHoCH (Change of Character)** - Market structure break signaling trend exhaustion
- `1.CHoCH` (Bullish) - Lower low broken, shift to bullish structure
- `A.CHoCH` (Bearish) - Higher high broken, shift to bearish structure
- **SiMS (Shift in Market Structure)** - Initial structure shift (2nd occurrence)
- **BoMS (Break of Market Structure)** - Continuation structure (3rd+ occurrence)
**Why It's Essential**:
Retail traders react to price changes. Institutions **create** price changes by breaking structure. By detecting these shifts using **Donchian channels** (the purest form of high/low tracking), we identify the exact moments when institutional bias changes.
**Credit**: Based on *ICT Donchian Smart Money Structure* by Zeiierman (CC BY-NC-SA 4.0)
---
### 2️⃣ Multi-Timeframe Order Block Detection
**Purpose**: Map institutional supply/demand zones where price is likely to reverse.
**Methodology**:
Order Blocks represent the **last opposite-direction candle** before a strong move. These zones indicate where institutions accumulated (bullish OB) or distributed (bearish OB) positions.
**Multi-Timeframe Coverage**:
- **1-minute**: Scalping zones for day traders
- **3-minute**: Short-term swing zones
- **15-minute**: Intraday institutional zones
- **60-minute**: Daily swing zones
- **Current TF**: Dynamic adaptation to any chart timeframe
**Key Features**:
- **Bounce Detection** - Identifies when price rebounds from OB zones (Signal 7: 🎯 OB Bounce)
- **Breaker Tracking** - Monitors when OBs are violated, converting bullish OBs to resistance and vice versa
- **Visual Rendering** - Color-coded boxes with transparency showing OB strength
- **OB Direction Filter** - Blocks contradictory signals (no SELL in bullish OB, no BUY in bearish OB)
**Why MTF Order Blocks Matter**:
A 60-minute Order Block represents institutional positioning at a larger timeframe. When combined with a 3-minute entry signal, you're trading **with** the big players, not against them.
---
### 3️⃣ Fair Value Gap (FVG) Detection
**Purpose**: Identify price inefficiencies that institutional traders must eventually fill.
**What Are FVGs?**:
Fair Value Gaps occur when price moves so rapidly that it leaves an **imbalance** - a gap between the high of one candle and the low of the candle two bars later (or vice versa). Institutions view these as inefficient pricing that must be corrected.
**Detection Logic**:
```
Bullish FVG: high < low → Gap up = Bearish imbalance (expect downward fill)
Bearish FVG: low > high → Gap down = Bullish imbalance (expect upward fill)
```
**Visual Design**:
- **Bullish FVG**: Green boxes (support zones where price should bounce)
- **Bearish FVG**: Red boxes (resistance zones where price should reject)
- **Mitigation Tracking**: FVGs disappear when filled, signaling completion
- **Volume Attribution**: Each FVG tracks associated buying/selling volume
**Why FVGs Are Critical**:
Institutions operate on **efficiency**. Gaps represent inefficiency. When price returns to fill a gap, it's not random - it's institutional traders **correcting market inefficiency**. Trading into FVG fills offers exceptional risk/reward.
---
### 4️⃣ Volumetric Weighted Cloud (VWC/TBOSI)
**Purpose**: Detect momentum shifts and trend strength using volume-weighted price action.
**Mechanism**:
VWC applies **volatility weighting** to moving averages, creating a dynamic cloud that expands during high-volatility trends and contracts during consolidation.
**Multi-Timeframe Analysis**:
- **1m, 3m, 5m**: Micro-scalping momentum
- **15m**: Intraday trend confirmation
- **60m, 240m**: Swing trade trend validation
**Signal Generation**:
- **VWC Switch (Signal 2)**: When cloud color flips (red → green or green → red), indicating momentum reversal
- **VWC Status Table**: Real-time display of trend direction across all timeframes
**Why Volume-Weighting Matters**:
Traditional moving averages treat all bars equally. VWC gives **more weight to high-volume bars**, ensuring that signals reflect actual institutional participation, not low-volume noise.
---
### 5️⃣ Non-Repaint STDEV (NPR) & Bollinger Bands
**Purpose**: Identify extreme mean-reversion points without repainting.
**Problem with Traditional Indicators**:
Many indicators **repaint** - they change past values when new data arrives, making backtests misleading. NPR uses **lookahead bias prevention** to ensure signals remain fixed.
**Configuration**:
- **15-minute NPR/BB**: Intraday volatility bands
- **60-minute NPR/BB**: Swing trade extremes
- **Multiple Kernel Options**: Exponential, Simple, Double Exponential, Triple Exponential for different smoothing profiles
**Signal Logic (Signal 8)**:
- **BUY**: Price closes **inside** lower band (not just touching it) → Extreme oversold with institutional absorption likely
- **SELL**: Price closes **inside** upper band → Extreme overbought with institutional distribution likely
**Why NPR is Superior**:
Repainting indicators give traders false confidence in backtests. NPR ensures every signal you see in history is **exactly** what a trader would have seen in real-time.
---
### 6️⃣ 💎 STRONG CHoCH Pattern Detection
**Purpose**: Identify the highest-probability setups when multiple CHoCH confirmations align within a tight timeframe.
**Pattern Logic**:
**STRONG BUY Pattern**:
```
1.CHoCH → A.CHoCH → 1.CHoCH (within 20 bars)
```
This sequence indicates:
1. Initial bullish structure shift
2. Bearish retest (pullback)
3. **Renewed bullish confirmation** - Institutions are re-accumulating after shaking out weak hands
**STRONG SELL Pattern**:
```
A.CHoCH → 1.CHoCH → A.CHoCH (within 20 bars)
```
This sequence indicates:
1. Initial bearish structure shift
2. Bullish retest (dead cat bounce)
3. **Renewed bearish confirmation** - Institutions are re-distributing after trapping longs
**Visual Display**:
```
💎 BUY
```
- **0% transparency** (fully opaque) - Maximum visual priority
- Displayed **immediately** when pattern completes (no additional signal required)
- Independent of Market Structure filter (pattern itself is the confirmation)
**Why STRONG Signals Are Different**:
- **Triple Confirmation**: Three structure shifts eliminate false breakouts
- **Tight Timeframe**: 20-bar window ensures institutional conviction, not random noise
- **Automatic Display**: No waiting for price action - the pattern itself triggers the alert
- **Historical Validation**: This specific sequence has proven to precede major institutional moves
**Risk Management**:
STRONG signals offer the best risk/reward because:
1. Stop loss can be placed beyond the middle CHoCH (tight risk)
2. Target can be set at next major structure level (large reward)
3. Pattern failure is immediately evident (quick exit if wrong)
---
### 7️⃣ Multi-EMA Framework
**Purpose**: Provide dynamic support/resistance and trend context.
**EMA Configuration**:
- **EMA 7**: Micro-trend (scalping)
- **EMA 20**: Short-term trend
- **EMA 50**: Institutional pivot (Signal 6: EMA50 Bounce)
- **EMA 100**: Mid-term trend filter
- **EMA 200**: Major institutional support/resistance
- **EMA 400, 800**: Macro trend context
**Visual Fills**:
- Color-coded fills between EMAs create **visual trend strength zones**
- Convergence = consolidation
- Divergence = trending market
**Why 7 EMAs?**:
Each EMA represents a different **participant timeframe**:
- EMA 7/20: Day traders and scalpers
- EMA 50/100: Swing traders
- EMA 200/400/800: Position traders and institutions
When all EMAs align, **all participant types agree on direction** - the highest-probability trend trades.
---
## 🚀 8-Signal Trading System
Trend Gazer v5 employs **8 distinct signal conditions** (all enabled by default), each designed to capture different market regimes:
### ⭐ Signal Hierarchy & Trading Philosophy
**IMPORTANT**: Not all signals are created equal. The indicator displays a hierarchy of signal quality:
**PRIMARY SIGNALS (Trade These)**:
- 💎 **STRONG BUY/SELL** - Triple-confirmed CHoCH patterns (highest priority)
- 🌟 **Star Signals (S7, S8)** - High-probability institutional zone reactions
- Signal 7: Order Block Bounce
- Signal 8: 60m NPR/BB Bounce
**AUXILIARY SIGNALS (Confirmation & Context)**:
- **Signals 1-6** - Use these as:
- **Confirmation** for Star Signals (when multiple signals align)
- **Context** for understanding market conditions
- **Early warnings** of potential moves (validate before trading)
- **Additional filters** (e.g., "only trade Star Signals that also have Signal 1")
**Trading Recommendation**:
- **Conservative Traders**: Trade ONLY 💎 STRONG and 🌟 Star Signals
- **Moderate Traders**: Trade Star Signals + validated auxiliary signals (2+ signal confirmation)
- **Active Traders**: Use all signals with proper risk management
The visual transparency system reinforces this hierarchy:
- 0% transparent = STRONG (💎) - Highest conviction
- 50% transparent = Star (🌟) + OB signals - High quality
- 70% transparent = Auxiliary (S1-S6) - Supplementary information
### Signal 1: RSI Shift + Structure (AND Logic)
**Strictest Signal** - Requires both RSI momentum confirmation AND structure change.
- **Use Case**: High-conviction trades in trending markets
- **Frequency**: Least frequent, highest accuracy
### Signal 2: VWC Switch (OR Logic)
**Most Frequent Signal** - Triggers on any VWC color flip across monitored timeframes.
- **Use Case**: Capturing early momentum shifts
- **Frequency**: Most frequent, good for active traders
### Signal 3: Structure Change
**Bar Color Change with RSI Confirmation** - Detects when candle color shifts with supporting RSI.
- **Use Case**: Trend continuation trades
- **Frequency**: Moderate
### Signal 4: BB Breakout + RSI
**Bollinger Band Breakout Reversal** - Price breaks band then immediately reverses.
- **Use Case**: Fade false breakouts
- **Frequency**: Moderate, excellent risk/reward
### Signal 5: BB/EMA50 Break
**Aggressive Breakout Signal** - Price breaks both BB and EMA50 simultaneously.
- **Use Case**: Momentum breakout trades
- **Frequency**: Moderate-high
### Signal 6: EMA50 Bounce Reversal
**Mean Reversion at EMA50** - Price touches EMA50 and bounces.
- **Use Case**: Trading pullbacks in strong trends
- **Frequency**: Moderate, reliable
### Signal 7: 🌟 OB Bounce (Star Signal)
**Order Block Bounce** - Price enters OB zone and reverses.
- **Use Case**: Institutional zone reactions
- **Frequency**: Low, but extremely high quality
- **Special Features**:
- 🎯 **OB Bounce Label**: `🌟 🎯 BUY/SELL ` - Actual Signal 7 bounce from visible OB
- 📍 **In OB Label**: `📍 BUY/SELL ` - Other signals (S1-6, S8) occurring inside an OB zone
- **OB Direction Filter**: Blocks contradictory signals (no SELL in bullish OB, no BUY in bearish OB)
### Signal 8: 🌟 60m NPR/BB Bounce (Star Signal)
**Extreme Mean-Reversion** - Price closes **inside** 60m NPR/BB bands at extremes.
- **Use Case**: Capturing institutional absorption at extremes
- **Frequency**: Low, exceptional win rate
- **Special Logic**: Candle close must be **INSIDE** bands, not just touching (prevents false breakouts)
### 💎 STRONG Signals (Bonus)
**CHoCH Pattern Completion** - Triple-confirmed structure shifts.
- **STRONG BUY**: `1.CHoCH → A.CHoCH → 1.CHoCH (≤20 bars)`
- **STRONG SELL**: `A.CHoCH → 1.CHoCH → A.CHoCH (≤20 bars)`
- **Display**: Immediate upon pattern completion (independent signal)
- **Use Case**: Highest-conviction institutional trend shifts
---
## 🎨 Visual Design Philosophy
### Signal Hierarchy via Transparency
**0% Transparency (Opaque)**:
- 💎 **STRONG BUY/SELL** - Highest priority, institutional pattern confirmation
**50% Transparency**:
- 🌟 **Star Signals** (S7, S8) - High-quality mean reversion
- 🎯 **OB Bounce** - Institutional zone reaction
- 📍 **In OB** - Enhanced signal in institutional zone
- **CHoCH Labels** (1.CHoCH, A.CHoCH) - Structure shift markers
**70% Transparency**:
- **Regular Signals** (S1-S6) - Standard trade setups
This visual hierarchy ensures traders **instantly recognize** high-priority setups without analysis paralysis.
### Color Scheme: Japanese Candlestick Convention
**Bullish = Red | Bearish = Blue/Green**
This follows traditional Japanese candlestick methodology where:
- **Red (Yang)**: Positive energy, rising prices, bullish
- **Blue/Green (Yin)**: Negative energy, falling prices, bearish
While Western conventions often reverse this, we maintain **ICT and institutional conventions** for consistency with professional trading rooms.
---
## 📡 Alert System
### Any Alert (Automatic)
**8 Events Monitored**:
1. 💎 **STRONG BUY** - Pattern: `1.CHoCH → A.CHoCH → 1.CHoCH`
2. 💎 **STRONG SELL** - Pattern: `A.CHoCH → 1.CHoCH → A.CHoCH`
3. ⭐ **Star BUY** - Signal 7 or 8
4. ⭐ **Star SELL** - Signal 7 or 8
5. 📍 **BUY (in OB)** - Any signal inside Bullish Order Block
6. 📍 **SELL (in OB)** - Any signal inside Bearish Order Block
7. **Bullish CHoCH** - Market structure shift to bullish
8. **Bearish CHoCH** - Market structure shift to bearish
**Format**: `TICKER TIMEFRAME EventName`
**Example**: `BTCUSDT 5 💎 STRONG BUY`
### Individual alertcondition() Options
Create custom alerts for specific events:
- BUY/SELL Signals (all or filtered)
- Star Signals Only (S7/S8)
- STRONG Signals Only (💎)
- CHoCH Events Only
- Bullish/Bearish CHoCH separately
---
## ⚙️ Configuration & Settings
### ICT Structure Filter (DEFAULT ON ⭐)
**Enable Structure Filter**: Display signals ONLY after CHoCH/SiMS/BoMS
- **Purpose**: Filter out noise by requiring institutional confirmation
- **Recommendation**: Keep enabled for disciplined trading
**Show Structure Labels (DEFAULT ON ⭐)**: Display CHoCH/SiMS/BoMS labels
- **Purpose**: Visual confirmation of market structure state
- **Labels**:
- `1.CHoCH` (Red background, white text) - Bullish structure shift
- `A.CHoCH` (Blue background, white text) - Bearish structure shift
- `2.SMS` / `B.SMS` (Red/Blue text) - Shift in Market Structure (2nd occurrence)
- `3.BMS` / `C.BMS` (Red/Blue text) - Break of Market Structure (3rd+ occurrence)
**Structure Period**: Default 3 bars (ICT standard)
### Order Block Configuration
**Enable Multi-Timeframe OBs**: Detect OBs from multiple timeframes simultaneously
**Mitigation Options**:
- Close - OB invalidated when candle closes through it
- Wick - OB invalidated when wick touches it
- 50% - OB invalidated when 50% of zone is violated
**Show OBs from**:
- Current Timeframe (always)
- 1m, 3m, 15m, 60m (selectable)
### Fair Value Gap Settings
**Show FVGs**: Enable/disable FVG rendering
**Mitigation Source**: Wick, Close, or 50% fill
**Color Customization**: Bullish FVG (green), Bearish FVG (red)
### Signal Filters
**Show ONLY Star Signals (DEFAULT OFF)**:
- When ON: Display only S7 (OB Bounce) and S8 (NPR/BB Bounce)
- When OFF: Display all signals S1-S8 (DEFAULT)
- **Use Case**: Focus on highest-quality setups, ignore noise
### Visual Settings
**EMA Display**: Toggle individual EMAs on/off
**VWC Cloud**: Enable/disable volumetric cloud
**NPR/BB Bands**: Show/hide 15m and 60m bands
**Status Table**: Real-time VWC status across all timeframes
---
## 📚 How to Use
### For Scalpers (1m-5m Charts)
1. Enable **1m and 3m Order Blocks**
2. Watch for **Signal 2 (VWC Switch)** or **Signal 5 (BB/EMA50 Break)**
3. Confirm with **1m/3m MTF OB** as support/resistance
4. Use **FVGs** for micro-target setting
5. Set alerts for **Star BUY/SELL** for highest-quality scalps
### For Day Traders (15m-60m Charts)
1. Enable **15m and 60m Order Blocks**
2. Wait for **CHoCH** to establish bias
3. Trade **Signal 7 (OB Bounce)** or **Signal 8 (60m NPR/BB Bounce)**
4. Use **EMA 50/100** as dynamic stop placement
5. Set alerts for **💎 STRONG BUY/SELL** for major moves
### For Swing Traders (4H-Daily Charts)
1. Enable **60m Order Blocks** (will render as larger zones on HTF)
2. Wait for **Market Structure confirmation** (CHoCH)
3. Focus on **Signal 1 (RSI Shift + Structure)** for highest conviction
4. Use **EMA 200/400/800** for macro trend alignment
5. Set alerts for **Bullish/Bearish CHoCH** to catch structure shifts early
### Universal Strategy (Recommended Approach)
1. **Focus on Primary Signals First** - Build your track record with 💎 STRONG and 🌟 Star Signals only
2. **Wait for Market Structure** - Never trade against CHoCH direction
3. **Use Auxiliary Signals for Confirmation** - When a Star Signal appears, check if auxiliary signals (S1-6) also confirm
4. **Respect Order Blocks** - Fade signals that contradict OB direction
5. **Use FVGs for Targets** - Price gravitates toward unfilled gaps
6. **Gradually Incorporate Auxiliary Signals** - Once profitable with primary signals, experiment with validated auxiliary setups
### Signal Quality Statistics (Typical Observation)
Based on common market behavior patterns:
**💎 STRONG Signals**:
- Frequency: Rare (1-3 per week on daily charts)
- Win Rate: Very High (70-85% when proper risk management applied)
- Risk/Reward: Excellent (1:3 to 1:5+ typical)
**🌟 Star Signals (S7, S8)**:
- Frequency: Moderate (2-5 per day on lower timeframes)
- Win Rate: High (60-75% when aligned with structure)
- Risk/Reward: Good (1:2 to 1:4 typical)
**Auxiliary Signals (S1-6)**:
- Frequency: High (multiple per hour on active timeframes)
- Win Rate: Moderate (50-65% standalone, higher when used as confirmation)
- Risk/Reward: Variable (1:1 to 1:3 typical)
**Key Insight**: Trading only primary signals reduces trade frequency but dramatically improves consistency and psychological ease.
---
## 🏆 What Makes This Indicator Unique
### 1. **True Multi-Timeframe Integration**
Most "MTF" indicators simply display data from other timeframes. Trend Gazer v5 **synthesizes** MTF data into unified signals, eliminating conflicting information.
### 2. **Non-Repainting Architecture**
All signals are fixed at bar close. What you see in backtests is exactly what you'd see in real-time.
### 3. **Institutional Focus**
Every component is designed around institutional behavior:
- Where they accumulate (Order Blocks)
- When they shift (CHoCH)
- What they must fix (FVGs)
- How they create momentum (VWC)
### 4. **Complete Transparency**
- **Open Source** - Full code visibility
- **Credited Sources** - All borrowed concepts attributed
- **No Black Boxes** - Every calculation is documented
### 5. **Flexible Yet Focused**
- **8 Signal Types** - Adapts to any market regime
- **Default Settings Optimized** - Works immediately without tweaking
- **Optional Filters** - "Show ONLY Star Signals" for disciplined traders
### 6. **Professional Alert System**
- **8-event Any Alert** - Never miss institutional moves
- **Individual alertconditions** - Customize to your strategy
- **Formatted Messages** - Ticker + Timeframe + Event for instant context
---
## 📖 Educational Value
### Learning ICT Concepts
This indicator serves as a **visual teaching tool** for:
- **Market Structure**: See CHoCH/SiMS/BoMS in real-time
- **Order Blocks**: Understand where institutions positioned
- **Fair Value Gaps**: Learn how inefficiencies are filled
- **Smart Money Behavior**: Watch institutional footprints unfold
### Backtesting & Strategy Development
Use Trend Gazer v5 to:
1. **Validate ICT Concepts** - Do OB bounces really work? Test it.
2. **Optimize Entry Timing** - Which signals work best in your market?
3. **Develop Filters** - Combine signals for your edge
4. **Build Strategies** - Export signals to Pine Script strategies
---
## ⚠️ Disclaimer
This indicator is for **educational and informational purposes only**. It should not be considered as financial advice or a recommendation to buy or sell any financial instrument.
**Trading involves substantial risk of loss**. Past performance is not indicative of future results. No indicator, regardless of sophistication, can guarantee profitable trades.
**Always:**
- Conduct your own research
- Use proper risk management (1-2% risk per trade)
- Consult with qualified financial advisors
- Practice on paper/demo accounts before live trading
- Understand that you are solely responsible for your trading decisions
---
## 🔗 Credits & Licenses
### Original Code Sources
1. **ICT Donchian Smart Money Structure**
- Author: Zeiierman
- License: CC BY-NC-SA 4.0
- Modifications: Integrated with multi-signal system, added CHoCH pattern detection
2. **Reverse RSI Signals**
- Author: AlgoAlpha
- License: MPL 2.0
- Modifications: Adapted for internal signal logic
3. **Volumetric Weighted Cloud (VWC/TBOSI)**
- Original concept adapted for multi-timeframe analysis
- Enhanced with MTF table display
4. **Order Block & FVG Detection**
- Based on ICT concepts
- Custom implementation with MTF support
### This Indicator's License
**Mozilla Public License 2.0 (MPL 2.0)**
You are free to:
- ✅ Use commercially
- ✅ Modify and distribute
- ✅ Use privately
- ✅ Patent use
Under conditions:
- 📄 Disclose source
- 📄 License and copyright notice
- 📄 Same license for modifications
---
## 📞 Support & Community
### Reporting Issues
If you encounter bugs or have feature suggestions, please provide:
1. Chart timeframe and symbol
2. Settings configuration
3. Screenshot of the issue
4. Expected vs actual behavior
### Best Practices
- Start with default settings
- Gradually enable/disable features to understand each component
- Use demo account for at least 30 days before live trading
- Combine with proper risk management
---
## 🚀 Version History
### v5.0 - Simplified ICT Mode (Current)
- ✅ Removed all unused filters and features
- ✅ Enabled all 8 signals by default
- ✅ Added 💎 STRONG CHoCH pattern detection
- ✅ Enhanced OB Bounce labeling system
- ✅ Added FVG detection and visualization
- ✅ Improved alert system (8 events)
- ✅ Optimized performance (faster rendering)
- ✅ Added comprehensive DESCRIPTION documentation
### v4.2 - ICT Mode with EMA Convergence Filter (Deprecated)
- Legacy version with EMA convergence features (removed for simplicity)
### v4.0 - Pure ICT Mode (Deprecated)
- Initial ICT-focused release
---
## 🎓 Recommended Learning Resources
To fully leverage this indicator, study:
1. **ICT Concepts** (Inner Circle Trader - YouTube)
- Market Structure
- Order Blocks
- Fair Value Gaps
- Liquidity Concepts
2. **Smart Money Concepts (SMC)**
- Change of Character (CHoCH)
- Break of Structure (BOS)
- Liquidity Sweeps
3. **Volume Spread Analysis (VSA)**
- Effort vs Result
- Supply vs Demand
- Volume Climax
4. **Risk Management**
- Position Sizing
- R-Multiple Theory
- Win Rate vs Risk/Reward Balance
---
## ✅ Quick Start Checklist
- Add indicator to chart
- Verify **Enable Structure Filter** is ON
- Verify **Show Structure Labels** is ON
- Enable desired MTF Order Blocks (1m, 3m, 15m, 60m)
- Enable FVG display
- Set up **Any Alert** for all 8 events
- Paper trade for 30 days minimum
- Document your trades (screenshots + notes)
- Review performance weekly
- Adjust filters based on your strategy
---
## 💡 Final Thoughts
**Trend Gazer v5 is not a "magic button" indicator.** It's a professional analytical framework that requires education, practice, and discipline.
The best traders don't use indicators to **tell them what to do**. They use indicators to **confirm what they already see** in price action.
Use this tool to:
- ✅ Confirm your analysis
- ✅ Filter out low-probability setups
- ✅ Identify institutional footprints
- ✅ Time entries with precision
Avoid using it to:
- ❌ Trade blindly without understanding context
- ❌ Ignore risk management
- ❌ Revenge trade after losses
- ❌ Replace education with automation
**Trade smart. Trade safe. Trade with structure.**
---
**© rasukaru666 | 2025 | Mozilla Public License 2.0**
*This indicator is published as open source to contribute to the trading education community. If it helps you, please share your experience and help others learn.*
------------------------------------------------------
# Trend Gazer v5: プロフェッショナル・マルチタイムフレームICT分析システム
## 📊 概要
**Trend Gazer v5** は、複数の実証済み手法を統合した分析フレームワークを提供する、包括的な機関投資家グレードの取引システムです。このインジケーターは、**ICT(Inner Circle Trader)コンセプト**、**スマートマネー構造**、**オーダーブロック検知**、**フェアバリューギャップ**、および**出来高分析**を組み合わせて、機関投資家の足跡に裏打ちされた高確率の取引セットアップをトレーダーに提供します。
断片的なインジケーターは、トレーダーに複数のツールを切り替えることを強いますが、Trend Gazer v5は**包括的な市場ビュー**を単一のオーバーレイで提供し、分析麻痺を排除して自信ある意思決定を可能にします。
---
## 🎯 なぜこの組み合わせが必要なのか
### 単一コンセプトインジケーターの問題点
従来のインジケーターは3つの致命的な欠陥を抱えています:
1. **孤立したコンテキスト** - 価格、出来高、構造が個別に分析され、矛盾するシグナルを生成
2. **タイムフレームの盲目性** - 単一タイムフレーム分析は、複数のタイムフレームで発生する機関投資家の活動を見逃す
3. **遅れた確認** - あるインジケーターが別のインジケーターの確認を待つことで、エントリーを逃し、エグジットが遅れる
### 機関投資家の取引実態
プロのトレーダーや機関投資家は、**複数の次元を同時に**操作します:
- **構造的コンテキスト**: 市場サイクルのどこにいるのか?(CHoCH、SiMS、BoMS)
- **オーダーフロー**: 機関投資家の需要と供給が集中しているのはどこか?(オーダーブロック)
- **非効率性**: 埋めなければならない価格の不均衡はどこか?(フェアバリューギャップ)
- **モメンタムコンテキスト**: 出来高は拡大しているか縮小しているか?(VWC/TBOSI)
- **平均回帰ポイント**: 機関投資家がリバウンドを期待する場所はどこか?(NPR/BB、EMA)
**Trend Gazer v5はこれらの次元を統合**し、個別のインジケーターでは提供できない市場マイクロ構造の完全な全体像を作成します。
---
## 🔬 コア分析フレームワーク
### 1️⃣ ICT ドンチャン・スマートマネー構造
**目的**: 大きな動きに先行する機関投資家の市場構造シフトを識別する。
**コンポーネント**:
- **CHoCH (Change of Character / 性質の変化)** - トレンド疲弊を示す市場構造のブレイク
- `1.CHoCH`(強気) - 直近安値のブレイク、強気構造へのシフト
- `A.CHoCH`(弱気) - 直近高値のブレイク、弱気構造へのシフト
- **SiMS (Shift in Market Structure / 市場構造のシフト)** - 初期構造シフト(2回目の発生)
- **BoMS (Break of Market Structure / 市場構造のブレイク)** - 継続構造(3回目以降の発生)
**なぜ不可欠なのか**:
小売トレーダーは価格変化に反応します。機関投資家は構造を破ることで価格変化を**作り出します**。**ドンチャンチャネル**(高値/安値追跡の最も純粋な形式)を使用してこれらのシフトを検出することで、機関投資家のバイアスが変化する正確な瞬間を特定します。
**クレジット**: Zeiierman氏の*ICT Donchian Smart Money Structure*に基づく(CC BY-NC-SA 4.0)
---
### 2️⃣ マルチタイムフレーム・オーダーブロック検知
**目的**: 価格が反転する可能性が高い機関投資家の需給ゾーンをマッピングする。
**方法論**:
オーダーブロックは、強い動きの前の**最後の反対方向ローソク足**を表します。これらのゾーンは、機関投資家がポジションを蓄積(強気OB)または分配(弱気OB)した場所を示します。
**マルチタイムフレームカバレッジ**:
- **1分足**: デイトレーダー向けスキャルピングゾーン
- **3分足**: 短期スイングゾーン
- **15分足**: イントラデイ機関投資家ゾーン
- **60分足**: デイリースイングゾーン
- **現在のTF**: 任意のチャートタイムフレームへの動的適応
**主要機能**:
- **バウンス検知** - OBゾーンから価格がリバウンドする時を識別(シグナル7: 🎯 OBバウンス)
- **ブレーカー追跡** - OBが破られた時を監視し、強気OBを抵抗に、弱気OBをサポートに変換
- **ビジュアルレンダリング** - OBの強度を示す透明度付きの色分けされたボックス
- **OB方向フィルター** - 矛盾するシグナルをブロック(強気OBでSELLなし、弱気OBでBUYなし)
**なぜMTFオーダーブロックが重要か**:
60分足のオーダーブロックは、より大きなタイムフレームでの機関投資家のポジショニングを表します。3分足のエントリーシグナルと組み合わせることで、大口プレイヤーと**同じ方向**で取引することになります。
---
### 3️⃣ フェアバリューギャップ(FVG)検知
**目的**: 機関投資家が最終的に埋めなければならない価格の非効率性を識別する。
**FVGとは何か?**:
フェアバリューギャップは、価格があまりにも急速に動いて**不均衡**を残す時に発生します - 1本のローソク足の高値と2本後のローソク足の安値の間のギャップ(またはその逆)。機関投資家はこれらを修正されなければならない非効率的な価格設定と見なします。
**検知ロジック**:
```
強気FVG: high < low → ギャップアップ = 弱気の不均衡(下方フィル予想)
弱気FVG: low > high → ギャップダウン = 強気の不均衡(上方フィル予想)
```
**ビジュアルデザイン**:
- **強気FVG**: 緑のボックス(価格がバウンドすべきサポートゾーン)
- **弱気FVG**: 赤のボックス(価格が拒否されるべき抵抗ゾーン)
- **ミティゲーション追跡**: FVGは埋められると消え、完了を示す
- **出来高帰属**: 各FVGは関連する買い/売り出来高を追跡
**なぜFVGが重要か**:
機関投資家は**効率性**で動きます。ギャップは非効率性を表します。価格がギャップを埋めるために戻る時、それはランダムではありません - 機関投資家が**市場の非効率性を修正**しているのです。FVGフィルへの取引は卓越したリスク/リワードを提供します。
---
### 4️⃣ 出来高加重クラウド(VWC/TBOSI)
**目的**: 出来高加重プライスアクションを使用してモメンタムシフトとトレンド強度を検出する。
**メカニズム**:
VWCは移動平均に**ボラティリティ加重**を適用し、高ボラティリティトレンド中に拡大し、コンソリデーション中に縮小する動的クラウドを作成します。
**マルチタイムフレーム分析**:
- **1m、3m、5m**: マイクロスキャルピングモメンタム
- **15m**: イントラデイトレンド確認
- **60m、240m**: スイングトレードトレンド検証
**シグナル生成**:
- **VWCスイッチ(シグナル2)**: クラウドの色が反転した時(赤→緑または緑→赤)、モメンタム反転を示す
- **VWCステータステーブル**: 全タイムフレームのトレンド方向のリアルタイム表示
**なぜ出来高加重が重要か**:
従来の移動平均はすべてのバーを等しく扱います。VWCは**高出来高バーに重みを与え**、シグナルが低出来高のノイズではなく、実際の機関投資家の参加を反映することを保証します。
---
### 5️⃣ ノンリペイントSTDEV(NPR)&ボリンジャーバンド
**目的**: リペイントなしで極端な平均回帰ポイントを識別する。
**従来のインジケーターの問題点**:
多くのインジケーターは**リペイント**します - 新しいデータが到着すると過去の値を変更し、バックテストを誤解させます。NPRは**先読みバイアス防止**を使用して、シグナルが固定されたままであることを保証します。
**設定**:
- **15分足NPR/BB**: イントラデイボラティリティバンド
- **60分足NPR/BB**: スイングトレード極値
- **複数のカーネルオプション**: 指数、単純、二重指数、三重指数 - 異なる平滑化プロファイル
**シグナルロジック(シグナル8)**:
- **BUY**: 価格が下部バンドの**内側**でクローズ(触れるだけではない)→ 極端な売られ過ぎで機関投資家の吸収が可能性高い
- **SELL**: 価格が上部バンドの**内側**でクローズ → 極端な買われ過ぎで機関投資家の分配が可能性高い
**なぜNPRが優れているか**:
リペイントインジケーターはトレーダーにバックテストで誤った自信を与えます。NPRは、履歴で見るすべてのシグナルが、トレーダーがリアルタイムで見たであろうもの**そのもの**であることを保証します。
---
### 6️⃣ 💎 STRONG CHoChパターン検知
**目的**: 短い時間枠内で複数のCHoCH確認が整列した時の最高確率セットアップを識別する。
**パターンロジック**:
**STRONG BUYパターン**:
```
1.CHoCH → A.CHoCH → 1.CHoCH(20バー以内)
```
このシーケンスは以下を示します:
1. 初期強気構造シフト
2. 弱気リテスト(プルバック)
3. **更新された強気確認** - 機関投資家は弱い手を振り落とした後に再蓄積中
**STRONG SELLパターン**:
```
A.CHoCH → 1.CHoCH → A.CHoCH(20バー以内)
```
このシーケンスは以下を示します:
1. 初期弱気構造シフト
2. 強気リテスト(デッドキャットバウンス)
3. **更新された弱気確認** - 機関投資家はロングを罠にかけた後に再分配中
**ビジュアル表示**:
```
💎 BUY
```
- **0%透明度**(完全不透明) - 最大の視覚的優先度
- パターン完成時に**即座に**表示(追加シグナル不要)
- 市場構造フィルターから独立(パターン自体が確認)
**なぜSTRONGシグナルが異なるか**:
- **三重確認**: 3つの構造シフトが誤ったブレイクアウトを排除
- **短い時間枠**: 20バーウィンドウがランダムなノイズではなく、機関投資家の確信を保証
- **自動表示**: 価格アクションを待たない - パターン自体がアラートをトリガー
- **歴史的検証**: この特定のシーケンスは主要な機関投資家の動きに先行することが証明されている
**リスク管理**:
STRONGシグナルは最高のリスク/リワードを提供します:
1. ストップロスは中央のCHoCHの外に配置可能(タイトなリスク)
2. ターゲットは次の主要構造レベルに設定可能(大きなリワード)
3. パターン失敗は即座に明らか(間違っていればクイックエグジット)
---
### 7️⃣ マルチEMAフレームワーク
**目的**: ダイナミックなサポート/レジスタンスとトレンドコンテキストを提供する。
**EMA設定**:
- **EMA 7**: マイクロトレンド(スキャルピング)
- **EMA 20**: 短期トレンド
- **EMA 50**: 機関投資家のピボット(シグナル6: EMA50バウンス)
- **EMA 100**: 中期トレンドフィルター
- **EMA 200**: 主要な機関投資家のサポート/レジスタンス
- **EMA 400、800**: マクロトレンドコンテキスト
**ビジュアルフィル**:
- EMA間の色分けされたフィルが**ビジュアルトレンド強度ゾーン**を作成
- 収束 = コンソリデーション
- 発散 = トレンド市場
**なぜ7つのEMAか?**:
各EMAは異なる**参加者タイムフレーム**を表します:
- EMA 7/20: デイトレーダーとスキャルパー
- EMA 50/100: スイングトレーダー
- EMA 200/400/800: ポジショントレーダーと機関投資家
すべてのEMAが整列した時、**すべての参加者タイプが方向に同意**している - 最高確率のトレンド取引です。
---
## 🚀 8シグナル取引システム
Trend Gazer v5は**8つの異なるシグナル条件**(すべてデフォルトで有効)を採用しており、それぞれが異なる市場レジームを捕捉するように設計されています:
### ⭐ シグナル階層&取引哲学
**重要**: すべてのシグナルが同じではありません。インジケーターはシグナル品質の階層を表示します:
**プライマリーシグナル(これを取引する)**:
- 💎 **STRONG BUY/SELL** - 三重CHoChパターン(最優先)
- 🌟 **スターシグナル(S7、S8)** - 高確率の機関投資家ゾーン反応
- シグナル7: オーダーブロックバウンス
- シグナル8: 60m NPR/BBバウンス
**補助シグナル(確認とコンテキスト)**:
- **シグナル1-6** - これらを以下として使用:
- スターシグナルの**確認**(複数のシグナルが整列した時)
- 市場状況を理解するための**コンテキスト**
- 潜在的な動きの**早期警告**(取引前に検証)
- **追加フィルター**(例:「シグナル1も出ているスターシグナルのみ取引」)
**取引推奨**:
- **保守的トレーダー**: 💎 STRONGと🌟スターシグナル**のみ**取引
- **中程度トレーダー**: スターシグナル + 検証された補助シグナル(2+シグナル確認)
- **アクティブトレーダー**: 適切なリスク管理ですべてのシグナルを使用
視覚的透明度システムはこの階層を強化します:
- 0%透明度 = STRONG(💎) - 最高の確信
- 50%透明度 = スター(🌟)+ OBシグナル - 高品質
- 70%透明度 = 補助(S1-S6) - 補足情報
### シグナル1: RSIシフト + 構造(ANDロジック)
**最も厳格なシグナル** - RSIモメンタム確認と構造変化の両方が必要。
- **使用例**: トレンド市場での高確信取引
- **頻度**: 最も少ない、最高の精度
- **分類**:
### シグナル2: VWCスイッチ(ORロジック)
**最も頻繁なシグナル** - 監視されているタイムフレームでのVWC色反転でトリガー。
- **使用例**: 早期モメンタムシフトの捕捉
- **頻度**: 最も頻繁、アクティブトレーダーに適している
- **分類**:
### シグナル3: 構造変化
**バーカラー変化とRSI確認** - RSIサポートでローソク足の色がシフトする時を検出。
- **使用例**: トレンド継続取引
- **頻度**: 中程度
- **分類**:
### シグナル4: BBブレイクアウト + RSI
**ボリンジャーバンドブレイクアウト反転** - 価格がバンドを破った後すぐに反転。
- **使用例**: 誤ったブレイクアウトをフェード
- **頻度**: 中程度、優れたリスク/リワード
- **分類**:
### シグナル5: BB/EMA50ブレイク
**積極的ブレイクアウトシグナル** - 価格がBBとEMA50を同時にブレイク。
- **使用例**: モメンタムブレイクアウト取引
- **頻度**: 中〜高
- **分類**:
### シグナル6: EMA50バウンス反転
**EMA50での平均回帰** - 価格がEMA50に触れてバウンス。
- **使用例**: 強いトレンドでのプルバック取引
- **頻度**: 中程度、信頼性あり
- **分類**:
### シグナル7: 🌟 OBバウンス(スターシグナル)
**オーダーブロックバウンス** - 価格がOBゾーンに入って反転。
- **使用例**: 機関投資家ゾーン反応
- **頻度**: 低いが、極めて高品質
- **分類**:
- **特別機能**:
- 🎯 **OBバウンスラベル**: `🌟 🎯 BUY/SELL ` - 可視OBからの実際のシグナル7バウンス
- 📍 **In OBラベル**: `📍 BUY/SELL ` - OBゾーン内で発生する他のシグナル(S1-6、S8)
- **OB方向フィルター**: 矛盾するシグナルをブロック(強気OBでSELLなし、弱気OBでBUYなし)
### シグナル8: 🌟 60m NPR/BBバウンス(スターシグナル)
**極端な平均回帰** - 価格が60m NPR/BBバンドの極値で**内側に**クローズ。
- **使用例**: 極値での機関投資家の吸収を捕捉
- **頻度**: 低い、卓越した勝率
- **分類**:
- **特別ロジック**: ローソク足のクローズがバンドの**内側**でなければならない(触れるだけではダメ、誤ったブレイクアウトを防止)
### 💎 STRONGシグナル(ボーナス)
**CHoChパターン完成** - 三重確認された構造シフト。
- **STRONG BUY**: `1.CHoCH → A.CHoCH → 1.CHoCH(≤20バー)`
- **STRONG SELL**: `A.CHoCH → 1.CHoCH → A.CHoCH(≤20バー)`
- **表示**: パターン完成時に即座(独立したシグナル)
- **分類**:
- **使用例**: 最高確信の機関投資家トレンドシフト
---
## 🎨 ビジュアルデザイン哲学
### 透明度によるシグナル階層
**0%透明度(不透明)**:
- 💎 **STRONG BUY/SELL** - 最優先、機関投資家パターン確認
**50%透明度**:
- 🌟 **スターシグナル**(S7、S8) - 高品質平均回帰
- 🎯 **OBバウンス** - 機関投資家ゾーン反応
- 📍 **In OB** - 機関投資家ゾーン内の強化されたシグナル
- **CHoChラベル**(1.CHoCH、A.CHoCH) - 構造シフトマーカー
**70%透明度**:
- **通常シグナル**(S1-S6) - 標準取引セットアップ
この視覚的階層により、トレーダーは分析麻痺なしに高優先度セットアップを**即座に認識**できます。
### カラースキーム: 日本式ローソク足慣例
**強気 = 赤 | 弱気 = 青/緑**
これは伝統的な日本式ローソク足方法論に従います:
- **赤(陽)**: ポジティブエネルギー、上昇価格、強気
- **青/緑(陰)**: ネガティブエネルギー、下降価格、弱気
西洋の慣例はしばしばこれを逆にしますが、プロの取引ルームとの一貫性のために**ICTと機関投資家の慣例**を維持します。
---
## 📡 アラートシステム
### Any Alert(自動)
**8つのイベントを監視**:
1. 💎 **STRONG BUY** - パターン: `1.CHoCH → A.CHoCH → 1.CHoCH`
2. 💎 **STRONG SELL** - パターン: `A.CHoCH → 1.CHoCH → A.CHoCH`
3. ⭐ **Star BUY** - シグナル7または8
4. ⭐ **Star SELL** - シグナル7または8
5. 📍 **BUY (in OB)** - 強気オーダーブロック内の任意のシグナル
6. 📍 **SELL (in OB)** - 弱気オーダーブロック内の任意のシグナル
7. **Bullish CHoCH** - 強気への市場構造シフト
8. **Bearish CHoCH** - 弱気への市場構造シフト
**フォーマット**: `TICKER TIMEFRAME EventName`
**例**: `BTCUSDT 5 💎 STRONG BUY`
### 個別alertcondition()オプション
特定のイベントのカスタムアラートを作成:
- BUY/SELLシグナル(すべてまたはフィルタリング)
- スターシグナルのみ(S7/S8)
- STRONGシグナルのみ(💎)
- CHoChイベントのみ
- 強気/弱気CHoCH個別
---
## ⚙️ 設定と設定
### ICT構造フィルター(デフォルトON ⭐)
**構造フィルターを有効化**: CHoCH/SiMS/BoMS後のシグナル**のみ**表示
- **目的**: 機関投資家の確認を要求することでノイズをフィルター
- **推奨**: 規律ある取引のために有効のままにする
**構造ラベルを表示(デフォルトON ⭐)**: CHoCH/SiMS/BoMSラベルを表示
- **目的**: 市場構造状態の視覚的確認
- **ラベル**:
- `1.CHoCH`(赤背景、白テキスト) - 強気構造シフト
- `A.CHoCH`(青背景、白テキスト) - 弱気構造シフト
- `2.SMS` / `B.SMS`(赤/青テキスト) - 市場構造のシフト(2回目)
- `3.BMS` / `C.BMS`(赤/青テキスト) - 市場構造のブレイク(3回目以降)
**構造期間**: デフォルト3バー(ICT標準)
### オーダーブロック設定
**マルチタイムフレームOBを有効化**: 複数のタイムフレームから同時にOBを検出
**ミティゲーションオプション**:
- Close - ローソク足がクローズで通過した時にOB無効化
- Wick - ウィックが触れた時にOB無効化
- 50% - ゾーンの50%が侵害された時にOB無効化
**OBを表示**:
- 現在のタイムフレーム(常に)
- 1m、3m、15m、60m(選択可能)
### フェアバリューギャップ設定
**FVGを表示**: FVGレンダリングを有効/無効
**ミティゲーションソース**: Wick、Close、または50%フィル
**カラーカスタマイゼーション**: 強気FVG(緑)、弱気FVG(赤)
### シグナルフィルター
**スターシグナルのみ表示(デフォルトOFF)**:
- ONの時: S7(OBバウンス)とS8(NPR/BBバウンス)のみ表示
- OFFの時: すべてのシグナルS1-S8を表示(デフォルト)
- **使用例**: 最高品質のセットアップに集中し、ノイズを無視
### ビジュアル設定
**EMA表示**: 個別のEMAをオン/オフ切り替え
**VWCクラウド**: 出来高クラウドを有効/無効
**NPR/BBバンド**: 15mと60mバンドを表示/非表示
**ステータステーブル**: すべてのタイムフレームでのリアルタイムVWCステータス
---
## 📚 使用方法
### スキャルパー向け(1m-5m チャート)
1. **1mと3mオーダーブロック**を有効化
2. **シグナル2(VWCスイッチ)**または**シグナル5(BB/EMA50ブレイク)**を監視
3. サポート/レジスタンスとして**1m/3m MTF OB**で確認
4. マイクロターゲット設定に**FVG**を使用
5. 最高品質のスキャルプのために**Star BUY/SELL**のアラートを設定
### デイトレーダー向け(15m-60m チャート)
1. **15mと60mオーダーブロック**を有効化
2. バイアスを確立するために**CHoCH**を待つ
3. **シグナル7(OBバウンス)**または**シグナル8(60m NPR/BBバウンス)**を取引
4. ダイナミックストップ配置に**EMA 50/100**を使用
5. 主要な動きのために**💎 STRONG BUY/SELL**のアラートを設定
### スイングトレーダー向け(4H-日足 チャート)
1. **60mオーダーブロック**を有効化(HTFでより大きなゾーンとしてレンダリング)
2. **市場構造確認**(CHoCH)を待つ
3. 最高確信のために**シグナル1(RSIシフト + 構造)**に集中
4. マクロトレンド整列のために**EMA 200/400/800**を使用
5. 構造シフトを早期に捕捉するために**Bullish/Bearish CHoCH**のアラートを設定
### ユニバーサル戦略(推奨アプローチ)
1. **まずプライマリーシグナルに集中** - 💎 STRONGと🌟スターシグナル**のみ**でトラックレコードを構築
2. **市場構造を待つ** - CHoCH方向に逆らって取引しない
3. **補助シグナルを確認に使用** - スターシグナルが現れたら、補助シグナル(S1-6)も確認するかチェック
4. **オーダーブロックを尊重** - OB方向と矛盾するシグナルをフェード
5. **ターゲットにFVGを使用** - 価格は埋められていないギャップに引き寄せられる
6. **徐々に補助シグナルを組み込む** - プライマリーシグナルで利益が出たら、検証された補助セットアップを実験
### シグナル品質統計(典型的な観察)
一般的な市場行動パターンに基づく:
**💎 STRONGシグナル**:
- 頻度: まれ(日足チャートで週1-3回)
- 勝率: 非常に高い(適切なリスク管理適用時70-85%)
- リスク/リワード: 優秀(典型的に1:3から1:5+)
**🌟 スターシグナル(S7、S8)**:
- 頻度: 中程度(短期足で1日2-5回)
- 勝率: 高い(構造と整列時60-75%)
- リスク/リワード: 良好(典型的に1:2から1:4)
**補助シグナル(S1-6)**:
- 頻度: 高い(活発なタイムフレームで1時間に複数回)
- 勝率: 中程度(単独で50-65%、確認として使用時はより高い)
- リスク/リワード: 変動(典型的に1:1から1:3)
**重要な洞察**: プライマリーシグナルのみの取引は取引頻度を減らしますが、一貫性と心理的容易さを劇的に改善します。
---
## 🏆 このインジケーターのユニークな点
### 1. **真のマルチタイムフレーム統合**
ほとんどの「MTF」インジケーターは単に他のタイムフレームからデータを表示するだけです。Trend Gazer v5はMTFデータを統一されたシグナルに**合成**し、矛盾する情報を排除します。
### 2. **ノンリペイント・アーキテクチャ**
すべてのシグナルはバークローズで固定されます。バックテストで見るものは、リアルタイムで見るであろうもの**そのもの**です。
### 3. **機関投資家フォーカス**
すべてのコンポーネントは機関投資家の行動を中心に設計されています:
- どこで蓄積するか(オーダーブロック)
- いつシフトするか(CHoCH)
- 何を修正しなければならないか(FVG)
- どのようにモメンタムを作り出すか(VWC)
### 4. **完全な透明性**
- **オープンソース** - 完全なコード可視性
- **クレジットされたソース** - すべての借用コンセプトが帰属
- **ブラックボックスなし** - すべての計算が文書化
### 5. **柔軟だが焦点を絞った**
- **8シグナルタイプ** - 任意の市場レジームに適応
- **最適化されたデフォルト設定** - 調整なしですぐに動作
- **オプションフィルター** - 規律あるトレーダーのための「スターシグナルのみ表示」
### 6. **プロフェッショナルアラートシステム**
- **8イベントAny Alert** - 機関投資家の動きを見逃さない
- **個別alertconditions** - あなたの戦略にカスタマイズ
- **フォーマットされたメッセージ** - 即座のコンテキストのためのTicker + Timeframe + Event
---
## 📖 教育的価値
### ICT概念の学習
このインジケーターは以下のための**視覚的教育ツール**として機能します:
- **市場構造**: CHoCH/SiMS/BoMSをリアルタイムで見る
- **オーダーブロック**: 機関投資家がどこでポジショニングしたかを理解
- **フェアバリューギャップ**: 非効率性がどのように埋められるかを学ぶ
- **スマートマネー行動**: 機関投資家の足跡が展開するのを観察
### バックテスティングと戦略開発
Trend Gazer v5を使用して:
1. **ICT概念を検証** - OBバウンスは本当に機能するか?テストする。
2. **エントリータイミングを最適化** - あなたの市場でどのシグナルが最も機能するか?
3. **フィルターを開発** - あなたのエッジのためにシグナルを組み合わせる
4. **戦略を構築** - シグナルをPine Scriptストラテジーにエクスポート
---
## ⚠️ 免責事項
このインジケーターは**教育および情報提供のみを目的**としています。金融アドバイスではありません。
**リスク警告**:
- 取引には重大な損失リスクが伴い、すべての投資家に適しているわけではありません
- 過去のパフォーマンスは将来の結果を**示すものではありません**
- どのインジケーターも利益ある取引を保証することはできません
- あなたは自分の取引決定に対して単独で責任を負います
**取引前に**:
- 自分自身の調査とデューデリジェンスを実施
- 資格のある金融アドバイザーに相談
- 適切なリスク管理を使用(取引あたり1-2%以上リスクを取らない)
- ライブ取引前にペーパー/デモアカウントで練習
- 損失は取引の一部であることを理解
このインジケーターによって提供される情報は、投資アドバイス、金融アドバイス、取引アドバイス、またはその他の種類のアドバイスを構成するものではありません。インジケーターの出力をそのように扱うべきではありません。作成者は、あなたが任意の暗号通貨、証券、または商品を買い、売り、または保有すべきであると推奨するものではありません。常に自分自身の調査を行い、専門的なアドバイスを求めてください。
このソフトウェアは、明示的または黙示的を問わず、いかなる種類の保証もなく「現状のまま」提供されます。
---
## 🔗 クレジットとライセンス
### 原作コードソース
1. **ICT Donchian Smart Money Structure**
- 作者: Zeiierman
- ライセンス: CC BY-NC-SA 4.0
- 変更: マルチシグナルシステムと統合、CHoChパターン検知を追加
2. **Reverse RSI Signals**
- 作者: AlgoAlpha
- ライセンス: MPL 2.0
- 変更: 内部シグナルロジックに適応
3. **Volumetric Weighted Cloud(VWC/TBOSI)**
- 元のコンセプトをマルチタイムフレーム分析に適応
- MTFテーブル表示で強化
4. **Order Block & FVG Detection**
- ICTコンセプトに基づく
- MTFサポートでカスタム実装
### このインジケーターのライセンス
**Mozilla Public License 2.0(MPL 2.0)**
以下が自由です:
- ✅ 商用利用
- ✅ 変更と配布
- ✅ 私的使用
- ✅ 特許使用
条件:
- 📄 ソースを開示
- 📄 ライセンスと著作権表示
- 📄 変更に同じライセンス
---
## 📞 サポートとコミュニティ
### 問題の報告
バグに遭遇したり機能提案がある場合は、以下を提供してください:
1. チャートタイムフレームとシンボル
2. 設定構成
3. 問題のスクリーンショット
4. 期待される動作と実際の動作
### ベストプラクティス
- デフォルト設定で開始
- 各コンポーネントを理解するために段階的に機能を有効/無効化
- ライブ取引前に少なくとも30日間デモアカウントを使用
- 適切なリスク管理と組み合わせる
---
## 🚀 バージョン履歴
### v5.0 - Simplified ICT Mode(現在)
- ✅ すべての未使用フィルターと機能を削除
- ✅ すべての8シグナルをデフォルトで有効化
- ✅ 💎 STRONG CHoChパターン検知を追加
- ✅ OBバウンスラベリングシステムを強化
- ✅ FVG検知と可視化を追加
- ✅ アラートシステムを改善(8イベント)
- ✅ パフォーマンスを最適化(より速いレンダリング)
- ✅ 包括的なDESCRIPTIONドキュメントを追加
### v4.2 - ICT Mode with EMA Convergence Filter(非推奨)
- EMA収束機能を持つレガシーバージョン(シンプルさのために削除)
### v4.0 - Pure ICT Mode(非推奨)
- 初期ICTフォーカスリリース
---
## 🎓 推奨学習リソース
このインジケーターを完全に活用するために、以下を学習してください:
1. **ICTコンセプト**(Inner Circle Trader - YouTube)
- 市場構造
- オーダーブロック
- フェアバリューギャップ
- 流動性コンセプト
2. **スマートマネーコンセプト(SMC)**
- Change of Character(CHoCH)
- Break of Structure(BOS)
- Liquidity Sweeps
3. **Volume Spread Analysis(VSA)**
- Effort vs Result
- Supply vs Demand
- Volume Climax
4. **リスク管理**
- ポジションサイジング
- R-Multiple理論
- 勝率vsリスク/リワードバランス
---
## ✅ クイックスタートチェックリスト
- チャートにインジケーターを追加
- **構造フィルターを有効化**がONであることを確認
- **構造ラベルを表示**がONであることを確認
- 希望するMTFオーダーブロックを有効化(1m、3m、15m、60m)
- FVG表示を有効化
- すべての8イベントのために**Any Alert**を設定
- 最低30日間ペーパートレード
- 取引を文書化(スクリーンショット + ノート)
- 週次でパフォーマンスをレビュー
- あなたの戦略に基づいてフィルターを調整
---
## 💡 最後の考え
**Trend Gazer v5は「魔法のボタン」インジケーターではありません。**教育、練習、規律を必要とするプロフェッショナル分析フレームワークです。
最高のトレーダーは、インジケーターを使って**何をすべきかを教えてもらいません**。インジケーターを使って、プライスアクションで**既に見ているものを確認**します。
このツールを使用して:
- ✅ 分析を確認
- ✅ 低確率セットアップをフィルターアウト
- ✅ 機関投資家の足跡を識別
- ✅ エントリーを精密にタイミング
使用を避けるべき:
- ❌ コンテキストを理解せずに盲目的に取引
- ❌ リスク管理を無視
- ❌ 損失後にリベンジトレード
- ❌ 教育を自動化に置き換える
**スマートに取引しましょう。安全に取引しましょう。構造を持って取引しましょう。**
---
**© rasukaru666 | 2025 | Mozilla Public License 2.0**
*このインジケーターは、取引教育コミュニティに貢献するためにオープンソースとして公開されています。役立つ場合は、あなたの経験を共有して他の人が学ぶのを助けてください。*

NormalizedIndicatorsNormalizedIndicators - Comprehensive Trend Normalization Library
Overview
This Pine Script™ library provides an extensive collection of normalized trend-following indicators and calculation functions for technical analysis. The main advantage of this library lies in its unified signal output: All trend indicators are normalized to a standardized format where 1 represents a bullish signal, -1 represents a bearish signal, and 0 (where applicable) represents a neutral signal.
This normalization enables traders to seamlessly combine different indicators, create consensus signals, and develop complex multi-indicator strategies without worrying about different scales and interpretations.
📊 Categories
The library is divided into two main categories:
1. Trend-Following Indicators
2. Calculation Indicators
🔄 Trend-Following Indicators
Stationary Indicators
These oscillate around a fixed value and are not bound to price.
BBPct() - Bollinger Bands Percent
Source: Algoalpha X Sushiboi77
Parameters:
Length: Period for Bollinger Bands
Factor: Standard deviation multiplier
Source: Price source (typical: close)
Logic: Calculates the position of price within the Bollinger Bands as a percentage
Signal:
1 (bullish): when positionBetweenBands > 50
-1 (bearish): when positionBetweenBands ≤ 50
Special Feature: Uses an array to store historical standard deviations for additional analysis
RSI() - Relative Strength Index
Source: TradingView
Parameters:
len: RSI period
src: Price source
smaLen: Smoothing period for RSI
Logic: Classic RSI with additional SMA smoothing
Signal:
1 (bullish): RSI-SMA > 50
-1 (bearish): RSI-SMA < 50
0 (neutral): RSI-SMA = 50
Non-Stationary Indicators
These follow price movement and have no fixed boundaries.
NorosTrendRibbonSMA() & NorosTrendRibbonEMA()
Source: ROBO_Trading
Parameters:
Length: Moving average and channel period
Source: Price source
Logic: Creates a price channel based on the highest/lowest MA value over a specified period
Signal:
1 (bullish): Price breaks above upper band
-1 (bearish): Price breaks below lower band
0 (neutral): Price within channel (maintains last state)
Difference: SMA version uses simple moving averages, EMA version uses exponential
TrendBands()
Source: starlord_xrp
Parameters: src (price source)
Logic: Uses 12 EMAs (9-30 period) and checks if all are rising or falling simultaneously
Signal:
1 (bullish): All 12 EMAs are rising
-1 (bearish): All 12 EMAs are falling
0 (neutral): Mixed signals
Special Feature: Very strict conditions - extremely strong trend filter
Vidya() - Variable Index Dynamic Average
Source: loxx
Parameters:
source: Price source
length: Main period
histLength: Historical period for volatility calculation
Logic: Adaptive moving average that adjusts to volatility
Signal:
1 (bullish): VIDYA is rising
-1 (bearish): VIDYA is falling
VZO() - Volume Zone Oscillator
Parameters:
source: Price source
length: Smoothing period
volumesource: Volume data source
Logic: Combines price and volume direction, calculates the ratio of directional volume to total volume
Signal:
1 (bullish): VZO > 14.9
-1 (bearish): VZO < -14.9
0 (neutral): VZO between -14.9 and 14.9
TrendContinuation()
Source: AlgoAlpha
Parameters:
malen: First HMA period
malen1: Second HMA period
theclose: Price source
Logic: Uses two Hull Moving Averages for trend assessment with neutrality detection
Signal:
1 (bullish): Uptrend without divergence
-1 (bearish): Downtrend without divergence
0 (neutral): Trend and longer MA diverge
LeonidasTrendFollowingSystem()
Source: LeonidasCrypto
Parameters:
src: Price source
shortlen: Short EMA period
keylen: Long EMA period
Logic: Simple dual EMA crossover system
Signal:
1 (bullish): Short EMA < Key EMA
-1 (bearish): Short EMA ≥ Key EMA
ysanturtrendfollower()
Source: ysantur
Parameters:
src: Price source
depth: Depth of Fibonacci weighting
smooth: Smoothing period
bias: Percentage bias adjustment
Logic: Complex system with Fibonacci-weighted moving averages and bias bands
Signal:
1 (bullish): Weighted MA > smoothed MA (with upward bias)
-1 (bearish): Weighted MA < smoothed MA (with downward bias)
0 (neutral): Within bias zone
TRAMA() - Trend Regularity Adaptive Moving Average
Source: LuxAlgo
Parameters:
src: Price source
length: Adaptation period
Logic: Adapts to trend regularity - accelerates in stable trends, slows in consolidations
Signal:
1 (bullish): Price > TRAMA
-1 (bearish): Price < TRAMA
0 (neutral): Price = TRAMA
HullSuite()
Source: InSilico
Parameters:
_length: Base period
src: Price source
_lengthMult: Length multiplier
Logic: Uses Hull Moving Average with lagged comparisons for trend determination
Signal:
1 (bullish): Current Hull > Hull 2 bars ago
-1 (bearish): Current Hull < Hull 2 bars ago
0 (neutral): No change
STC() - Schaff Trend Cycle
Source: shayankm (described as "Better MACD")
Parameters:
length: Cycle period
fastLength: Fast MACD period
slowLength: Slow MACD period
src: Price source
Logic: Combines MACD concepts with stochastic normalization for early trend signals
Signal:
1 (bullish): STC is rising
-1 (bearish): STC is falling
🧮 Calculation Indicators
These functions provide specialized mathematical calculations for advanced analysis.
LCorrelation() - Long-term Correlation
Creator: unicorpusstocks
Parameters:
Input: First time series
Compare: Second time series
Logic: Calculates the average of correlations across 6 different periods (30, 60, 90, 120, 150, 180)
Returns: Correlation value between -1 and 1
Application: Long-term relationship analysis between assets, markets, or indicators
MCorrelation() - Medium-term Correlation
Creator: unicorpusstocks
Parameters:
Input: First time series
Compare: Second time series
Logic: Calculates the average of correlations across 6 different periods (15, 30, 45, 60, 75, 90)
Returns: Correlation value between -1 and 1
Application: Medium-term relationship analysis with higher sensitivity
assetBeta() - Beta Coefficient
Creator: unicorpusstocks
Parameters:
measuredSymbol: The asset to be measured
baseSymbol: The reference asset (e.g., market index)
Logic:
Calculates Beta across 4 different time horizons (50, 100, 150, 200 periods)
Beta = Correlation × (Asset Standard Deviation / Market Standard Deviation)
Returns the average of all 4 Beta values
Returns: Beta value (typically 0-2, can be higher/lower)
Interpretation:
Beta = 1: Asset moves in sync with the market
Beta > 1: Asset more volatile than market
Beta < 1: Asset less volatile than market
Beta < 0: Asset moves inversely to the market
💡 Usage Examples
Example 1: Multi-Indicator Consensus
pinescriptimport unicorpusstocks/MyIndicatorLibrary/1 as lib
// Combine multiple indicators
signal1 = lib.BBPct(20, 2.0, close)
signal2 = lib.RSI(14, close, 5)
signal3 = lib.TRAMA(close, 50)
// Consensus signal: At least 2 of 3 must agree
consensus = (signal1 + signal2 + signal3)
strongBuy = consensus >= 2
strongSell = consensus <= -2
Example 2: Correlation-Filtered Trading
pinescriptimport unicorpusstocks/MyIndicatorLibrary/1 as lib
// Only trade when strong correlation with market exists
spy = request.security("SPY", timeframe.period, close)
correlation = lib.MCorrelation(close, spy)
trendSignal = lib.NorosTrendRibbonEMA(50, close)
// Only bullish signals with positive correlation
tradeBuy = trendSignal == 1 and correlation > 0.5
tradeSell = trendSignal == -1 and correlation > 0.5
Example 3: Beta-Adjusted Position Sizing
pinescriptimport unicorpusstocks/MyIndicatorLibrary/1 as lib
spy = request.security("SPY", timeframe.period, close)
beta = lib.assetBeta(close, spy)
// Adjust position size based on Beta
basePositionSize = 100
adjustedSize = basePositionSize / beta // Less size with high Beta
⚙️ Technical Details
Normalization Standard
Bullish: 1
Bearish: -1
Neutral: 0 (only for selected indicators)
Advantages of Normalization
Simple Aggregation: Signals can be added/averaged
Consistent Interpretation: No confusion about different scales
Strategy Development: Simplified logic for backtesting
Combinability: Seamlessly mix different indicator types
Performance Considerations
All functions are optimized for Pine Script v5
Proper use of var for state management
Efficient array operations where needed
Minimal recursive calls
📋 License
This code is subject to the Mozilla Public License 2.0. More details at: mozilla.org
🎯 Use Cases
This library is ideal for:
Quantitative Traders: Systematic strategy development with unified signals
Multi-Timeframe Analysis: Consensus across different timeframes
Portfolio Managers: Beta and correlation analysis for diversification
Algo Traders: Machine learning with standardized features
Retail Traders: Simplified signal interpretation without deep technical knowledge
🔧 Installation
pinescriptimport unicorpusstocks/MyIndicatorLibrary/1
Then use the functions with your chosen alias:
pinescriptlib.BBPct(20, 2.0, close)
lib.RSI(14, close, 5)
// etc.
⚠️ Important Notes
All indicators are lagging, as is typical for trend-following indicators
Signals should be combined with additional analysis (volume, support/resistance, etc.)
Backtesting is recommended before starting live trading with these signals
Different assets and timeframes may require different parameter optimizations
This library provides a solid foundation for professional trading system design with the flexibility to develop your own complex strategies while abstracting away technical complexity.

MULTI-CONDITION RSI SIGNAL GENERATOR═══════════════════════════════════════════════
MULTI-CONDITION RSI SIGNAL GENERATOR
═══════════════════════════════════════════════
OVERVIEW:
This indicator generates trading signals based on Relative Strength Index (RSI) movements with multiple confirmation layers designed to filter false signals and identify high-probability reversal opportunities.
═══════════════════════════════════════════════
WHAT MAKES THIS ORIGINAL:
═══════════════════════════════════════════════
Unlike basic RSI indicators that simply plot overbought/oversold crossovers, this system combines FOUR distinct confirmation mechanisms:
1. PERSISTENCE FILTERING - Requires RSI to remain in extreme zones for a minimum duration
2. LOOKBACK VALIDATION - Verifies recent extreme zone visits before signaling
3. DIVERGENCE DETECTION - Identifies price/RSI divergence for stronger signals
4. MOMENTUM CONFIRMATION - Provides trend-continuation entries via midline crosses
This multi-layered approach significantly reduces whipsaw trades that plague simple RSI crossover systems.
═══════════════════════════════════════════════
HOW IT WORKS (TECHNICAL METHODOLOGY):
═══════════════════════════════════════════════
STEP 1: RSI CALCULATION
- Standard RSI calculation using user-defined period (default: 14)
- Monitors two extreme zones: Overbought (default: 70) and Oversold (default: 30)
STEP 2: PERSISTENCE FILTERING
The script counts how many bars RSI has spent in extreme zones within the lookback period:
- For overbought signals: Counts bars where RSI > 70
- For oversold signals: Counts bars where RSI < 30
- Signal only triggers if count >= Minimum Duration (default: 4 bars)
This filters out brief spikes that immediately reverse, focusing on sustained extreme conditions that are more likely to lead to genuine reversals.
STEP 3: LOOKBACK VALIDATION
- Checks if RSI reached extreme zones within the Lookback Bars period (default: 20)
- Uses ta.highest() and ta.lowest() functions to verify recent extremes
- Ensures we're trading reversals from meaningful extremes, not random crossovers
STEP 4: BASIC SIGNAL GENERATION
- BUY SIGNAL: RSI crosses above the oversold level (30) after meeting persistence and lookback conditions
- SELL SIGNAL: RSI crosses below the overbought level (70) after meeting persistence and lookback conditions
STEP 5: DIVERGENCE DETECTION
The script identifies two types of divergence over the Divergence Lookback period (default: 5 bars):
A) BULLISH DIVERGENCE (indicates potential upward reversal):
- Price makes a lower low (current low < previous low)
- RSI makes a higher low (current RSI low > previous RSI low)
- Suggests weakening downward momentum
B) BEARISH DIVERGENCE (indicates potential downward reversal):
- Price makes a higher high (current high > previous high)
- RSI makes a lower high (current RSI high < previous RSI high)
- Suggests weakening upward momentum
STEP 6: STRONG SIGNAL CONFIRMATION
- STRONG BUY: Basic buy signal + bullish divergence present
- STRONG SELL: Basic sell signal + bearish divergence present
- These represent the highest-probability setups
STEP 7: MOMENTUM SIGNALS (OPTIONAL)
- MOMENTUM BUY: RSI crosses above 50 after being oversold (trend continuation)
- MOMENTUM SELL: RSI crosses below 50 after being overbought (trend continuation)
- Smaller signals for traders who want trend-following entries
═══════════════════════════════════════════════
SIGNAL TYPES AND VISUAL INDICATORS:
═══════════════════════════════════════════════
📈 GREEN TRIANGLE (below bar) - Standard Buy Signal
RSI crossed above oversold level with confirmation filters
📉 RED TRIANGLE (above bar) - Standard Sell Signal
RSI crossed below overbought level with confirmation filters
🔵 BLUE TRIANGLE (below bar) - Strong Buy Signal
Buy signal + bullish divergence (HIGHEST PRIORITY)
🟣 PURPLE TRIANGLE (above bar) - Strong Sell Signal
Sell signal + bearish divergence (HIGHEST PRIORITY)
🟢 GREEN CIRCLE (small) - Momentum Buy
RSI crosses above 50 after oversold conditions
🔴 RED CIRCLE (small) - Momentum Sell
RSI crosses below 50 after overbought conditions
BACKGROUND SHADING:
- Light red background: RSI currently overbought
- Light green background: RSI currently oversold
═══════════════════════════════════════════════
PARAMETER SETTINGS:
═══════════════════════════════════════════════
1. OVERBOUGHT LEVEL (default: 70, range: 50-90)
- Higher values = fewer but stronger overbought signals
- Lower values = more sensitive to overbought conditions
- Recommended: 70 for standard markets, 80 for crypto/volatile assets
2. OVERSOLD LEVEL (default: 30, range: 10-50)
- Lower values = fewer but stronger oversold signals
- Higher values = more sensitive to oversold conditions
- Recommended: 30 for standard markets, 20 for crypto/volatile assets
3. RSI PERIOD (default: 14, range: 2-50)
- Standard RSI calculation period
- Lower = more sensitive/faster signals
- Higher = smoother/slower signals
- Recommended: 14 (industry standard)
4. MINIMUM DURATION (default: 4, range: 1-20)
- Required bars in extreme zone before signal
- Higher values = fewer signals but better quality
- Lower values = more signals but more false positives
- Recommended: 3-5 for day trading, 5-10 for swing trading
5. LOOKBACK BARS (default: 20, range: 5-100)
- How far back to check for extreme zone visits
- Should match your typical trading timeframe
- Recommended: 20 for intraday, 50 for daily charts
6. DIVERGENCE LOOKBACK (default: 5, range: 2-20)
- Period for comparing price/RSI highs and lows
- Lower values = more frequent divergence signals
- Higher values = more significant divergences
- Recommended: 5-10 depending on timeframe
═══════════════════════════════════════════════
HOW TO USE THIS INDICATOR:
═══════════════════════════════════════════════
RECOMMENDED TRADING APPROACH:
1. PRIMARY ENTRIES: Focus on Strong Buy/Sell signals (blue/purple triangles)
- These have the highest win rate due to divergence confirmation
- Wait for price action confirmation (support/resistance, candlestick patterns)
2. SECONDARY ENTRIES: Regular Buy/Sell signals (green/red triangles)
- Use these when Strong signals are infrequent
- Require additional confirmation from other indicators or chart patterns
3. TREND CONTINUATION: Momentum signals (small circles)
- Best used when overall trend is clear
- Not recommended for reversal trading
4. FILTER TRADES: Use background shading as context
- Be cautious entering longs when background is red (overbought)
- Be cautious entering shorts when background is green (oversold)
RISK MANAGEMENT GUIDELINES:
- Never risk more than 2-5% of capital per trade
- Use stop losses below recent swing lows (buys) or above swing highs (sells)
- Target at least 1.5:1 reward-to-risk ratio
- Consider position sizing based on signal strength
TIMEFRAME RECOMMENDATIONS:
- 15min - 1hour: Day trading with adjusted parameters (lower minimum duration)
- 4hour - Daily: Swing trading with default parameters
- Weekly: Position trading with increased lookback periods
COMPLEMENTARY TOOLS:
This indicator works best when combined with:
- Support and resistance levels
- Trend indicators (moving averages, trend lines)
- Volume analysis
- Price action patterns (engulfing candles, pin bars)
═══════════════════════════════════════════════
LIMITATIONS AND CONSIDERATIONS:
═══════════════════════════════════════════════
- This is NOT a standalone trading system - requires additional analysis
- RSI-based strategies perform best in ranging/choppy markets
- May generate fewer signals in strong trending markets
- Divergence signals can be early - wait for price confirmation
- Not recommended for highly illiquid assets
- Backtest on your specific market before live trading
- No indicator is 100% accurate - always use proper risk management
═══════════════════════════════════════════════
TECHNICAL NOTES:
═══════════════════════════════════════════════
- Code is original and does not reuse external libraries
- Uses Pine Script v5 native functions only
- Alert conditions included for all signal types
- No repainting - signals appear and remain fixed
- Efficient calculation methods minimize processing load
═══════════════════════════════════════════════
ALERT SETUP:
═══════════════════════════════════════════════
Four alert conditions are available:
1. "Buy Alert" - Triggers on standard buy signals
2. "Sell Alert" - Triggers on standard sell signals
3. "Strong Buy Alert" - Triggers on divergence-confirmed buy signals
4. "Strong Sell Alert" - Triggers on divergence-confirmed sell signals
To set up alerts: Right-click chart → Add Alert → Select desired condition
═══════════════════════════════════════════════
This indicator is provided for educational and informational purposes. Always practice proper risk management and never trade with money you cannot afford to lose.

RSI: chart overlay
This indicator maps RSI thresholds directly onto price. Since the EMA of price aligns with RSI’s 50-line, it draws a volatility-based band around the EMA to reveal levels such as 70 and 30.
By converting RSI values into visible price bands, the overlay lets you see exactly where price would have to move to hit traditional RSI boundaries. These bands adapt in real time to both price movement and market volatility, keeping the classic RSI logic intact while presenting it in the context of price action. This approach helps traders interpret RSI signals without leaving the main chart window.
The calculation uses the same components as the RSI: alternative derivation script: Wilder’s EMA for smoothing, a volatility-based unit for scaling, and a normalization factor. The result is a dynamic band structure on the chart, representing RSI boundary levels in actual price terms.
Key components and calculation breakdown:
Wilder’s EMA
Used as the anchor point for measuring price position.
myEMA = ta.rma(close, Length)
Volatility Unit
Derived from the EMA of absolute close-to-close price changes.
CC_vol = ta.rma(math.abs(close - close ), Length)
Normalization Factor
Scales the volatility unit to align with the RSI formula’s structure.
normalization_factor = 1 / (Length - 1)
Upper and Lower Boundaries
Defines price bands corresponding to selected RSI threshold values.
up_b = myEMA + ((upper - 50) / 50) * (CC_vol / normalization_factor)
down_b = myEMA - ((50 - lower) / 50) * (CC_vol / normalization_factor)
Inputs
RSI length
Upper boundary – RSI level above 50
Lower boundary – RSI level below 50
ON/OFF toggle for 50-point line (EMA of close prices)
ON/OFF toggle for overbought/oversold coloring (use with line chart)
Interpretation:
Each band on the chart represents a chosen RSI level.
When price touches a band, RSI is at that threshold.
The distance between moving average and bands adjusts automatically with volatility and your selected RSI length.
All calculations remain fully consistent with standard RSI values.
Feedback and code suggestions are welcome, especially regarding implementation efficiency and customization.

MACD-V MomentumThe MACD-V (Moving Average Convergence Divergence – Volatility Normalized) is an award-winning momentum indicator created by Alex Spiroglou, CFTe, DipTA (ATAA). It improves on the traditional MACD by normalizing momentum with volatility, solving several well-known limitations of classic indicators:
✅ Time stability – readings are consistent across history
✅ Cross-market comparability – works equally on stocks, crypto, forex, and commodities
✅ Objective momentum framework – universal thresholds at +150 / -150, +50 / -50
✅ Cleaner signals – reduces false signals in ranges and lag in high momentum
By dividing the MACD spread by ATR, the indicator expresses momentum in volatility units, allowing meaningful comparison across timeframes and markets.
MACD-V defines seven objective momentum states:
Risk (Oversold): below -150
Rebounding: -150 to +50 and above signal
Rallying: +50 to +150 and above signal
Risk (Overbought): above +150
Retracing: above -50 and below signal
Reversing: -150 to -50 and below signal
Ranging: between -50 and +50 for N bars
Optional background tints highlight the active regime (Bull above 200-MA, Bear below 200-MA).
Rare extremes (e.g., MACD-V < -100 in a bull regime) are tagged for additional context.
Use Cases
Identify and track momentum lifecycles across any market
Spot rare extremes for potential reversal opportunities
Filter out low-momentum whipsaws in ranging conditions
Compare momentum strength across multiple symbols
Support systematic and rule-based strategy development

Volume-Weighted RSI & Multi-Normalized MACD### Description for Publishing: Volume-Weighted RSI & Multi-Normalized MACD
**Overview**
The "Volume-Weighted RSI & Multi-Normalized MACD" indicator is a powerful and versatile tool designed for traders seeking enhanced momentum and trend analysis. Combining a volume-weighted Relative Strength Index (VW-RSI) with a customizable Moving Average Convergence Divergence (MACD) featuring multiple normalization methods, this indicator provides deep insights into market dynamics. It supports multi-timeframe (MTF) analysis and includes an optional stepped plotting mode for discrete signal visualization, making it ideal for both trend-following and mean-reversion strategies across various markets (stocks, forex, crypto, etc.).
**Key Features**
1. **Volume-Weighted RSI (VW-RSI)**:
- A modified RSI that incorporates trading volume for greater sensitivity to market activity.
- Normalized to a user-defined range (default: -50 to +50) for consistent analysis.
- Optional smoothing with multiple moving average types (SMA, EMA, WMA, VWMA, SMMA, or SMA with Bollinger Bands) to reduce noise and highlight trends.
- Overbought (+20) and oversold (-20) levels for quick reference.
2. **Multi-Normalized MACD**:
- Offers six normalization methods for MACD, allowing traders to tailor the output to their strategy:
- Normalized Volume Weighted MACD (unbounded).
- Min-Max Normalization (bounded).
- Volatility Normalization (unbounded, volatility-adjusted).
- Volatility Normalization with Min-Max (bounded).
- Hyperbolic Tangent Normalization (bounded).
- Arctangent Normalization (bounded).
- Min-Max with Smoothing (bounded).
- All bounded methods scale to the user-defined range (default: -50 to +50), ensuring comparability with VW-RSI.
- Dynamic color changes for MACD line (lime/red) and histogram (aqua/blue/red/maroon) based on momentum and signal line crosses.
3. **Stepped Plotting Mode**:
- Optional mode to plot RSI and MACD as discrete, stepped lines, reducing noise by only updating when values change significantly (configurable thresholds).
- Ideal for traders focusing on clear, actionable signal changes.
4. **Multi-Timeframe Support**:
- Configurable timeframe input (default: chart timeframe) for analyzing RSI and MACD on higher or lower timeframes, enhancing cross-timeframe strategies.
5. **Customizable Display**:
- Toggle options to show/hide MACD line, signal line, histogram, and cross dots.
- Bollinger Bands for RSI smoothing (optional) with adjustable standard deviation multiplier.
- Clear visual cues with horizontal lines for overbought/oversold levels, midline, and MACD bounds.
**Usage Instructions**
1. **Add to Chart**: Apply the indicator to any symbol (e.g., BTCUSD, SPY) on any timeframe (1H, 1D, etc.).
2. **Configure Settings**:
- **General**: Adjust `Lower Bound` (-50 default) and `Upper Bound` (+50 default) for the output range. Set `Timeframe` for MTF analysis. Enable `Stepped?` for discrete plotting.
- **RSI**: Choose `Price Source` (default: ohlc4), `RSI Length` (default: 9), and smoothing options (e.g., EMA, Bollinger Bands). Adjust `RSI Diff Threshold` for stepped mode.
- **MACD**: Select `Price Source`, `Fast Length` (9), `Slow Length` (21), `Signal Length` (9), and a normalization method (default: Volatility Min-Max). Adjust `MACD Diff Threshold` for stepped mode.
- **Display Options**: Toggle MACD components and histogram colors for clarity.
3. **Interpretation**:
- **VW-RSI**: Watch for crosses above +20 (overbought) or below -20 (oversold) for potential reversals. Use smoothed RSI or Bollinger Bands for trend confirmation.
- **MACD**: Look for MACD/Signal line crosses (dots indicate crossings) and histogram changes for momentum shifts. Bounded normalizations align with RSI for unified analysis.
- **Stepped Mode**: Focus on significant changes in RSI/MACD for clearer signals.
4. **Companion Overlay**: For visualization on the main price chart, use the companion script "VW-RSI & MACD Price Overlay" (available separately, requires this script to be published). It plots RSI and MACD as price-scaled echo lines, with toggles to show/hide and customizable scaling (high/low or ATR).
**Who Is This For?**
- **Trend Traders**: Use MACD normalizations and MTF to identify momentum shifts across timeframes.
- **Mean-Reversion Traders**: Leverage VW-RSI’s overbought/oversold signals for entry/exit points.
- **Technical Analysts**: Customize normalization and smoothing to match specific market conditions.
- **All Markets**: Works on stocks, forex, cryptocurrencies, and more, with any timeframe.
**Notes**
- Unbounded MACD normalizations (`enable_nvw`, `enable_vol`) may produce values outside -50/+50, suitable for volatility-focused strategies.
- For price chart overlay, publish this script and use its ID in the companion script’s `request.security` call.
- Adjust scaling inputs in the companion script for optimal visualization on volatile or stable assets.
**Author’s Note**
Developed by NEPOLIX, this indicator combines volume-weighted precision with flexible normalization for robust technical analysis. Feedback and suggestions are welcome to enhance future versions!

SMA+MACD+RSI+Stoch Entry📌 Tools Used:
• SMA 21, SMA 50, SMA 200
• MACD (12, 26, 9)
• Pivot Point Standard
• RSI (length 75)
• Stochastic (14, 3, 3)
Trading Timeframe:
• Usable on all timeframes
Chart Preparation:
• Analyze the overall market trend and the instrument being traded
• Set an appropriate timeframe according to the market
• Apply SMA 21, SMA 50, SMA 200
• Apply MACD and Pivot Point Standard
• Ensure a proper market trend by checking the position of SMA 21, SMA 50, and SMA 200 relative to each other
If there are too many crossings between SMA 21, SMA 50, and SMA 200, do not enter any trades until the market trend stabilizes
Conditions for Entering a Long Trade (Bullish Trigger):
• Candle closes above the pivot line
• Confirm an uptrend by checking that SMA 21 is above SMA 50, and SMA 50 is above SMA 200
• RSI is above the midpoint
• Presence of a suitable corrective step with normal slope, considering the strength of the previous step
• MACD histogram indicates bullish momentum
• Stochastic shows a bullish crossover from below
Conditions for Entering a Short Trade (Bearish Trigger):
• Candle closes below the pivot line
• Confirm a downtrend by checking that SMA 21 is below SMA 50, and SMA 50 is below SMA 200
• RSI is below the midpoint
• Presence of a suitable corrective step with normal slope, considering the strength of the previous step
• MACD histogram indicates bearish momentum
• Stochastic shows a bearish crossover from above

Six Meridian Divine Swords [theUltimator5]The Six Meridian Divine Sword is a legendary martial arts technique in the classic wuxia novel “Demi-Gods and Semi-Devils” (天龙八部) by Jin Yong (金庸). The technique uses powerful internal energy (qi) to shoot invisible sword-like energy beams from the six meridians of the hand. Each of the six fingers/meridians corresponds to a “sword,” giving six different sword energies.
The Six Meridian Divine Swords indicator is a compact “signal dashboard” that fuses six classic indicators (fingers)—MACD, KDJ, RSI, LWR (Williams %R), BBI, and MTM—into one pane. Each row is a traffic-light dot (green/bullish, red/bearish, gray/neutral). When all six align, the script draws a confirmation line (“All Bullish” or “All Bearish”). It’s designed for quick consensus reads across trend, momentum, and overbought/oversold conditions.
How to Read the Dashboard
The pane has 6 horizontal rows (explained in depth later):
MACD
KDJ
RSI
LWR (Larry Williams %R)
BBI (Bull & Bear Index)
MTM (Momentum)
Each tick in the row is a dot, with sentiment identified by a color.
Green = bullish condition met
Red = bearish condition met
Gray = inside a neutral band (filtering chop), shown when Use Neutral (Gray) Colors is ON
There are two lines that track the dots on the top or bottom of the pane.
All Bullish Signal Line: appears only if all 6 are strongly bullish (default color = white)
All Bearish Signal Line: appears only if all 6 are strongly bearish (default color = fuchsia)
The Six Meridians (Indicators) — What They Mean:
1) MACD — Trend & Momentum
What it is: A trend-following momentum indicator based on the relationship between two moving averages (typically 12-EMA and 26-EMA)
Logic used: Classic MACD line (EMA12−EMA26) vs its 9-EMA signal.
Bullish: MACD > Signal and |MACD−Signal| > Neutral Threshold
Bearish: MACD < Signal and |diff| > threshold
Neutral: |diff| ≤ threshold
Why: Small crosses can whipsaw. The neutral band ignores tiny separations to reduce noise.
Inputs: Fast/Slow/Signal lengths, Neutral Threshold.
2) KDJ — Stochastic with J-line boost
What it is: A variation of the stochastic oscillator popular in Chinese trading systems
Logic used: K = SMA(Stochastic, smooth), D = SMA(K, smooth), J = 3K − 2D.
Bullish: K > D and |K−D| > 2
Bearish: K < D and |K−D| > 2
Neutral: |K−D| ≤ 2
Why: K–D separation filters tiny wiggles; J offers an “extreme” early-warning context in the value label.
Inputs: Length, Smoothing.
3) RSI — Momentum balance (0–100)
What it is: A momentum oscillator measuring speed and magnitude of price changes (0–100)
Logic used: RSI(N).
Bullish: RSI > 50 + Neutral Zone
Bearish: RSI < 50 − Neutral Zone
Neutral: Between those bands
Why: Centerline/adaptive bands (around 50) give a directional bias without relying on fixed 70/30.
Inputs: Length, Neutral Zone (± around 50).
4) LWR (Williams %R) — Overbought/Oversold
What it is: An oscillator similar to stochastic, measuring how close the close is to the high-low range over N periods
Logic used: %R over N bars (0 to −100).
Bullish: %R > −50 + Neutral Zone
Bearish: %R < −50 − Neutral Zone
Neutral: Between those bands
Why: Uses a centered band around −50 instead of only −20/−80, making it act like a directional filter.
Inputs: Length, Neutral Zone (± around −50).
5) BBI (Bull & Bear Index) — Smoothed trend bias
What it is: A composite moving average, essentially the average of several different moving averages (often 3, 6, 12, 24 periods)
Logic used: Average of 4 SMAs (3/6/12/24 by default):
BBI = (MA3 + MA6 + MA12 + MA24) / 4
Bullish: Close > BBI and |Close−BBI| > 0.2% of BBI
Bearish: Close < BBI and |diff| > threshold
Neutral: |diff| ≤ threshold
Why: Multiple MAs blended together reduce single-MA whipsaw. A dynamic 0.2% band ignores tiny drift.
Inputs: 4 lengths (default 3/6/12/24). Threshold is auto-scaled at 0.2% of BBI.
6) MTM (Momentum) — Rate of change in price
What it is: A simple measure of rate of change
Logic used: MTM = Close − Close
Bullish: MTM > 0.5% of Close
Bearish: MTM < −0.5% of Close
Neutral: |MTM| ≤ threshold
Why: A percent-based gate adapts across prices (e.g., $5 vs $500) and mutes insignificant moves.
Inputs: Length. Threshold auto-scaled to 0.5% of current Close.
Display & Inputs You Can Tweak
🎨 Use Neutral (Gray) Colors
ON (default): 3-color mode with clear “no-trade”/“weak” states.
OFF: classic binary (green/red) without neutral filtering.

ALEX - ATR Extensions + ADR + TableALEX - ATR Extensions + ADR + Table
Overview
The ALEX ATR Extensions indicator is a comprehensive volatility and momentum analysis tool that combines Average True Range (ATR), Average Daily Range (ADR), and moving average distance calculations in a single, customizable display. This indicator helps traders assess current price action relative to historical volatility and key moving averages, providing crucial context for risk management and trade planning.
Key Features
Multi-Metric Analysis
- ATR Percentage: Current ATR as a percentage of price for volatility assessment
- ADR Percentage: Average Daily Range as a percentage for typical daily movement
- Low of Day Distance: Distance from current price to daily low
- Moving Average Distance: ATR-normalized distance from 21 and 50 period moving averages
Flexible Moving Average Options
- Configurable MA Types: Choose between EMA or SMA for both 21 and 50 period averages
- Customizable Periods: Adjust moving average lengths to suit your trading style
- Daily Timeframe Data: Uses daily moving averages regardless of chart timeframe
ATR Extension Levels
- Dynamic Price Targets: Calculate extension levels based on ATR multiples from moving averages
- Visual Reference Lines: Optional overlay lines showing ATR extension targets
- Customizable Multipliers: Adjust ATR multipliers for different risk/reward scenarios
Smart Visual Alerts
- Color-Coded Distance Metrics: Automatic color changes based on distance thresholds
- Symbol Plotting: Customizable chart symbols when distance thresholds are exceeded
- Threshold-Based Alerts: Visual cues when price reaches significant ATR distances
Comprehensive Data Table
- Real-Time Metrics: Live updating table with all key measurements
- Customizable Display: Toggle individual metrics on/off based on preference
- Professional Styling: Adjustable colors, fonts, and transparency
How to Use
Volatility Assessment
- High ATR%: Indicates elevated volatility, larger position sizing considerations
- Low ATR%: Suggests compressed volatility, potential for expansion
- ADR% Comparison: Compare current day's range to historical average
Moving Average Analysis
- ATR Distance 21/50: Normalized distance showing how extended price is from key levels
- Positive Values: Price above moving average (bullish positioning)
- Negative Values: Price below moving average (bearish positioning)
- Color Changes: Automatic alerts when reaching threshold levels
Extension Target Planning
- ATR Extension Lines: Visual price targets based on volatility-adjusted projections
- Risk/Reward Planning: Use extension levels for profit target placement
- Breakout Confirmation: Extension levels can confirm breakout validity
Symbol Alert System
- Chart Symbols: Automatic plotting when distance thresholds are breached
- Customizable Triggers: Set your own threshold levels for alerts
- Visual Scanning: Quick identification of extended conditions across multiple charts
Settings
Display Controls
- Show ADR%: Toggle average daily range percentage display
- Show ATR%: Toggle average true range percentage display
- Show LoD Distance: Toggle low of day distance calculation
- Show LoD Price: Toggle actual low of day price display
- Show ATR Distance from 21/50 DMA: Toggle moving average distance metrics
- Show 21/50 DMA Price: Toggle actual moving average price display
- Show ATR Extension Levels: Toggle extension target display in table
Moving Average Configuration
- 21/50 DMA Type: Choose between EMA or SMA calculation methods
- 21/50 DMA Period: Customize moving average lengths
- ADR/ATR Length: Adjust calculation periods for range measurements
Color Thresholds
- Threshold Levels: Set distance levels for color changes (default 2.0 and 5.0)
- Custom Colors: Choose colors for different threshold breaches
- Separate 21/50 Settings: Independent color schemes for each moving average
Symbol Settings
- Show Char Symbol: Toggle symbol plotting for each moving average
- Custom Symbols: Choose any character for chart plotting
- Symbol Colors: Customize colors for visual distinction
- Threshold Levels: Set trigger points for symbol appearance
ATR Extension Lines
- Show Extension Lines: Toggle visual extension level lines
- ATR Multipliers: Customize extension distance (default 2.0x)
- Line Colors: Choose colors for extension level visualization
Table Customization
- Background Color: Adjust table transparency and color
- Text Color: Customize default text appearance
- Font Size: Choose from tiny to huge font options
Advanced Applications
Trend Strength Analysis
- Large ATR distances suggest strong trending moves
- Small ATR distances indicate potential consolidation or reversal zones
- Compare current readings to recent historical ranges
Risk Management
- Use ATR% for position sizing calculations
- Extension levels provide natural profit target zones
- Distance metrics help identify overextended conditions
Multi-Timeframe Context
- Apply to different timeframes for comprehensive analysis
- Daily data provides consistency across all chart intervals
- Combine with weekly/monthly analysis for broader context
Market Regime Identification
- High volatility periods: Increased ATR% readings
- Low volatility periods: Compressed ATR% readings
- Trending markets: Sustained high distance readings
- Consolidating markets: Low distance readings with frequent color changes
Best Practices
Volatility-Adjusted Trading
- Increase position sizes during low volatility periods
- Reduce position sizes during high volatility periods
- Use ATR% for stop-loss placement relative to normal market movement
Extension Level Usage
- Primary targets: 1.5-2.0x ATR extensions
- Secondary targets: 2.5-3.0x ATR extensions
- Avoid chasing prices beyond 3x ATR extensions
Threshold Optimization
- Backtest different threshold levels for your trading style
- Consider market conditions when setting alert levels
- Adjust thresholds based on instrument volatility characteristics
Integration Strategies
- Combine with momentum indicators for confirmation
- Use alongside support/resistance levels
- Incorporate into systematic trading approaches
Technical Specifications
- Compatible with Pine Script v6
- Uses daily timeframe data for consistency
- Optimized for real-time performance
- Works on all chart types and timeframes
- Supports all tradeable instruments
Ideal For
- Swing traders using daily charts
- Position traders seeking volatility context
- Day traders needing intraday reference levels
- Risk managers requiring volatility metrics
- Systematic traders building rule-based strategies
Disclaimer
This indicator is for educational and informational purposes only. It should not be used as the sole basis for trading decisions. Always combine with other forms of analysis, proper risk management techniques, and consider your individual trading plan and risk tolerance. Past performance does not guarantee future results.
Compatible with Pine Script v6 | Optimized for daily timeframe analysis | Works across all markets and instruments

Topological Market Stress (TMS) - Quantum FabricTopological Market Stress (TMS) - Quantum Fabric
What Stresses The Market?
Topological Market Stress (TMS) represents a revolutionary fusion of algebraic topology and quantum field theory applied to financial markets. Unlike traditional indicators that analyze price movements linearly, TMS examines the underlying topological structure of market data—detecting when the very fabric of market relationships begins to tear, warp, or collapse.
Drawing inspiration from the ethereal beauty of quantum field visualizations and the mathematical elegance of topological spaces, this indicator transforms complex mathematical concepts into an intuitive, visually stunning interface that reveals hidden market dynamics invisible to conventional analysis.
Theoretical Foundation: Topology Meets Markets
Topological Holes in Market Structure
In algebraic topology, a "hole" represents a fundamental structural break—a place where the normal connectivity of space fails. In markets, these topological holes manifest as:
Correlation Breakdown: When traditional price-volume relationships collapse
Volatility Clustering Failure: When volatility patterns lose their predictive power
Microstructure Stress: When market efficiency mechanisms begin to fail
The Mathematics of Market Topology
TMS constructs a topological space from market data using three key components:
1. Correlation Topology
ρ(P,V) = correlation(price, volume, period)
Hole Formation = 1 - |ρ(P,V)|
When price and volume decorrelate, topological holes begin forming.
2. Volatility Clustering Topology
σ(t) = volatility at time t
Clustering = correlation(σ(t), σ(t-1), period)
Breakdown = 1 - |Clustering|
Volatility clustering breakdown indicates structural instability.
3. Market Efficiency Topology
Efficiency = |price - EMA(price)| / ATR
Measures how far price deviates from its efficient trajectory.
Multi-Scale Topological Analysis
Markets exist across multiple temporal scales simultaneously. TMS analyzes topology at three distinct scales:
Micro Scale (3-15 periods): Immediate structural changes, market microstructure stress
Meso Scale (10-50 periods): Trend-level topology, medium-term structural shifts
Macro Scale (50-200 periods): Long-term structural topology, regime-level changes
The final stress metric combines all scales:
Combined Stress = 0.3×Micro + 0.4×Meso + 0.3×Macro
How TMS Works
1. Topological Space Construction
Each market moment is embedded in a multi-dimensional topological space where:
- Price efficiency forms one dimension
- Correlation breakdown forms another
- Volatility clustering breakdown forms the third
2. Hole Detection Algorithm
The indicator continuously scans this topological space for:
Hole Formation: When stress exceeds the formation threshold
Hole Persistence: How long structural breaks maintain
Hole Collapse: Sudden topology restoration (regime shifts)
3. Quantum Visualization Engine
The visualization system translates topological mathematics into intuitive quantum field representations:
Stress Waves: Main line showing topological stress intensity
Quantum Glow: Surrounding field indicating stress energy
Fabric Integrity: Background showing structural health
Multi-Scale Rings: Orbital representations of different timeframes
4. Signal Generation
Stable Topology (✨): Normal market structure, standard trading conditions
Stressed Topology (⚡): Increased structural tension, heightened volatility expected
Topological Collapse (🕳️): Major structural break, regime shift in progress
Critical Stress (🌋): Extreme conditions, maximum caution required
Inputs & Parameters
🕳️ Topological Parameters
Analysis Window (20-200, default: 50)
Primary period for topological analysis
20-30: High-frequency scalping, rapid structure detection
50: Balanced approach, recommended for most markets
100-200: Long-term position trading, major structural shifts only
Hole Formation Threshold (0.1-0.9, default: 0.3)
Sensitivity for detecting topological holes
0.1-0.2: Very sensitive, detects minor structural stress
0.3: Balanced, optimal for most market conditions
0.5-0.9: Conservative, only major structural breaks
Density Calculation Radius (0.1-2.0, default: 0.5)
Radius for local density estimation in topological space
0.1-0.3: Fine-grained analysis, sensitive to local changes
0.5: Standard approach, balanced sensitivity
1.0-2.0: Broad analysis, focuses on major structural features
Collapse Detection (0.5-0.95, default: 0.7)
Threshold for detecting sudden topology restoration
0.5-0.6: Very sensitive to regime changes
0.7: Balanced, reliable collapse detection
0.8-0.95: Conservative, only major regime shifts
📊 Multi-Scale Analysis
Enable Multi-Scale (default: true)
- Analyzes topology across multiple timeframes simultaneously
- Provides deeper insight into market structure at different scales
- Essential for understanding cross-timeframe topology interactions
Micro Scale Period (3-15, default: 5)
Fast scale for immediate topology changes
3-5: Ultra-fast, tick/minute data analysis
5-8: Fast, 5m-15m chart optimization
10-15: Medium-fast, 30m-1H chart focus
Meso Scale Period (10-50, default: 20)
Medium scale for trend topology analysis
10-15: Short trend structures
20-25: Medium trend structures (recommended)
30-50: Long trend structures
Macro Scale Period (50-200, default: 100)
Slow scale for structural topology
50-75: Medium-term structural analysis
100: Long-term structure (recommended)
150-200: Very long-term structural patterns
⚙️ Signal Processing
Smoothing Method (SMA/EMA/RMA/WMA, default: EMA) Method for smoothing stress signals
SMA: Simple average, stable but slower
EMA: Exponential, responsive and recommended
RMA: Running average, very smooth
WMA: Weighted average, balanced approach
Smoothing Period (1-10, default: 3)
Period for signal smoothing
1-2: Minimal smoothing, noisy but fast
3-5: Balanced, recommended for most applications
6-10: Heavy smoothing, slow but very stable
Normalization (Fixed/Adaptive/Rolling, default: Adaptive)
Method for normalizing stress values
Fixed: Static 0-1 range normalization
Adaptive: Dynamic range adjustment (recommended)
Rolling: Rolling window normalization
🎨 Quantum Visualization
Fabric Style Options:
Quantum Field: Flowing energy visualization with smooth gradients
Topological Mesh: Mathematical topology with stepped lines
Phase Space: Dynamical systems view with circular markers
Minimal: Clean, simple display with reduced visual elements
Color Scheme Options:
Quantum Gradient: Deep space blue → Quantum red progression
Thermal: Black → Hot orange thermal imaging style
Spectral: Purple → Gold full spectrum colors
Monochrome: Dark gray → Light gray elegant simplicity
Multi-Scale Rings (default: true)
- Display orbital rings for different time scales
- Visualizes how topology changes across timeframes
- Provides immediate visual feedback on cross-scale dynamics
Glow Intensity (0.0-1.0, default: 0.6)
Controls the quantum glow effect intensity
0.0: No glow, pure line display
0.6: Balanced, recommended setting
1.0: Maximum glow, full quantum field effect
📋 Dashboard & Alerts
Show Dashboard (default: true)
Real-time topology status display
Current market state and trading recommendations
Stress level visualization and fabric integrity status
Show Theory Guide (default: true)
Educational panel explaining topological concepts
Dashboard interpretation guide
Trading strategy recommendations
Enable Alerts (default: true)
Extreme stress detection alerts
Topological collapse notifications
Hole formation and recovery signals
Visual Logic & Interpretation
Main Visualization Elements
Quantum Stress Line
Primary indicator showing topological stress intensity
Color intensity reflects current market state
Line style varies based on selected fabric style
Glow effect indicates stress energy field
Equilibrium Line
Silver line showing average stress level
Reference point for normal market conditions
Helps identify when stress is elevated or suppressed
Upper/Lower Bounds
Red upper bound: High stress threshold
Green lower bound: Low stress threshold
Quantum fabric fill between bounds shows stress field
Multi-Scale Rings
Aqua circles : Micro-scale topology (immediate changes)
Orange circles: Meso-scale topology (trend-level changes)
Provides cross-timeframe topology visualization
Dashboard Information
Topology State Icons:
✨ STABLE: Normal market structure, standard trading conditions
⚡ STRESSED: Increased structural tension, monitor closely
🕳️ COLLAPSE: Major structural break, regime shift occurring
🌋 CRITICAL: Extreme conditions, reduce risk exposure
Stress Bar Visualization:
Visual representation of current stress level (0-100%)
Color-coded based on current topology state
Real-time percentage display
Fabric Integrity Dots:
●●●●● Intact: Strong market structure (0-30% stress)
●●●○○ Stressed: Weakening structure (30-70% stress)
●○○○○ Fractured: Breaking down structure (70-100% stress)
Action Recommendations:
✅ TRADE: Normal conditions, standard strategies apply
⚠️ WATCH: Monitor closely, increased vigilance required
🔄 ADAPT: Change strategy, regime shift in progress
🛑 REDUCE: Lower risk exposure, extreme conditions
Trading Strategies
In Stable Topology (✨ STABLE)
- Normal trading conditions apply
- Use standard technical analysis
- Regular position sizing appropriate
- Both trend-following and mean-reversion strategies viable
In Stressed Topology (⚡ STRESSED)
- Increased volatility expected
- Widen stop losses to account for higher volatility
- Reduce position sizes slightly
- Focus on high-probability setups
- Monitor for potential regime change
During Topological Collapse (🕳️ COLLAPSE)
- Major regime shift in progress
- Adapt strategy immediately to new market character
- Consider closing positions that rely on previous regime
- Wait for new topology to stabilize before major trades
- Opportunity for contrarian plays if collapse is extreme
In Critical Stress (🌋 CRITICAL)
- Extreme market conditions
- Significantly reduce risk exposure
- Avoid new positions until stress subsides
- Focus on capital preservation
- Consider hedging existing positions
Advanced Techniques
Multi-Timeframe Topology Analysis
- Use higher timeframe TMS for regime context
- Use lower timeframe TMS for precise entry timing
- Alignment across timeframes = highest probability trades
Topology Divergence Trading
- Most powerful at regime boundaries
- Price makes new high/low but topology stress decreases
- Early warning of potential reversals
- Combine with key support/resistance levels
Stress Persistence Analysis
- Long periods of stable topology often precede major moves
- Extended stress periods often resolve in regime changes
- Use persistence tracking for position sizing decisions
Originality & Innovation
TMS represents a genuine breakthrough in applying advanced mathematics to market analysis:
True Topological Analysis: Not a simplified proxy but actual topological space construction and hole detection using correlation breakdown, volatility clustering analysis, and market efficiency measurement.
Quantum Aesthetic: Transforms complex topology mathematics into an intuitive, visually stunning interface inspired by quantum field theory visualizations.
Multi-Scale Architecture: Simultaneous analysis across micro, meso, and macro timeframes provides unprecedented insight into market structure dynamics.
Regime Detection: Identifies fundamental market character changes before they become obvious in price action, providing early warning of structural shifts.
Practical Application: Clear, actionable signals derived from advanced mathematical concepts, making theoretical topology accessible to practical traders.
This is not a combination of existing indicators or a cosmetic enhancement of standard tools. It represents a fundamental reimagining of how we measure, visualize, and interpret market dynamics through the lens of algebraic topology and quantum field theory.
Best Practices
Start with defaults: Parameters are optimized for broad market applicability
Match timeframe: Adjust scales based on your trading timeframe
Confirm with price action: TMS shows market character, not direction
Respect topology changes: Reduce risk during regime transitions
Use appropriate strategies: Adapt approach based on current topology state
Monitor persistence: Track how long topology states maintain
Cross-timeframe analysis: Align multiple timeframes for highest probability trades
Alerts Available
Extreme Topological Stress: Market fabric under severe deformation
Topological Collapse Detected: Regime shift in progress
Topological Hole Forming: Market structure breakdown detected
Topology Stabilizing: Market structure recovering to normal
Chart Requirements
Recommended Markets: All liquid markets (forex, stocks, crypto, futures)
Optimal Timeframes: 5m to Daily (adaptable to any timeframe)
Minimum History: 200 bars for proper topology construction
Best Performance: Markets with clear regime characteristics
Academic Foundation
This indicator draws from cutting-edge research in:
- Algebraic topology and persistent homology
- Quantum field theory visualization techniques
- Market microstructure analysis
- Multi-scale dynamical systems theory
- Correlation topology and network analysis
Disclaimer
This indicator is for educational and research purposes only. It does not constitute financial advice or provide direct buy/sell signals. Topological analysis reveals market structure characteristics, not future price direction. Always use proper risk management and combine with your own analysis. Past performance does not guarantee future results.
See markets through the lens of topology. Trade the structure, not the noise.
Bringing advanced mathematics to practical trading through quantum-inspired visualization.
Trade with insight. Trade with structure.
— Dskyz , for DAFE Trading Systems
