MACD + RSI/MA Signals with 200 EMA (Overlay)How It’s Built
MACD Line = EMA(12) – EMA(26)
→ Short-term vs. medium-term momentum.
Signal Line = EMA(9) of MACD Line
→ Smooths things out.
Histogram = MACD Line – Signal Line
→ Visual "energy gauge" showing momentum strength.
What It Actually Tells You
Crossover Signals
MACD Line crosses above Signal Line → Bullish shift (momentum turning up).
MACD Line crosses below Signal Line → Bearish shift (momentum turning down).
⚠️ But: crossovers lag price. On their own, they’re late.
Zero Line Relevance
Above Zero → Trend bias is bullish (short-term EMA > long-term EMA).
Below Zero → Trend bias is bearish.
Crosses through zero often align with bigger trend changes.
Histogram Use
Expanding histogram = momentum strengthening.
Shrinking histogram = momentum weakening (trend may be stalling).
Flips from positive to negative (or vice versa) often precede crossovers.
Divergences
Price makes a new high, but MACD doesn’t → momentum is fading → possible reversal.
Same idea for lows.
Where Traders Go Wrong
Using it alone. It’s a confirmation tool, not an entry machine.
Misreading every crossover as a trade. Many are just noise, especially on low timeframes.
Forgetting market context — MACD works best in trending markets, not chop.
Best Way to Use It
With trend structure + support/resistance:
→ E.g., you’re eyeing a BTC bounce long. If MACD histogram turns from negative to positive while price defends support, that’s confirmation, not a blind buy.
For momentum timing:
→ Ride trends longer if histogram stays strong. Scale out when it weakens.
Divergence spotting:
→ Early heads-up that a reversal is brewing.
在腳本中搜尋"工业富联当前技术指标MACD、RSI、布林带数据"

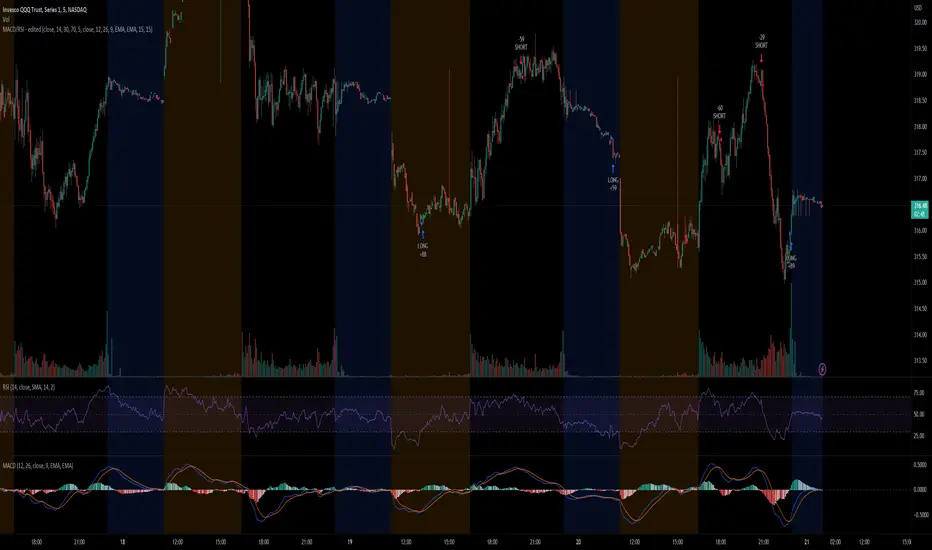
MACD/RSI - editedThis strategy checks MACDcrossover and RSI crossover. When MACD crosses up or down the signal line, it checks if RSI is crossing back OverSold or OverBought lines, respectively, over the past few candles. The period can be changed by the parameter "RSI lookback".
The strategy seems to work better for reversal—still a work in progress.
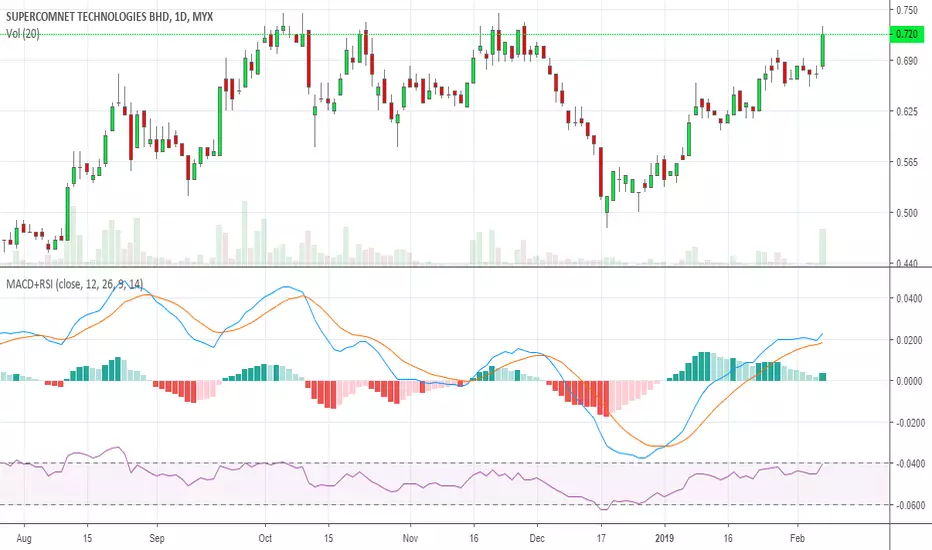
MACD + RSI Robert's VersionCombination of MACD and RSI to see how they work together, its meant for any market and any condition

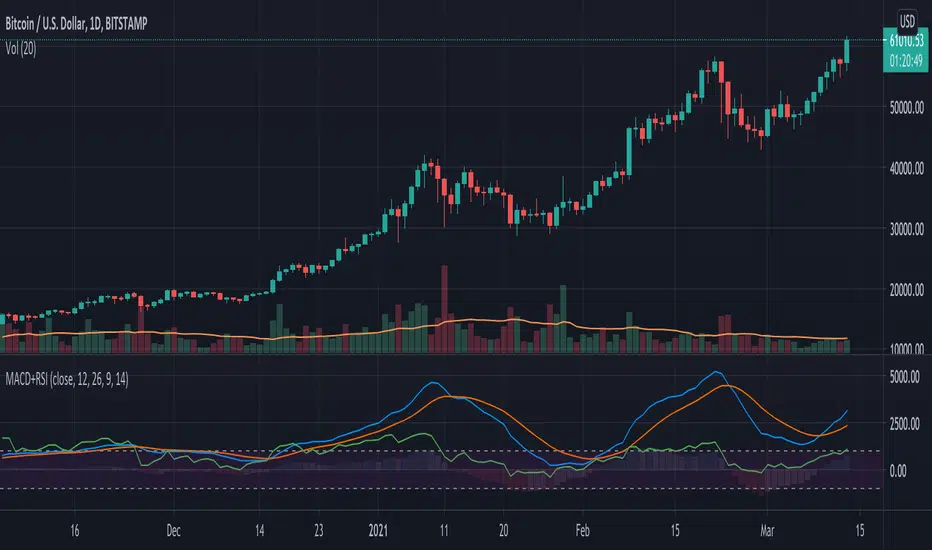
MACD RSI 2021-6-27This combines a trend based setting (MACD) and an oscillator (RSI) into one, creating a little extra room to add something else. Everything is colored based on whether RSI above/below 50. Adjust the parameters to your liking. Of course, this setting works best when used on multiple time frames: Enter on one time frame, take profits on a lower one.

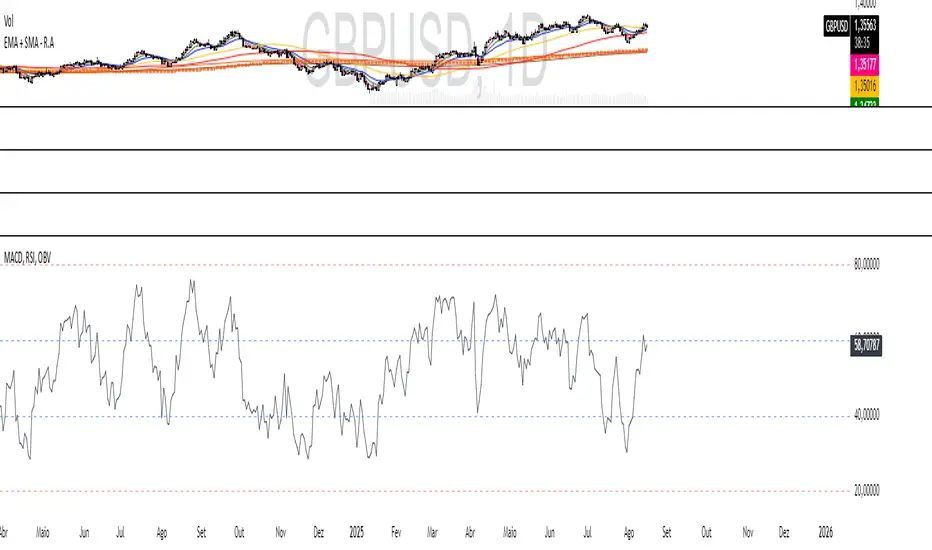
MACD, RSI, OBV - R.A TraderRudá Alves Trader - Custom Indicator
This indicator was developed for the students of Rudá Alves trader. It combines the OBV, RSI, and MACD oscillators into a single tool.
MACD+RSI by NiksMACD and RSI combined in one indicator. This is to allow you to add more than 3 indicators in free version of Trading view

MACD + RSI togetheryou will have both MACD and RSI together in front of each other. best for tile windows or small monitors. enjoy
MACD + RSI + EMA + SMA + Ichimoku + overbought + buy, sell +Doji// MACD + EMA 200 *** buy and sell strategy (RSI, EMA, SMA) *** Doji Harami *** overbought and oversold *** trend direction *** divergence *** Ichimoku
Use this script in time 1h
MACD + RSI TSA simple strategy that use EMAs convergence/divergence and RSI peeks to take position. Fractals are really useful to positioning your stop loss.
It works well on commodities and forex markets.

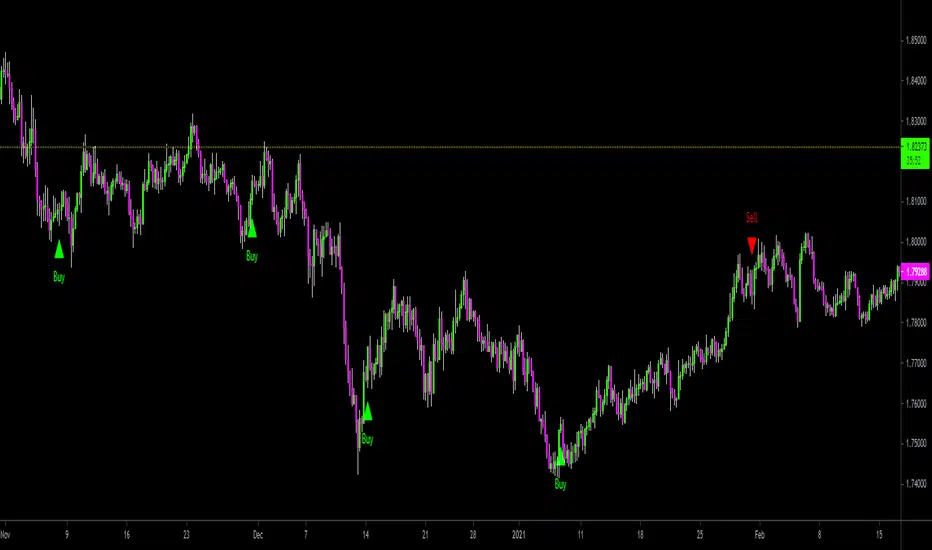
MACD + RSI Signal ArrowsA small green arrow up (↑) when there's a buy signal
A small red arrow down (↓) when there's a sell signal

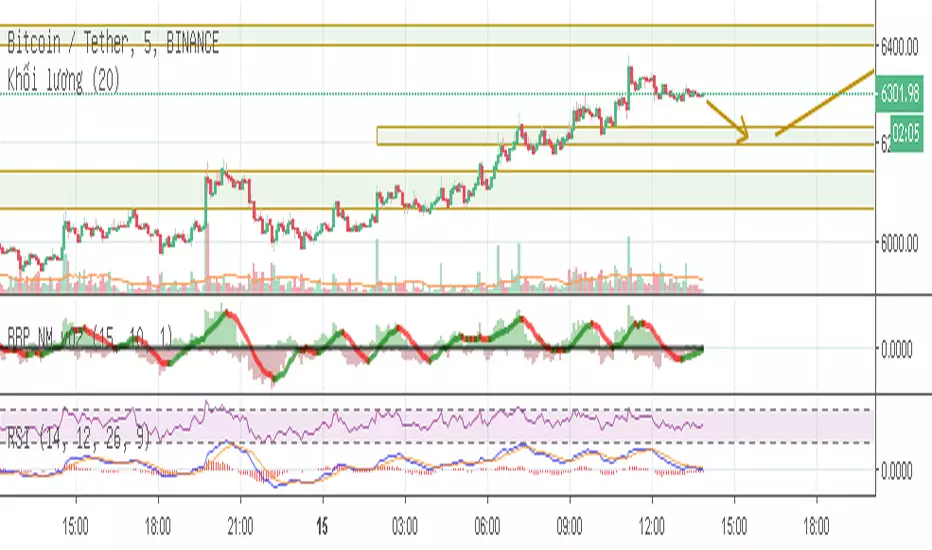
MACD+RSI FerrantelliSe trata de la suma de la línea lenta del indicador MACD mas el RSI. De modo que acentuar el momento en que ambos muestran sobre venta o sobre compra.


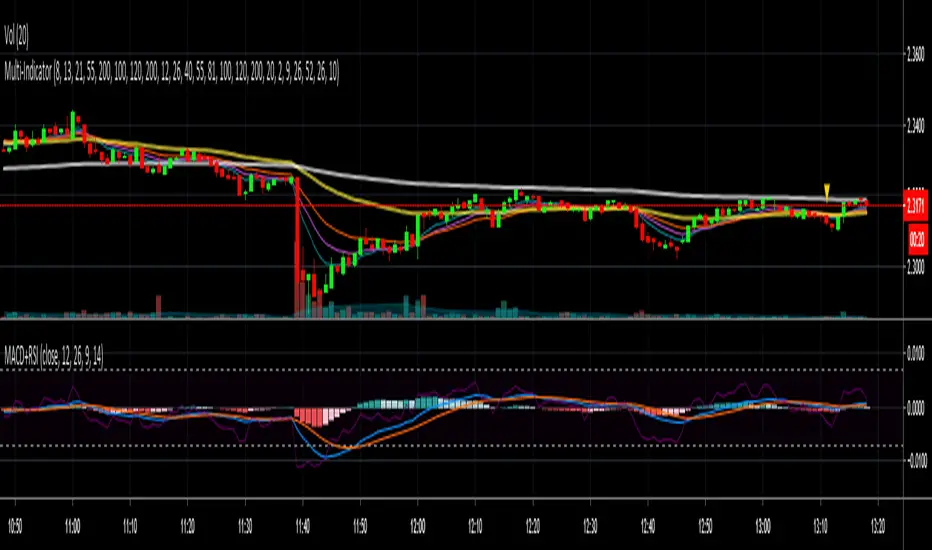
ULTRA LITE: QQE + MACD + 3xEMAQQE+EMA
MACD+RSI+EMA
3xEMA
Although the three are displayed as one indicator on the chart, the display becomes distorted when changing the vertical scale of the chart.”

Market Analysis Assistant This indicator uniquely maps and interprets key market conditions using Moving Averages, MACD, RSI, and Bollinger Bands. Unlike traditional indicators that only display visual signals, this tool provides written analysis directly on your chart as soon as specific conditions are met. This feature makes it easier to understand the market’s current state and anticipate potential moves.
Why Moving Averages? Moving Averages are essential for identifying the overall trend of the market. By analyzing the 200, 20, and 9-period Moving Averages, this indicator helps traders quickly determine whether the market is in an uptrend, downtrend, or sideways phase. The integration of multiple averages offers a comprehensive view, allowing for more accurate trend identification.
Why MACD? The MACD is a powerful tool for spotting trend reversals and momentum shifts. By monitoring MACD crossovers, divergences, and the position of the MACD line relative to the zero line, this indicator helps you identify potential changes in the trend direction before they fully develop, giving you a critical edge.
Why RSI? RSI is crucial for understanding the market's overbought and oversold conditions. By tracking RSI levels and its crossover with its moving average, this indicator provides early warnings for potential trend reversals or continuations, helping you time your entries and exits more effectively.
Why Bollinger Bands? Bollinger Bands are used to measure market volatility and identify breakout opportunities. By analyzing the price’s relationship with the upper and lower bands, this indicator helps traders spot potential overbought or oversold conditions, as well as possible breakout scenarios, offering a clear view of market dynamics.
Trend Identification (getTrend()): Detects whether the market is in an uptrend, downtrend, or sideways phase by analyzing the position of the price relative to the 200, 20, and 9-period moving averages.
MACD Analysis (analyzeMACD()): Identifies potential trend reversals or continuations through MACD divergence, crossovers, and the MACD signal line's position relative to the zero line.
RSI Monitoring (analyzeRSI()): Detects overbought and oversold conditions and anticipates trend continuation or corrections based on RSI crossings with its moving average.
Trap Zone Detection (analyzeTrapZone()): Highlights areas of potential price consolidation between the 20 and 200-period moving averages, indicating possible breakouts.
Bollinger Bands Analysis (analyzeBollingerBands()): Analyzes the price’s relationship with Bollinger Bands to identify overbought/oversold conditions, breakouts, and potential trend continuations or correction.
Fibonacci retracement will also check the moment the price tests a monthly or daily weekly Fibonacci retracement
What Makes This Indicator Unique?
This indicator stands out by transforming complex technical analysis into clear, written insights directly on your chart. As soon as specific conditions are met—such as a MACD crossover or an RSI overbought/oversold level—this tool immediately displays a written summary of the event, helping traders to quickly understand and act on market developments.
How to Use My Indicator:
The indicator is designed to provide detailed, real-time market condition analysis using Moving Averages, MACD, RSI, and Bollinger Bands. When certain market conditions are met, such as the price testing a specific moving average or the MACD indicating a potential reversal, the indicator displays this information in written form directly on the chart, in both English and Portuguese.
How to Interpret the Displayed Information:
The information displayed by the indicator can be used for:
Identifying Support and Resistance: The indicator can help identify when the price is testing an important support or resistance level, such as a moving average or a Fibonacci level, allowing the user to decide whether to enter or exit a position.
Trend Detection: If the indicator shows that the price is above the 200, 20, and 9-period moving averages, this may be a sign of an uptrend, indicating that the user should consider maintaining or opening buy positions.
Correction Signals: When the MACD indicates a potential correction, the user may decide to protect their profits by adjusting stops or even exiting the position to avoid losses.
Identifying Overbought/Oversold Conditions: Based on the RSI, the indicator can alert to overbought or oversold conditions, helping the user avoid entering a trade at an unfavorable time.
Example of Use:
the indicator shows several important pieces of information, such as:
"US100 Price is at the 50.0% Fibonacci level (Last Monthly)."
This suggests that the price is testing a significant Fibonacci level, which could be a point of reversal or continuation. A trader can use this information to adjust their entry or exit strategy.
"DXY RSI below 30: Indication of oversold condition"
This indicates that the DXY is in an oversold condition, which might suggest an upcoming bullish reversal. A trader could consider this when trading DXY-related assets.
"Bullish Trend: Price is above the 200, 20, and 9-period moving averages."
This confirms an uptrend, giving the user more confidence to hold long positions.
Availability:
This indicator is available in two languages: English and Portuguese. It is ideal for traders who prefer analysis in English as well as those who prefer it in Portuguese, making it a versatile and accessible tool for traders from different backgrounds
Este indicador mapeia e interpreta de forma única as principais condições de mercado utilizando Médias Móveis, MACD, RSI e Bandas de Bollinger. Ao contrário dos indicadores tradicionais que apenas exibem sinais visuais, esta ferramenta oferece uma análise escrita diretamente no seu gráfico assim que determinadas condições são atendidas. Isso facilita o entendimento do estado atual do mercado e a antecipação de possíveis movimentos.
Por que Médias Móveis? As Médias Móveis são essenciais para identificar a tendência geral do mercado. Ao analisar as Médias Móveis de 200, 20 e 9 períodos, este indicador ajuda os traders a determinarem rapidamente se o mercado está em tendência de alta, baixa ou em fase lateral. A integração de múltiplas médias oferece uma visão abrangente, permitindo uma identificação mais precisa das tendências.
Por que MACD? O MACD é uma ferramenta poderosa para identificar reversões de tendência e mudanças de momentum. Monitorando os cruzamentos do MACD, divergências e a posição da linha MACD em relação à linha zero, este indicador ajuda você a identificar possíveis mudanças na direção da tendência antes que elas se desenvolvam completamente, dando-lhe uma vantagem crítica.
Por que RSI? O RSI é crucial para entender as condições de sobrecompra e sobrevenda do mercado. Acompanhando os níveis do RSI e seu cruzamento com sua média móvel, este indicador fornece avisos antecipados para possíveis reversões ou continuações de tendência, ajudando você a cronometrar suas entradas e saídas de forma mais eficaz.
Por que Bandas de Bollinger? As Bandas de Bollinger são usadas para medir a volatilidade do mercado e identificar oportunidades de rompimento. Ao analisar a relação do preço com as bandas superior e inferior, este indicador ajuda os traders a identificar condições de sobrecompra ou sobrevenda, bem como possíveis cenários de rompimento, oferecendo uma visão clara da dinâmica do mercado.
Identificação de Tendências (getTrend()): Detecta se o mercado está em tendência de alta, baixa ou em fase lateral, analisando a posição do preço em relação às médias móveis de 200, 20 e 9 períodos.
Análise de MACD (analyzeMACD()): Identifica possíveis reversões ou continuações de tendência através de divergências do MACD, cruzamentos, e a posição da linha de sinal do MACD em relação à linha zero.
Monitoramento do RSI (analyzeRSI()): Detecta condições de sobrecompra e sobrevenda e antecipa a continuação da tendência ou correções com base nos cruzamentos do RSI com sua média móvel.
Detecção de Zona de Armadilha (analyzeTrapZone()): Destaca áreas de possível consolidação de preços entre as médias móveis de 20 e 200 períodos, indicando possíveis rompimentos.
Análise das Bandas de Bollinger (analyzeBollingerBands()): Analisa a relação do preço com as Bandas de Bollinger para identificar condições de sobrecompra/sobrevenda, rompimentos e possíveis continuações de tendência ou correção.
A retração de Fibonacci também verificará o momento em que o preço testa uma retração de Fibonacci semanal mensal ou diária
O que Torna Este Indicador Único?
Este indicador se destaca por transformar análises técnicas complexas em insights escritos claros diretamente no seu gráfico. Assim que condições específicas são atendidas—como um cruzamento do MACD ou um nível de sobrecompra/sobrevenda do RSI—esta ferramenta exibe imediatamente um resumo escrito do evento, ajudando os traders a entenderem e agirem rapidamente sobre as mudanças do mercado.
Como Utilizar o Meu Indicador:
O indicador foi desenvolvido para oferecer uma análise detalhada e em tempo real das condições de mercado, utilizando os conceitos de Médias Móveis, MACD, RSI e Bandas de Bollinger. Quando certas condições de mercado são atingidas, como o preço testando uma média móvel específica ou o MACD indicando uma possível reversão, o indicador exibe essas informações de forma escrita diretamente no gráfico, em inglês e português.
Como Interpretar as Informações Exibidas:
As informações exibidas pelo indicador podem ser usadas para:
Identificação de Suportes e Resistências: O indicador pode ajudar a identificar quando o preço está testando um nível de suporte ou resistência importante, como uma média móvel ou um nível de Fibonacci, permitindo ao usuário decidir se deve entrar ou sair de uma posição.
Detecção de Tendências: Se o indicador mostra que o preço está acima das médias móveis de 200, 20 e 9 períodos, isso pode ser um sinal de uma tendência de alta, indicando que o usuário deve considerar manter ou abrir posições de compra.
Sinais de Correção: Quando o MACD indica uma possível correção, o usuário pode decidir proteger seus lucros ajustando os stops ou até mesmo saindo da posição para evitar perdas.
Identificação de Condições de Sobrecompra/Sobrevenda: Com base no RSI, o indicador pode alertar sobre condições de sobrecompra ou sobrevenda, ajudando o usuário a evitar entrar em uma operação em um momento desfavorável.
Exemplo de Utilização:
o indicador mostra várias informações importantes, como:
"O preço do US100 está no nível de Fibonacci de 50,0% (mês passado)."
Isso sugere que o preço está testando um nível significativo de Fibonacci, o que pode ser um ponto de reversão ou continuação. Um trader pode usar essa informação para ajustar sua estratégia de entrada ou saída.
DXY RSI abaixo de 30: Indicação de condição de sobrevenda"
Isso indica que o DXY está em uma condição de sobrevenda, o que pode sugerir uma reversão de alta em breve. Um trader pode considerar isso ao fazer operações relacionadas ao DXY.
"Tendência de alta: o preço está acima das médias móveis de 200, 20 e 9 períodos."
Isso confirma uma tendência de alta, dando ao usuário mais confiança para manter posições longas.
Disponibilidade:
Este indicador está disponível em dois idiomas: inglês e português. Ele é ideal tanto para traders que preferem análises em inglês quanto para aqueles que preferem em português. Isso o torna uma ferramenta versátil e acessível para traders de diferentes origens.

Normalized MACD with RSI & Stoch RSI + SignalsNormalized MACD with RSI & Stoch RSI Indicator
Overview:
This indicator combines three popular momentum indicators (MACD, RSI, and Stochastic RSI) into a single cohesive, normalized view, making it easier for traders to interpret market momentum and potential buy/sell signals. It specifically addresses an important issue—the different scale ranges of indicators—by normalizing MACD values to match the 0–100 scale of RSI and Stochastic RSI.
Here’s a clear and concise description of your updated Pine Script indicator:
⸻
Normalized MACD with RSI & Stoch RSI Indicator
Overview:
This indicator combines three popular momentum indicators (MACD, RSI, and Stochastic RSI) into a single cohesive, normalized view, making it easier for traders to interpret market momentum and potential buy/sell signals. It specifically addresses an important issue—the different scale ranges of indicators—by normalizing MACD values to match the 0–100 scale of RSI and Stochastic RSI.
⸻
Key Components:
① MACD (Normalized):
• The Moving Average Convergence Divergence (MACD) originally has an unlimited numerical range.
• Normalization Method:
• Uses a custom tanh(x) function implemented directly in Pine Script:
\tanh(x) = \frac{e^{x}-e^{-x}}{e^{x}+e^{-x}}
• MACD values are scaled using this method to a range of 0–100, with the neutral line at exactly 50.
• Interpretation:
• Values above 50 indicate bullish momentum.
• Values below 50 indicate bearish momentum.
② RSI (Relative Strength Index):
• Measures market momentum on a 0–100 scale.
• Traditional RSI interpretation:
• Overbought conditions: RSI > 70–80.
• Oversold conditions: RSI < 30–20.
③ Stochastic RSI:
• Combines RSI and Stochastic Oscillator to give short-term, highly sensitive signals.
• Helps identify immediate market extremes:
• Above 80 → Short-term overbought.
• Below 20 → Short-term oversold.
⸻
How the Indicator Works:
• Visualization:
• All three indicators (Normalized MACD, RSI, Stochastic RSI) share the same 0–100 scale.
• Clear visual lines and reference levels:
• Midline at 50 indicates neutral momentum.
• Dashed lines at 20 and 80 clearly mark oversold/overbought zones.
• Trading Signals (Recommended approach):
• Bullish Signal (Potential Buy):
• Normalized MACD crosses above 50.
• RSI below or approaching oversold zone (below 30–20).
• Stochastic RSI below 20, indicating short-term oversold conditions.
• Bearish Signal (Potential Sell):
• Normalized MACD crosses below 50.
• RSI above or approaching overbought zone (above 70–80).
• Stochastic RSI above 80, indicating short-term overbought conditions.
⸻
Why Use This Indicator?
• Harmonized Signals:
Normalization of MACD significantly improves clarity and comparability with RSI and Stochastic RSI, providing a unified momentum picture.
• Intuitive Analysis:
Traders can rapidly and intuitively identify momentum shifts without needing multiple indicator windows.
• Improved Decision-Making:
Clear visual references and signals help reduce subjective interpretation, potentially improving trading outcomes.
⸻
Suggested Usage:
• Combine with traditional support

BecakFloatingPanelsLibrary "BecakFloatingPanels"
Library for creating floating indicator panels with MACD, RSI, and Stochastic indicators
calculateMacd(source, fastLength, slowLength, signalLength)
Calculate MACD components
Parameters:
source (float) : Price source for calculation
fastLength (simple int) : Fast EMA period
slowLength (simple int) : Slow EMA period
signalLength (simple int) : Signal line period
Returns: MacdData MACD calculation results
calculateRsi(source, length)
Calculate RSI
Parameters:
source (float) : Price source for calculation
length (simple int) : RSI period
Returns: float RSI value
calculateStochastic(source, high, low, kLength, kSmoothing, dSmoothing)
Calculate Stochastic components
Parameters:
source (float) : Price source for calculation
high (float) : High prices
low (float) : Low prices
kLength (int) : %K period
kSmoothing (int) : %K smoothing period
dSmoothing (int) : %D smoothing period
Returns: StochData Stochastic calculation results
calculateStochSignals(stochK, stochD, overboughtLevel, oversoldLevel)
Calculate Stochastic signals
Parameters:
stochK (float) : Stochastic %K series
stochD (float) : Stochastic %D series
overboughtLevel (float) : Overbought threshold
oversoldLevel (float) : Oversold threshold
Returns: StochSignals Signal flags
calculateChartMetrics(high, low, lookbackLength)
Calculate chart range and positioning metrics
Parameters:
high (float) : High prices
low (float) : Low prices
lookbackLength (int) : Lookback period
Returns: ChartMetrics Chart positioning data
calculateMacdRange(macdLine, signalLine, histogram, safeLookback)
Calculate MACD range for normalization
Parameters:
macdLine (float) : MACD line series
signalLine (float) : Signal line series
histogram (float) : Histogram series
safeLookback (int) : Lookback period
Returns: MacdRange MACD range metrics
initVisualArrays()
Initialize visual arrays
Returns: VisualArrays Container with initialized arrays
clearVisuals(visuals)
Clear all visual elements
Parameters:
visuals (VisualArrays) : VisualArrays container
Returns: void
calculatePanelPositions(chartMetrics, oscPlacement, panelHeight, panelSpacing, centerOffset)
Calculate panel positions based on placement option
Parameters:
chartMetrics (ChartMetrics) : Chart metrics object
oscPlacement (string) : Panel placement option
panelHeight (float) : Panel height percentage
panelSpacing (float) : Panel spacing percentage
centerOffset (float) : Center offset percentage
Returns: PanelPositions Panel boundary coordinates
createPanelBackgrounds(visuals, positions, panelLeft, panelRight, showBackground, transparency)
Create panel backgrounds
Parameters:
visuals (VisualArrays) : VisualArrays container
positions (PanelPositions) : PanelPositions object
panelLeft (int) : Left boundary
panelRight (int) : Right boundary
showBackground (bool) : Show background flag
transparency (int) : Background transparency
Returns: void
drawReferenceLines(visuals, positions, chartMetrics, macdRange, dataLeft, dataRight, panelHeight, rsiOverbought, rsiOversold, stochOverbought, stochOversold)
Draw reference lines for all panels
Parameters:
visuals (VisualArrays) : VisualArrays container
positions (PanelPositions) : PanelPositions object
chartMetrics (ChartMetrics) : ChartMetrics object
macdRange (MacdRange) : MacdRange object
dataLeft (int) : Left data boundary
dataRight (int) : Right data boundary
panelHeight (float) : Panel height percentage
rsiOverbought (int) : RSI overbought level
rsiOversold (int) : RSI oversold level
stochOverbought (int) : Stochastic overbought level
stochOversold (int) : Stochastic oversold level
Returns: void
drawMacdIndicator(visuals, macdLine, signalLine, histogram, macdRange, positions, chartMetrics, barIndex, nextBarIndex, barIndexOffset, panelHeight)
Draw MACD indicator
Parameters:
visuals (VisualArrays) : VisualArrays container
macdLine (float) : MACD line series
signalLine (float) : Signal line series
histogram (float) : Histogram series
macdRange (MacdRange) : MacdRange object
positions (PanelPositions) : PanelPositions object
chartMetrics (ChartMetrics) : ChartMetrics object
barIndex (int) : Current bar index
nextBarIndex (int) : Next bar index
barIndexOffset (int) : Horizontal offset
panelHeight (float) : Panel height percentage
Returns: void
drawRsiIndicator(visuals, rsiValue, positions, chartMetrics, barIndex, nextBarIndex, barIndexOffset, panelHeight)
Draw RSI indicator
Parameters:
visuals (VisualArrays) : VisualArrays container
rsiValue (float) : RSI value
positions (PanelPositions) : PanelPositions object
chartMetrics (ChartMetrics) : ChartMetrics object
barIndex (int) : Current bar index
nextBarIndex (int) : Next bar index
barIndexOffset (int) : Horizontal offset
panelHeight (float) : Panel height percentage
Returns: void
drawStochasticIndicator(visuals, stochK, stochD, positions, chartMetrics, barIndex, nextBarIndex, barIndexOffset, panelHeight, stochOverbought, stochOversold)
Draw Stochastic indicator
Parameters:
visuals (VisualArrays) : VisualArrays container
stochK (float) : Stochastic %K series
stochD (float) : Stochastic %D series
positions (PanelPositions) : PanelPositions object
chartMetrics (ChartMetrics) : ChartMetrics object
barIndex (int) : Current bar index
nextBarIndex (int) : Next bar index
barIndexOffset (int) : Horizontal offset
panelHeight (float) : Panel height percentage
stochOverbought (int) : Overbought level
stochOversold (int) : Oversold level
Returns: void
addStochasticSignals(visuals, buySignal, sellSignal, positions, chartMetrics, currentBarIndex, barIndexOffset, panelHeight, signalIndex)
Add Stochastic buy/sell signals
Parameters:
visuals (VisualArrays) : VisualArrays container
buySignal (bool) : Buy signal series
sellSignal (bool) : Sell signal series
positions (PanelPositions) : PanelPositions object
chartMetrics (ChartMetrics) : ChartMetrics object
currentBarIndex (int) : Current bar index
barIndexOffset (int) : Horizontal offset
panelHeight (float) : Panel height percentage
signalIndex (int) : Signal index for lookback
Returns: void
setPanelLabels(macdLabel, rsiLabel, stochLabel, positions, chartMetrics, labelOffset, panelHeight, barIndexOffset)
Set panel title labels
Parameters:
macdLabel (label) : MACD label reference
rsiLabel (label) : RSI label reference
stochLabel (label) : Stochastic label reference
positions (PanelPositions) : PanelPositions object
chartMetrics (ChartMetrics) : ChartMetrics object
labelOffset (int) : Label horizontal offset
panelHeight (float) : Panel height percentage
barIndexOffset (int) : Horizontal offset
Returns: void
showDebugInfo(chartMetrics, debugMode)
Display debug information
Parameters:
chartMetrics (ChartMetrics) : ChartMetrics object
debugMode (bool) : Debug mode flag
Returns: void
ChartMetrics
Chart metrics container
Fields:
visibleHigh (series float) : Highest visible price
visibleLow (series float) : Lowest visible price
chartRange (series float) : Price range of chart
chartCenter (series float) : Center point of chart
MacdData
MACD calculation results
Fields:
macdLine (series float) : Main MACD line
signalLine (series float) : Signal line
histogram (series float) : MACD histogram
MacdRange
MACD range metrics for normalization
Fields:
highest (series float) : Highest MACD value
lowest (series float) : Lowest MACD value
BRange (series float) : Total range
StochData
Stochastic calculation results
Fields:
k_smooth (series float) : Smoothed %K line
d (series float) : %D line
StochSignals
Stochastic signals
Fields:
buySignal (series bool) : Buy signal flag
sellSignal (series bool) : Sell signal flag
PanelPositions
Panel positioning data
Fields:
macdTop (series float) : MACD panel top
macdBottom (series float) : MACD panel bottom
rsiTop (series float) : RSI panel top
rsiBottom (series float) : RSI panel bottom
stochTop (series float) : Stochastic panel top
stochBottom (series float) : Stochastic panel bottom
VisualArrays
Visual elements arrays container
Fields:
macdLines (array) : Array of MACD lines
macdHist (array) : Array of MACD histogram boxes
rsiLines (array) : Array of RSI lines
stochLines (array) : Array of Stochastic lines
stochAreas (array) : Array of Stochastic areas
stochSignals (array) : Array of Stochastic signals
panelBackgrounds (array) : Array of panel backgrounds

Green*DiamondGreen*Diamond (GD1)
Unleash Dynamic Trading Signals with Volatility and Momentum
Overview
GreenDiamond is a versatile overlay indicator designed for traders seeking actionable buy and sell signals across various markets and timeframes. Combining Volatility Bands (VB) bands, Consolidation Detection, MACD, RSI, and a unique Ribbon Wave, it highlights high-probability setups while filtering out noise. With customizable signals like Green-Yellow Buy, Pullback Sell, and Inverse Pullback Buy, plus vibrant candle and volume visuals, GreenDiamond adapts to your trading style—whether you’re scalping, day trading, or swing trading.
Key Features
Volatility Bands (VB): Plots dynamic upper and lower bands to identify breakouts or reversals, with toggleable buy/sell signals outside consolidation zones.
Consolidation Detection: Marks low-range periods to avoid choppy markets, ensuring signals fire during trending conditions.
MACD Signals: Offers flexible buy/sell conditions (e.g., cross above signal, above zero, histogram up) with RSI divergence integration for precision.
RSI Filter: Enhances signals with customizable levels (midline, oversold/overbought) and bullish divergence detection.
Ribbon Wave: Visualizes trend strength using three EMAs, colored by MACD and RSI for intuitive momentum cues.
Custom Signals: Includes Green-Yellow Buy, Pullback Sell, and Inverse Pullback Buy, with limits on consecutive signals to prevent overtrading.
Candle & Volume Styling: Blends MACD/RSI colors on candles and scales volume bars to highlight momentum spikes.
Alerts: Set up alerts for VB signals, MACD crosses, Green*Diamond signals, and custom conditions to stay on top of opportunities.
How It Works
Green*Diamond integrates multiple indicators to generate signals:
Volatility Bands: Calculates bands using a pivot SMA and standard deviation. Buy signals trigger on crossovers above the lower band, sell signals on crossunders below the upper band (if enabled).
Consolidation Filter: Suppresses signals when candle ranges are below a threshold, keeping you out of flat markets.
MACD & RSI: Combines MACD conditions (e.g., cross above signal) with RSI filters (e.g., above midline) and optional volume spikes for robust signals.
Custom Logic: Green-Yellow Buy uses MACD bullishness, Pullback Sell targets retracements, and Inverse Pullback Buy catches reversals after downmoves—all filtered to avoid consolidation.
Visuals: Ribbon Wave shows trend direction, candles blend momentum colors, and volume bars scale dynamically to confirm signals.
Settings
Volatility Bands Settings:
VB Lookback Period (20): Adjust to 10–15 for faster markets (e.g., 1-minute scalping) or 25–30 for daily charts.
Upper/Lower Band Multiplier (1.0): Increase to 1.5–2.0 for wider bands in volatile stocks like AEHL; decrease to 0.5 for calmer markets.
Show Volatility Bands: Toggle off to reduce chart clutter.
Use VB Signals: Enable for breakout-focused trades; disable to focus on Green*Diamond signals.
Consolidation Settings:
Consolidation Lookback (14): Set to 5–10 for small caps (e.g., AEHL) to catch quick consolidations; 20 for higher timeframes.
Range Threshold (0.5): Lower to 0.3 for stricter filtering in choppy markets; raise to 0.7 for looser signals.
MACD Settings:
Fast/Slow Length (12/26): Shorten to 8/21 for scalping; extend to 15/34 for swing trading.
Signal Smoothing (9): Reduce to 5 for faster signals; increase to 12 for smoother trends.
Buy/Sell Signal Options: Choose “Cross Above Signal” for classic MACD; “Histogram Up” for momentum plays.
Use RSI Div + MACD Cross: Enable for high-probability reversal signals.
RSI Settings:
RSI Period (14): Drop to 10 for 1-minute charts; raise to 20 for daily.
Filter Level (50): Set to 55 for stricter buys; 45 for sells.
Overbought/Oversold (70/30): Tighten to 65/35 for small caps; widen to 75/25 for indices.
RSI Buy/Sell Options: Select “Bullish Divergence” for reversals; “Cross Above Oversold” for momentum.
Color Settings:
Adjust bullish/bearish colors for visibility (e.g., brighter green/red for dark themes).
Border Thickness (1): Increase to 2–3 for clearer candle outlines.
Volume Settings:
Volume Average Length (20): Shorten to 10 for scalping; extend to 30 for swing trades.
Volume Multiplier (2.0): Raise to 3.0 for AEHL’s volume surges; lower to 1.5 for steady stocks.
Bar Height (10%): Increase to 15% for prominent bars; decrease to 5% to reduce clutter.
Ribbon Settings:
EMA Periods (10/20/30): Tighten to 5/10/15 for scalping; widen to 20/40/60 for trends.
Color by MACD/RSI: Disable for simpler visuals; enable for dynamic momentum cues.
Gradient Fill: Toggle on for trend clarity; off for minimalism.
Custom Signals:
Enable Green-Yellow Buy: Use for momentum confirmation; limit to 1–2 signals to avoid spam.
Pullback/Inverse Pullback % (50): Set to 30–40% for small caps; 60–70% for indices.
Max Buy Signals (1): Increase to 2–3 for active markets; keep at 1 for discipline.
Tips and Tricks
Scalping Small Caps (e.g., AEHL):
Use 1-minute charts with VB Lookback = 10, Consolidation Lookback = 5, and Volume Multiplier = 3.0 to catch $0.10–$0.20 moves.
Enable Green-Yellow Buy and Inverse Pullback Buy for quick entries; disable VB Signals to focus on Green*Diamond logic.
Pair with SMC+ green boxes (if you use them) for reversal confirmation.
Day Trading:
Try 5-minute charts with MACD Fast/Slow = 8/21 and RSI Period = 10.
Enable RSI Divergence + MACD Cross for high-probability setups; set Max Buy Signals = 2.
Watch for volume bars turning yellow to confirm entries.
Swing Trading:
Use daily charts with VB Lookback = 30, Ribbon EMAs = 20/40/60.
Enable Pullback Sell (60%) to exit after rallies; disable RSI Color for cleaner candles.
Check Ribbon Wave gradient for trend strength—bright green signals strong bulls.
Avoiding Noise:
Increase Consolidation Threshold to 0.7 on volatile days to skip false breakouts.
Disable Ribbon Wave or Volume Bars if the chart feels crowded.
Limit Max Buy Signals to 1 for disciplined trading.
Alert Setup:
In TradingView’s Alerts panel, select:
“GD Buy Signal” for standard entries.
“RSI Div + MACD Cross Buy” for reversals.
“VB Buy Signal” for breakout plays.
Set to “Once Per Bar Close” for confirmed signals; “Once Per Bar” for scalping.
Backtesting:
Replay on small caps ( Float < 5M, Price $0.50–$5) to test signals.
Focus on “GD Buy Signal” with yellow volume bars and green Ribbon Wave.
Avoid signals during gray consolidation squares unless paired with RSI Divergence.
Usage Notes
Markets: Works on stocks, forex, crypto, and indices. Best for volatile assets (e.g., small-cap stocks, BTCUSD).
Timeframes: Scalping (1–5 minutes), day trading (15–60 minutes), or swing trading (daily). Adjust settings per timeframe.
Risk Management: Combine with stop-losses (e.g., 1% risk, $0.05 below AEHL entry) and take-profits (3–5%).
Customization: Tweak inputs to match your strategy—experiment in replay to find your sweet spot.
Disclaimer
Green*Diamond is a technical tool to assist with trade identification, not a guarantee of profits. Trading involves risks, and past performance doesn’t predict future results. Always conduct your own analysis, manage risk, and test settings before live trading.
Feedback
Love Green*Diamond? Found a killer setup?
