SPY 4 Hour Swing TraderThe purpose of this script is to spot 4 hour pivots that indicate ~30 trading day swings. As VIX starts to drop options trading will get more boring and as we get back on the bull and can benefit from swing trading strategy. Swing trading doesn't make a whole lot of sense when VIX is above 28. Seems to get best results on 4 hour chart for this one. This indicator spots a go long opportunity when the 5 ema crosses the 13 ema on the 4 hour along with the RSI > 50 and the ADX > 20 and Stoichastic values (smoothed line < 80 or line < 90) and close > last candle close and the True Range < 6. It also spots uses a couple different means to determine when to exit the trade. Sell condition is primarily when the 13 ema crosses the 5 ema and the MACD line crosses below the signal line and the smoothed Stoichastic appears oversold (greater than 60) and slop of RSI < -.2. Stop Losses and Take Profits are configurable in Inputs along with ability to include short trades plus other MACD and Stoichastic settings. If a stop loss is encountered the trade will close. Also once twice the expected move is encountered partial profits will taken and stop losses and take profits will be re-established based on most recent close. Also a VIX above 28 will trigger any open positions to close. If trying to use this for something other than SPXL it is best to update stop losses and take profit percentages and check backtest results to ensure proper levels have been selected and the script gives satisfactory results.
在腳本中搜尋"市值60亿的股票"

SPY 1 Hour Swing TraderThe purpose of this script is to spot 1 hour pivots that indicate ~5 to 6 trading day swings. Results indicate that swings are held approximately 5 to 6 trading days on average, over the last 6 years. This indicator spots a go long opportunity when the 5 ema crosses the 13 ema on the 1 hour along with the RSI > 50. It also spots uses a couple different means to determine when to exit the trade. Sell condition is primarily when the 13 ema crosses the 5 ema and the MACD line crosses below the signal line and the smoothed Stoichastic appears oversold (greater than 60). Stop Losses and Take Profits are configurable in Inputs along with ability to include short trades plus other MACD and Stoichastic settings. If a stop loss is encountered the trade will close. Also once twice the expected move is encountered partial profits will taken and stop losses and take profits will be re-established based on most recent close. Once long trades are exited, short trades will be initiated if recent conditions appeared oversold and input option for short trading is enabled. If trying to use this for something other than SPXL it is best to update stop losses and take profit percentages and check backtest results to ensure proper levels have been selected and the script gives satisfactory results.

Volume Profile Fixed Range Support and Resistance LevelsThis script is based on the excellent Volume Profile / Fixed Range indicator by @LonesomeTheBlue, so all credit for the foundations of this indicator goes to @LonesomeTheBlue
I basically made 5 instances of the original script and added horizontal lines at the beginning and end of the each Value Area. To use the script as a support and resistance tool without the Value Areas and Point of Control (POC) labels you just need to untick "Boxes" and "Labels" in the "Style" section of the “Settings”.
The default look-back periods (in bars) are 7, 30, 60, 180 and 365, but you can change this or the colour of the lines easily in the “Settings”.
The dashed lines are the respective POC.
I find this tool to be very useful for quickly identifying interest levels on any chart while also ensuring a certain amount of objectivity in your TA.
Hope you find it useful and thanks again to @LonesomeTheBlue for going through the trouble of coding this and being so generous to share it with the rest of us!
Good luck out there!

Regression Channel Alternative MTF V2█ OVERVIEW
This indicator is a predecessor to Regression Channel Alternative MTF , which is coded based on latest update of type, object and method.
█ IMPORTANT NOTES
This indicator is NOT true Multi Timeframe (MTF) but considered as Alternative MTF which calculate 100 bars for Primary MTF, can be refer from provided line helper.
The timeframe scenarios are defined based on Position, Swing and Intraday Trader.
Suppported Timeframe : W, D, 60, 15, 5 and 1.
Channel drawn based on regression calculation.
Angle channel is NOT supported.
█ INSPIRATIONS
These timeframe scenarios are defined based on Harmonic Trading : Volume Three written by Scott M Carney.
By applying channel on each timeframe, MW or ABCD patterns can be easily identified manually.
This can also be applied on other chart patterns.
█ CREDITS
Scott M Carney, Harmonic Trading : Volume Three (Reaction vs. Reversal)
█ TIMEFRAME EXPLAINED
Higher / Distal : The (next) longer or larger comparative timeframe after primary pattern has been identified.
Primary / Clear : Timeframe that possess the clearest pattern structure.
Lower / Proximate : The (next) shorter timeframe after primary pattern has been identified.
Lowest : Check primary timeframe as main reference.
█ FEATURES
Color is determined by trend or timeframe.
Some color is depends on chart contrast color.
Color is determined by trend or timeframe.
█ EXAMPLE OF USAGE / EXPLAINATION

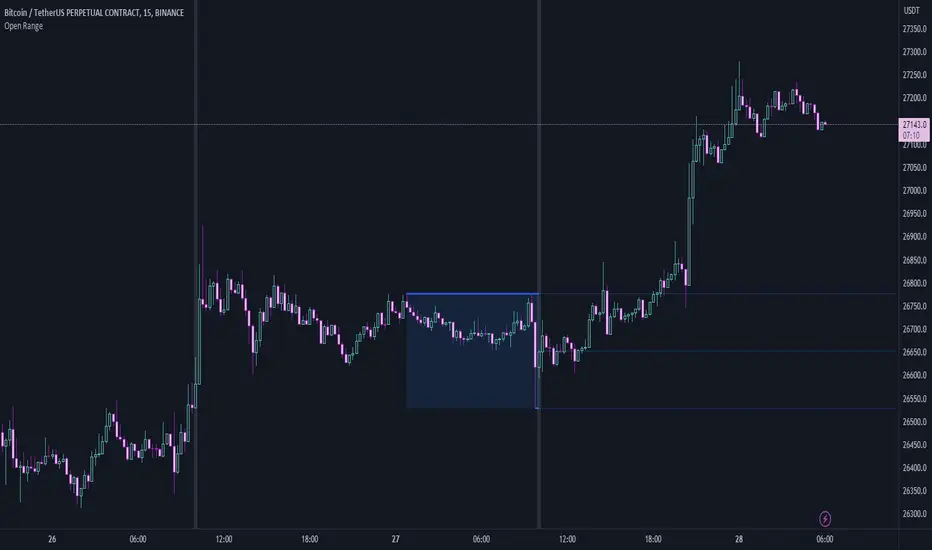
Open RangeThis is a simple script that will look back a set number of candles at a specified time (example: Ny Open) and find the "High and Low " of the range/ market in the given look back period. It will then draw two lines and the range zone as a box. Breakout traders can use these levels to help find interesting areas for a breakout. Reversal traders can use these levels to help locate false breakouts.
Simple type in your time zone Example: GMT-4
Set the time you want the indicator to draw the start line Example: 8:30am
then set the candle look back Example: 60
Hope this script helps spark some ideas
Happy trading
God's Little FingerThe "God's Little Finger" indicator uses several technical analysis tools to provide information about the direction of the market and generate buy/sell signals. These tools include a 200-period exponential moving average (EMA), Moving Average Convergence Divergence (MACD), Bollinger Bands, and the Relative Strength Index (RSI).
EMA is used to determine if prices are trending. MACD measures the speed and momentum of the trend. Bollinger Bands are used to determine if prices are staying within a range and to measure the strength of the trend. RSI shows overbought/oversold levels and can be used to determine if the trend will continue.
The indicator generates buy/sell signals based on market conditions. A buy signal is generated when the MACD line is below zero, the price is below the lower boundary of the Bollinger Bands, the price is above the 200-period EMA, and the RSI is in oversold levels (usually below 40). A sell signal is generated when the MACD line is above zero, the price is above the upper boundary of the Bollinger Bands, the price is below the 200-period EMA, and the RSI is in overbought levels (usually above 60).
However, it should be noted that indicators can be used to predict market conditions, but they do not guarantee results and any changes or unexpected events in the market can affect predictions. Therefore, they should always be used in conjunction with other analysis methods and risk management strategies.

Momentum PlayTraders always need a confirmation of momentum in price action to ride the swings.
Momentum Play Indicator consists of the below:
Bullish Conditions :
1)EMA 8 above EMA 34 and rising
2)Candle close above 5 candle high
3) RSI above 60
4) Volume above 5 candles avg. volume
5) ADX above 20
Bearish Conditions :
1)EMA 8 below EMA 34 and falling
2)Candle close below 5 candle low
3) RSI below 40
4) Volume above 5 candles avg. volume
5) ADX above 20
Traders can change the inputs as per their liking to adjust as per their comfortable timeframe.
Credits: Special Thanks to Mr. DTBHAT for sharing the above conditions.

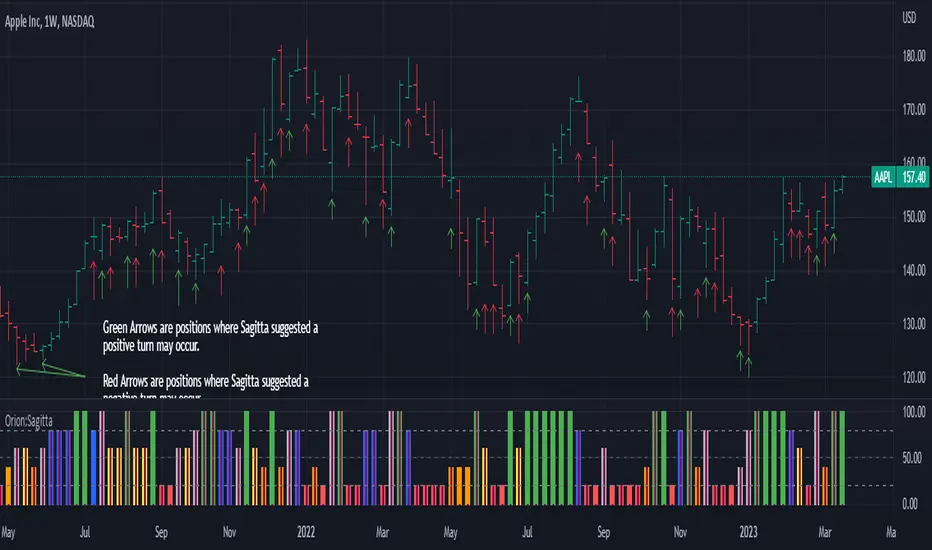
Orion:SagittaSagitta
Sagitta is an indicator the works to assist in the validation of potential long entries and to place stop-loss orders. Sagitta is not a "golden indicator" but more of a confirmation indicator of what prices might be suggesting.
The concept is that while stocks can turn in one bar, it usually takes two bars or more to signal a turn. So, using a measurement of two bars help determine the potential turning of prices.
Behind the scenes, Sagitta is nothing more than a 2 period stochastic which has had its values divided into five specific zones.
Dividing the range of the two bars in five sections, the High is equal to 100 and the Low is equal to 0.
The zones are:
20 = bearish (red) – This is when the close is the lower 20% of the two bars
40 = bearish (orange) – This is when the close is between the lower 20% and 40% of the two bars.
60 = neutral (yellow) – This is when the close is between the middle 40% - 60% of the two bars.
80 = bullish (blue) – This is when the close is between the upper 60% - 80% of the two bars.
100 = bullish (green) – This is when the close is above the upper 80% of the bar.
The general confirmation concept works as such:
When the following bar is of a higher value than the previous bar, there is potential for further upward price movement. Conversely when the following bar is lower than the previous bar, there is potential for further downward movement.
Going from a red bar to orange bar Might be an indication of a positive turn in direction of prices.
Going from a green bar to an orange bar would also be considered a negative directional turn of prices.
When the follow on bar decreases (ie, green to blue, blue to yellow, etc) placing a stop-loss would be prudent.
Maroon lines in the middle of a bar is an indication that prices are currently caught in consolidation.
Silver/Gray bars indicate that a high potential exists for a strong upward turn in prices exists.
Consolidation is calculated by determining if the close of one bar is between the high and low of another bar. This then establishes the range high and low. As long as closes continue with this range, the high and low of the range can expand. When the close is outside of the range, the consolidation is reset.
Signals in areas of consolidation (maroon center bar) should be looked upon as if the prices are going to challenge the high of the consolidation range and not necessarily break through.
The entry technique used is:
The greater of the following two calculations:
High of signal bar * 1.002 or High of signal bar + .03
The stop-loss technique used is:
The lesser of the following two calculations:
Low of signal bar * .998 or Low of signal bar - .03
IF an entry signal is generated and the price doesn’t reach the entry calculation. It is considered a failed entry and is not considered a negative or that you missed out on something. This has saved you from losing money since the prices are not ready to commit to the direction.
When placing a stop-loss, it is never suggested that you lower the value of a stop-loss. Always move your stop-losses higher in order to lock in profit in case of a negative turn.
SPY 1 Minute Day TraderWhen scalping options, users are looking for where breakouts are going to occur instead of sitting thru areas choppy price action that drain delta and cause them to lose value even if price is up trending. This script tries to identify when a trend reversal is expected based on one minute price action on the SPY. It alerts users to prepare for potential breakout when 5 out of the 6 key optimized parameters are discovered by showing a white L or S. Once all six trigger, it informs the user at the close of that candle with a golden triangle with Pivot Up or Pivot Down. As scalping options is something that is expected to be short in duration, a take profit and stop loss of 30 cents of price actions is established. If five or more parameters occur after the pivot is initiated, then stop losses and take profits are adhered to; however, if there are less, then it waits to take profit or stop the trade, as likely it is just noise and it will finish trend with an additional breakout.
This script has been created to take into account how the following variables impact trend for SPY 1 Minute:
ema vs 13 ema : A cross establishes start of trend
MACD (Line, Signal & Slope) : If you have momentum
ADX : if you are trending
RSI : If the trend has strength
The above has been optimized to determine pivot points in the trend using key values for these 6 indicators
bounce up = ema5 > ema13 and macdLine < .5 and adx > 20 and macdSlope > 0 and signalLine > -.1 and rsiSignal > 40
bounce down = ema5 < ema13 and macdLine > -.5 and adx > 20 and signalLine < 0 and macdSlope < 0 and rsiSignal < 60
White L's indicate that 5 of 6 conditions are met due to impending uptrend w/ missing one in green below it
Yellow L's indicate that 6 of 6 conditions still are met
White S's indicate that 5 of 6 conditions are met due to impending downtrend w/ missing condition in red above it
Yellow S's indicate that 6 of 6 conditions still are met
After a downtrend or uptrend is established, once it closes it can't repeat for 10 minutes
Won't open any trades on last two minutes of any hours to avoid volatility
Will close any open trades going into last minute of hour to avoid large overnight random swings.

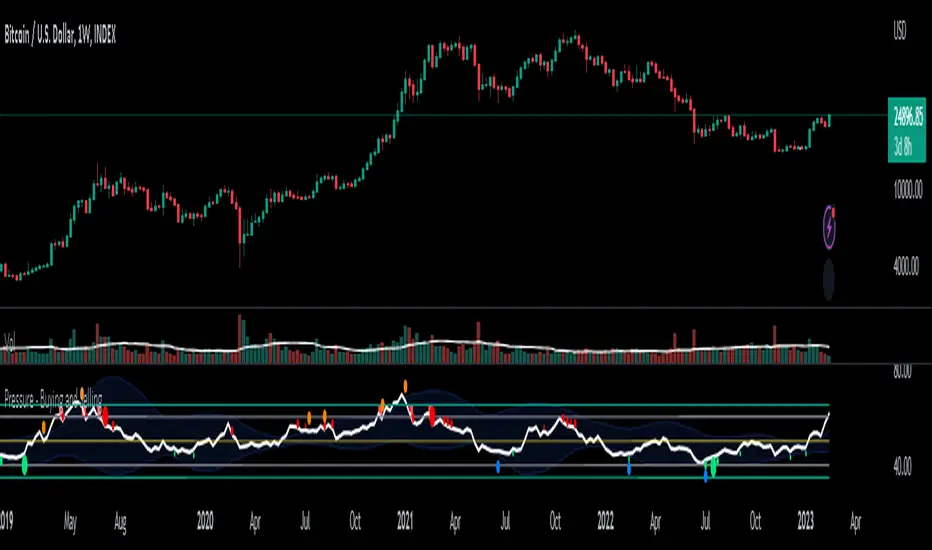
Pressure - Buying and SellingThis is the Pressure Indicator.
The Pressure Indicator analyzes a number of price ratios to measure the pressure of Buyers and Sellers.
I’ve also added to the indicator:
1) Moving Averages (MA) – You can choose 3 types of MA:
- Simple Moving Average (SMA)
- Exponential Moving Average (EMA) - default
- Volume Weighted Moving Average (VWMA)
- Arnaud Legoux Moving Average (ALMA)
By default the MA are not displayed. You can turn them on or off.
2) Standard Deviation Bands and MA Bands – Bands only for the MA type 1 selection. Usually, the Pressureis inside the Bands. If it is beyond the Bands that could mean the current trend is ending. The MA Bands are turned off by default but you can turn them on the Styles Tab Menu.
3) Levels for Overbought and Oversold Zones:
- Gray Overbought 60
- Gray Oversold 40
4) Levels for Buying and Selling Pressure (3 types of pressure + 1 more). If the Pressure is crossing various intermediate levels that means there is Buying or Selling Pressure at those levels.
5) Signals for Crossing Overbought and Oversold Levels:
- Top Red fills for Crossing Down Overbought Level
- Bottom Lime fills for Crossing Up Oversold Level
6) Signals for Buying and Selling Pressure:
- Buy Pressure 1 and 2 are the smaller lime dots.
- Buy Pressure 1 and 2 together are the bigger lime dots.
- Buy Pressure 3 (Crossing Deviation Bands Up) are the blue dots.
- Sell Pressure 1 and 2 are the smaller red dots.
- Sell Pressure 1 and 2 together are the bigger red dots.
- Sell Pressure 3 (Crossing Deviation Bands Down) are the orange dots.
If there are more than one dot appearing at the same moment they will appear displaced in a vertical way at the same time.
If there is something wrong with the code or its calculations, please let me know.
If you want to modify or improve the code, feel free to do that, but please let me know the changes you made.
This Indicator is very accurate when using the Weekly Timeframe . I hope you enjoy it!
Dynamo
╭━━━╮
╰╮╭╮┃
╱┃┃┃┣╮╱╭┳━╮╭━━┳╮╭┳━━╮
╱┃┃┃┃┃╱┃┃╭╮┫╭╮┃╰╯┃╭╮┃
╭╯╰╯┃╰━╯┃┃┃┃╭╮┃┃┃┃╰╯┃
╰━━━┻━╮╭┻╯╰┻╯╰┻┻┻┻━━╯
╱╱╱╱╭━╯┃
╱╱╱╱╰━━╯
Overview
Dynamo is built to be the Swiss-knife for price-movement & strength detection, it aims to provide a holistic view of the current price across multiple dimensions. This is achieved by combining 3 very specific indicators(RSI, Stochastic & ADX) into a single view. Each of which serve a different purpose, and collectively provide a simple, yet powerful tool to gauge the true nature of price-action.
Background
Dynamo uses 3 technical analysis tools in conjunction to provide better insights into price movement, they are briefly explained below:
Relative Strength Index(RSI)
RSI is a popular indicator that is often used to measure the velocity of price change & the intensity of directional moves. RSI computes the relative strength of the current price by comparing the security’s bullish strength versus bearish strength for a given period, i.e. by comparing average gain to average loss.
It is a range bound(0-100) variable that generates a bullish reading if average gain is higher, and a bullish reading if average loss is higher. Values over 50 are generally considered bullish & values less than 50 indicate a bearish market. Values over 70 indicate an overbought condition, and values below 30 indicate oversold condition.
Stochastic
Stochastic is an indicator that aims to measure the momentum in the market, by comparing most recent closing price of the security to its price range for a given period. It is based on the assumption that price tends to close near the recent high in an up trend, and it closes near the recent low during a down trend.
It is also range bound(0-100), values over 80 indicate overbought condition and values below 20 indicate oversold condition.
Average Directional Index(ADX)
ADX is an indicator that can quantify trend strength, it is derived from two underlying indices, known as Directional Movement Index(DMI). +DMI represents strength of the up trend, and -DMI represents strength of the down trend, and ADX is the average of the two.
ADX is non-directional or trend-neutral, which means, it does not follow the direction of the price, instead ADX will rise only when there is a strong trend, it does not matter if it’s an up trend or a down trend. Typical ranges of ADX are 25-50 for a strong trend, anything below 25 is considered as no trend or weak trend. ADX can frequently shoot upto higher values, but it generally finds exhaustion levels around the 60-75 range.
About the script
All these indicators are very powerful tools, but just like any other indicator they have their limitations. Stochastic & ADX can generate false signals in volatile markets, meaning price wouldn’t always follow through with what’s being indicated. ADX may even fail to generate a signal in less volatile markets, simply because it is based on moving averages, it tends to react slower to price changes. RSI can also lose it’s effectiveness when markets are trending strong, as it can stay in the overbought or oversold ranges for an extended period of time.
Dynamo aims to provide the trader with a much broader perspective by bringing together these contrasting indicators into a single simplified view. When Stochastic becomes less reliable in highly volatile conditions, one can cross validate their deduction by looking at RSI patterns. When RSI gets stuck in overbought or oversold range, one can refer to ADX to get better picture about the current trend. Similarly, various combinations of rules & setups can be formulated to get a more deterministic view, when working with either of these indicators.
There many possible use cases for a tool like this, and it totally depends on how you want to use it. An obvious option is to use it to trigger signals only after it has been confirmed by two or more indicators, for example, RSI & Stochastic make a great combination for cross-over or cross-under strategies. Some of the other options include trend detection, strength detection, reversals or price rejection points, possible duration of a trend, and all of these can very easily be translated into effective entry and exit points for trades.
How to use it
Dynamo is an easy-to-use tool, just add it to your chart and you’re good to start with your market analysis. Output consists of three overlapping plots, each of which tackle price movement from a slightly different angle.
Stochastic: A momentum indicator that plots the current closing price in relation to the price-range over a given period of time.
Can be used to detect the direction of the price movement, potential reversals, or duration of an up/down move.
Plotted as grey coloured histograms in the background.
Relative Strength Index(RSI): RSI is also a momentum indicator that measures the velocity with which the price changes.
Can be used to detect the speed of the price movement, RSI divergences can be a nice way to detect directional changes.
Plotted as an aqua coloured line.
Average Directional Index(ADX): ADX is an indicator that is used to measure the strength of the current trend.
Can be used to measure how strong the price movement is, both up and down, or to establish long terms trends.
Plotted as an orange coloured line.
Features
Provides a well-rounded view of the market movement by amalgamating some of the best strength indicators, helping traders make better informed decisions with minimal effort.
Simplistic plots that aim to convey clean signals, as a result, reducing clutter on the chart, and hopefully in the trader's head too.
Combines different types of indicators into a single view, which leads to an optimised use of the precious screen real-estate.
Final Note
Dynamo is designed to be minimalistic in functionality and in appearance, as it is being built to be a general purpose tool that is not only beginner friendly, but can also be highly-configurable to meet the needs of pro traders.
Thresholds & default values for the indicators are only suggestions based on industry standards, they may not be an exact match for all markets & conditions. Hence, it is advisable for the user to test & adjust these values according their securities and trading styles.
The chart highlights one of many possible setups using this tool, and it can used to create various types of setups & strategies, but it is also worth noting that the usability & the effectiveness of this tool also depends on the user’s understanding & interpretation of the underlying indicators.
Lastly, this tool is only an indicator and should only be perceived that way. It does not guarantee anything, and the user should do their own research before committing to trades based on any indicator.

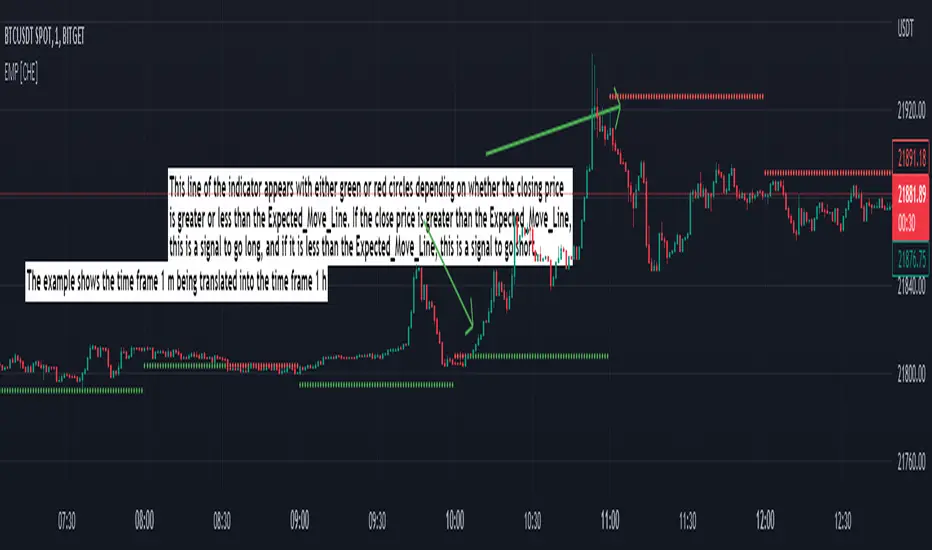
Expected Move Plotter [CHE]Expected Move Plotter
"There is magic in everything new."
Introduction:
This script is an indicator for financial trading that plots the expected movement of a security based on the average range over the last five periods. The script is written in Pine Script, a high-level programming language used for creating technical indicators, strategies, and other trading tools for the TradingView platform.
Inputs:
Percentage of Open and Close: This input specifies the percentage of the open and close price to use for the expected movement.
Time Periods: The script takes the different time periods into account and translates them to either 60 seconds, 240 seconds, 1 day, 3 days, 7 days, 1 month, 3 months or 12 months.
Calculation:
The script uses the "Open" and "High"/"Low" values of the last 5 periods to calculate the average range and plots the expected movement above and below the current open price. The plot is either green or red depending on whether the expected move is above or below the current close.
Code Breakdown:
The script starts by defining three integer constants: MS_IN_MIN, MS_IN_HOUR, and MS_IN_DAY, which represent the number of milliseconds in a minute, hour, and day, respectively.
The function timeStep_translate() returns a string that represents the timeframe for a chart based on the current timeframe. The function first converts the chart's timeframe to milliseconds and then uses a switch statement to determine the string value to be returned based on the number of milliseconds in the timeframe.
The script then retrieves the data for the open, high, and low values for the last five periods. The high and low values are used to calculate the average range, which is then used to plot the expected movement above and below the current open price.
Conclusion:
This script provides traders with a visual representation of the expected movement of a security based on the average range over the last five periods. It takes different time periods into account and provides a clear indication of whether the expected move is above or below the current close. The script is easy to use and provides a useful tool for traders looking to make informed trading decisions.
Best regards Chervolino
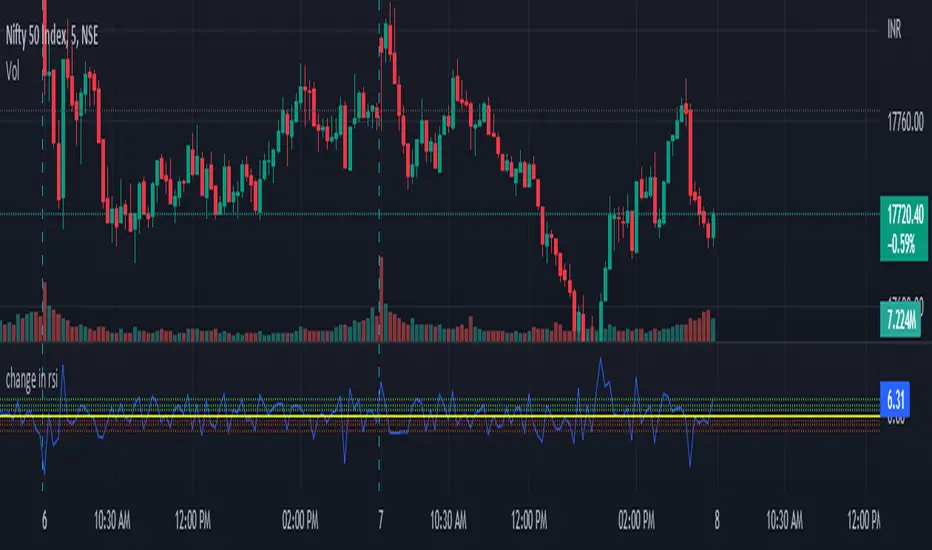
change in rsiThis indicator will show how fast the rsi of a symbol is changing. you can see this as a differentiation function on rsi .
this will show the change in rsi in percentage.
Ex: suppose the rsi of a symbol at present is 60 and the previous value of rsi was 52,
as you can see the rsi has increased, which is a sign of the symbol being bullish .
this indicator will tell by what percentage the rsi of the symbol has increased or decreased.
for the above example, the change in rsi is 15.38% increase.
this is set to default chart time-frame.
Stock Relative Strength Power IndexAs always, this is not financial advice and use at your own risk. Trading is risky and can cost you significant sums of money if you are not careful. Make sure you always have a proper entry and exit plan that includes defining your risk before you enter a trade.
This idea recently came out of some discussions I stumbled across in a trading group I am a part of regarding Relative Strength and Relative Weakness (shortened to RS and RW from here on out). The whole mechanism behind this trading system is to filter out underperforming securities relative to the current market direction to be in only the strongest or weakest stocks when the market is currently experiencing a bullish or bearish cycle. The idea behind this is there is no point in parking your money into a stock that is treading water or even going down if the market is making strong moves upwards. At that point, you are at worst losing money, and at best trading equal to the index/ETF, in which case the argument is why are you not just trading the index/ETF instead? RS or RW will filter out these sector laggards and allow you to position yourself into strong (or the strongest) stocks at any given time to help improve portfolio performance. Further, not only does it protect your position should the market shift against you briefly, it also often sees exceptional performance in the same cycle. For example, if $SPY makes a 5% move over the course of a month, a stock with RS/RW may make a 10% move, or more, allowing you to see increased profit potential.
RS/RW is based on the idea of performance, that is the raw percent change of a security over a given time period relative to a benchmark. This benchmark is often the S&P500 (ES/SPX/SPY and their derivatives). I have to stress that this is not beta, which measures the volatility of a stock over a given period (i.e. if $SPY moves $1, $NVDA will often move $1.74). This is a measurement of the market (i.e. $SPY) has moved 1% over the course of a day, $NVDA has moved 8% over the course of the day. This is very often used as a signal of institutional interest as apart from some very unique moments, retail traders cannot and will not provide enough market pressure to move a market outside of a stock's normal trading range, nor will they outperform the sector or market as a whole consistently over time without some big money to make them move. The problem with running strict performance analysis (i.e. % change from period T ago to period T + n at present) is that while it gives us a baseline of how much the stock has moved, it doesn't overall mean much. For instance, if a $100 stock has moved 5% today, but has been experiencing a period of increased volatility and it's Average True Range (ATR) (the amount a stock will move over X number of periods, on average) is $7, performance seems impressive but is actually generally fairly weak to what the stock has been doing recently. Conversely, if we take a second stock, this time worth $20, and it too has moved 5% in one day but has an ATR of only $0.25, that stock has made an exceptional move and we want to be part of that.
Here, I have created an indicator called the Stock Relative Strength Power Index. This takes the stock's rate of change (ROC) (the % move it has made over X number of periods), the stock's normalized ATR (the ATR represented as a percentage instead of a raw value), and compares these to one another to get the "Power Rating": a representation of the true strength of a stock over X number of periods. The indicator does two things. First, the raw ROC is divided by the stock's normalized ATR to assess whether the stock is moving outside of its normal range of variation or not. Second, since we are interested in trading only stocks with exceptional RS/RW to the market, I have also applied this same calculation to the S&P500 ($SPY) and the various SPDR sector indexes. These comparisons allow for a rapid and accurate assessment of the true strength of a stock at any given time on any given time frame. To cycle back above to our examples, the $100 stock has a Power Rating of only 0.71 (i.e. it is trading less than its current average), while our $20 stock has a Power Rating of 5. If we then compare these to both the market as a whole and the sector that the stock is a part of, we get a much clearer indication of the true buying or selling pressure imposed on the stock at any given time.
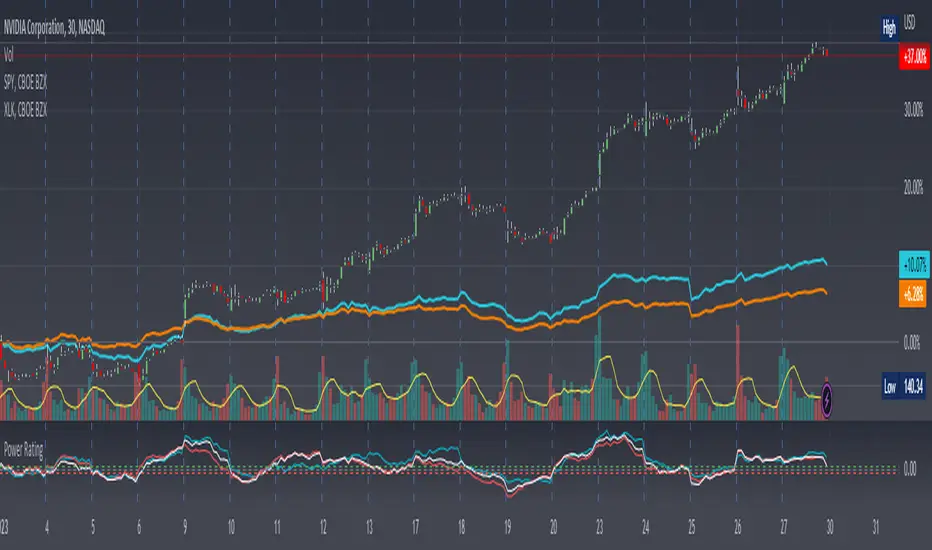
Use:
The indicator has 3 lines. The blue line is the security of interest, the red line is the market baseline (i.e. the sector ETF $SPY), and the white line is the sector index. I have given an example above on the semiconductor/tech stock $NVDA on a 30min timeframe. You can see that since the start of 2023, $NVDA has generally been strong to the market and its own sector since the blue line is greater than both the red and white lines over many days. This would have provided some nice day trading opportunities, or even some nice short term swing trades. The values themselves are generally meaningless outside of either the 1 or -1 value lines. All that matters is that the current ticker is surpassing both the market and the sector while being > 1.0 for a long trade or less than -1.0 for a short trade. However, I must stress this indicator gives no trade signals on its own, it is purely a confirmation indicator. An example of a trade would be if you had a trade signal given by either an indicator or by price action suggesting to buy some $NVDA for a trade to the upside, the Power Rating indicator would confirm this by showing if $NVDA was actually showing true strength by being both greater than 1 (the cutoff for it surpassing its ATR) and being above both the red and white lines. Further, you can see $NVDA has been stronger than the market when using the comparison function as well, but the has fluxed in and out of strength intraday when using the actual indicator vs. the static performance ratio chart (plotted as line graphs on the chart).
I have made it possible to change the colour of the plots and the line levels. The adjustment of the line levels gives the trader the flexibility to change their target breakout level (i.e. only trading stocks that have a Power Rating > 2, for example, meaning they are trading at least 2X their normal trading range). The third security comparison is flexible and can be used to compare to the sector ETF (initial intention) or it can be used to compare to other tickers within the same sector, for example. The trader should select the appropriate ETF for the given security of interest to avoid false confirmation if they want to use an ETF as their third input. The proper sector should be readily available on most online websites and accessible in a matter of seconds meaning that the delay is minimal, at worst. If a trader wishes to add additional functionality, such as a crypto trader using BTCUSD as the benchmark instead of $SPY, I encourage them to copy and paste this script and modify as needed since I have made this open source.
This indicator works on all timeframes. The lookback period can be changed, so a day trader who may use a 5min chart (and use a period of 12 to get the hourly Power Rating) will find this equally useful as someone who may be a core trader who wants to look at the performance over the course of years and may use a 60 period on a monthly chart.
Happy trading and I hope this helps!
Multi TF High/Low/Open/Close LineNOTE: I'm not sure why the screengrab isn't showing the lines. They are there, and when I share the chart from this link they are there.... idk
This is a requested spin-off version of my previous HLOC for the Daily/Weekly/Monthly that allows users to choose 3 different timeframe units (Mins, Hours, Days, etc...) from the dropdown menu and then select the lookback period in which to draw the HLOC.
I've had quite a few requests to allow users to see multiple lookbacks for the same timeframe unit, mostly weekly, and I did not wish to change that particular script for that purpose. However, I was able to take the existing script and alter it for user input.
This indicator draws a line on the TF 1, TF 2, and TF 3 bar at the High, Low, Open and Close of user input Timeframe unit and selected lookback period.
The lookback period will go back the number of candles entered. So for example if you choose a 5 Min chart with a lookback of 3, the lines will be drawn on the HLOC 3 closed 5 min candles back. Selecting 0 will show data on the current Real-Time candle.
An example of a request I have gotten was for last week, the previous week and the previous month. The settings for that would be: TF 1 - 1 week Lookback 1, TF 2 - 1 week Lookback 2, TF 3 - 1 month Lookback 1.
Each set of lines has an optional identifying label with its own color set that can be shown with or without price value, and has drop down menus for size and style of each set of labels. The TF unit value is displayed on the label, but not the lookback.
So if you are using the hourly on all 3 TF's with different lookback periods, they will all say "60" on the label.
I recommend using the line and label options to distinguish between the different lookback values.
Each set of lines has inputs for line/text color, line width and style and each line argument can be selected independently.
In the chart example I have displayed only the High and Low on three 1 hour TF's with the lookback of 4, 5 and 6 candles with the labels descending in size. With this data I can see that over the last 6 hours the price of ES is in an descending pattern and I should be on alert for a break.
Since I trade ES in RTH on a much lower timeframe, this data can alert me to a bigger picture potential trend change or continuation. I would personally use this with pivot data for timing and look for entries in areas of high volume that moved price to a new
high or low that have not been retested.
I will be looking to add a user input offset for labels in the future. I have had bad luck with it in the past working for a couple weeks and then throwing an error, but I will look into it again soon.
I also recommend going into Chart Settings/Status Line and turning off indicator arguments OR moving the script to the top of the indicator list to avoid obstructed chart view with this indicators arguments. When script allows, I will update it to hide them.

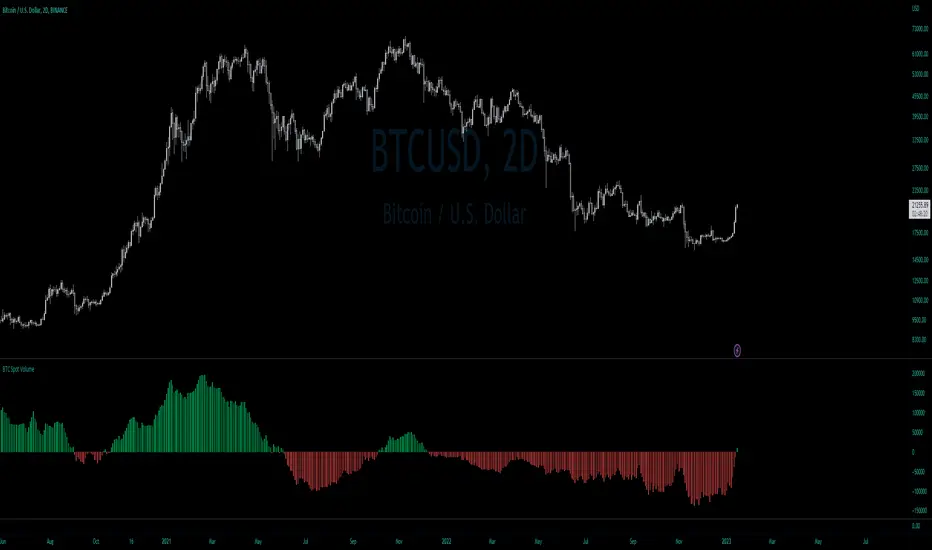
BTC Net Volume (Spot) (by JaggedSoft, fixed by SLN)• WHAT:
This indicator plots the aggregated net volume delta of BTC spot pairs from 8 exchanges over the last 60 periods (default settings).
Tracks the following pairs:
"BINANCE:BTCUSDT"
"BITFINEX:BTCUSD"
"POLONIEX:BTCUSDT"
"BITTREX:BTCUSDT"
"COINBASE:BTCUSD"
"BITSTAMP:BTCUSD"
"KRAKEN:XBTUSD"
"BITGET:BTCUSDT"
"GEMINI:BTCUSD"
• HOW TO USE:
Used for confirmation when watching futures that can experience quick movements in the form of liquidation-events. If the oscillator is green or trending upward, it's confirming a positive bias. The inverse is true for a negative bias. This is especially true on higher timeframes.
Can also be used to find correlations between different tech-assets.
• NOTES:
I forked JaggedSofts indicator to fix the data-source error it was having. Let me know if you want to customize exchanges or add more pairs, maybe I can add that in the future!
This indicator replaces the outdated alternative linked here : Please only use this one
• LIMITATIONS:
Only tested with normal japanese candlesticks .
• THANKS:
to the creator of this script, JaggedSoft. It's a great indicator!
• DISCLAIMER:
Not financial Advice, use at your own risk.
US Fed Rate Hike Historical DatesThe script applies Blue (color can be changed) highlights to the days that the US Federal Reserve Hiked interest rates. Data goes back to the 60's. This can be applied to any chart/timeframe to view how the asset behaved before/during/after Federal Rate Hikes.
****This was updated as of Dec 2022... Any decisions after Dec 2022 will not show up in this indicator.
Versions may be updated periodically to include new data.
Hope this helps. Happy Trades
-SnarkyPuppy

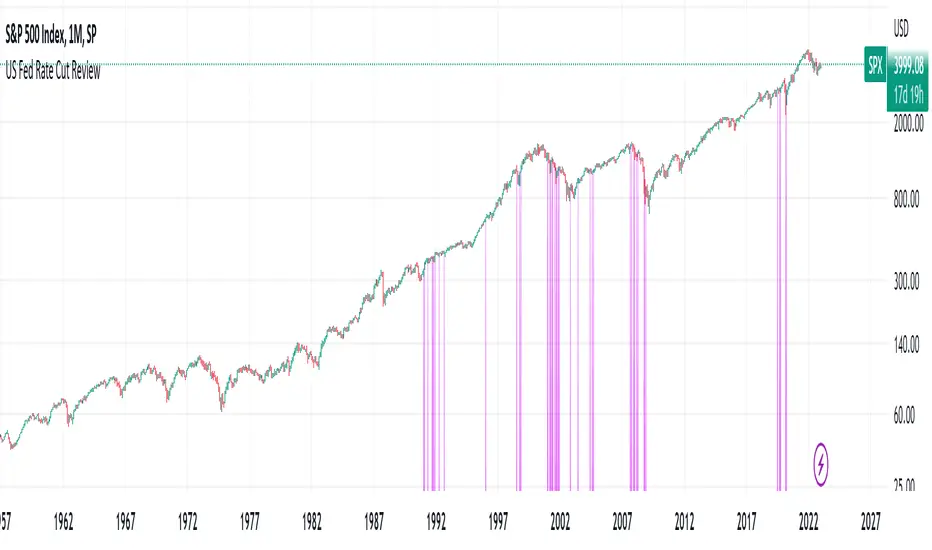
US Fed Rate Cut Historical DatesThe script applies Purple (color can be changed) highlights to the days that the US Federal Reserve Cut interest rates. Data goes back to the 60's. This can be applied to any chart/timeframe to view how the asset behaved before/during/after Federal Rate cuts.
****This was updated as of Dec 2022... Any decisions after Dec 2022 will not show up in this indicator.
Versions may be updated periodically to include new data.
Hope this helps. Happy Trades
-SnarkyPuppy
Multi-Timeframe MA Based Zigzag[liwei666]🎲 Overview
🎯 This Zigzag indicator build based on different MA such as EMA/HMA/RMA/SMA, support multi-timeframe setting .
you can get customer zigzag indicator by change short/long ma length and high-timeframe config(5m/15m/30m/1h/2h) in any symbol.
🎲 Indicator design logic
🎯 entired logic is simple and code looks complex, I‘ll explain core logic here, code already equipped with detailed comments.
1. use close-in EMA's highest/lowest value mark as SWING High/Low when EMA crossover/under, not use func ta.pivothigh()/ta.pivotlow()
2. when EMA crossover/under plot a char as signal like ●/❄/▲, crossover get blue char crossunder get red char
3. latest zigzag line is not drawn until EMA is turned (crossover/under), but signal is realtime
4. you can see diff zigzag structure when you open high-timeframe config, then find regular pattern benefit your trading.
🎲 Settings
🎯 there are 3 group properties in script, just focus on 5 properties in 'GRP1' ,
'GRP2' and 'GRP3' are display config.
'GRP1':
MA_Type: MA type you can choose(EMA/RMA/SMA/HMA/WMA), default is EMA
short_ma_len: short MA length of your current timeframe on chart
long_ma_len: long MA length of your current timeframe on chart
htf_ma_len: MA length of high timeframe, MA type same as 'MA_Type' config
htf_ma_tf: high timeframe ma length, 15/30/60/120 minute
'GRP2':
• show_short_zz • show_long_zz • show_htf_zz:
'GRP3':
• show_short_ma_line • show_short_ma_signal
• show_long_ma_line • show_long_ma_signal
• show_htf_ma_line • show_htf_ma_signal
🎲 Usage
🎯 As we know, MA based signal usually worked fine in trend market , low volatility is unprofitable.
🎯 One of pattern as the chart show below.
1. success example : after a blue ▲ signal, entry long when blue ● signal appear, marked with green box.
2. failed example: after a blue ▲ signal, a red ▼ signal appear, marked with white box.
🎯 BoS(Break of Structure) based on ma zigzag is a good idea I'm implementing, it will be published in next script.
Additionally, I plan to publish 20 profitable strategies in 2023; this indicatior not one of them,
let‘s witness it together!
Hope this indicator will be useful for you :)
enjoy! 🚀🚀🚀

CVD - Cumulative Volume Delta (Chart)█ OVERVIEW
This indicator displays cumulative volume delta (CVD) as an on-chart oscillator. It uses intrabar analysis to obtain more precise volume delta information compared to methods that only use the chart's timeframe.
The core concepts in this script come from our first CVD indicator , which displays CVD values as plot candles in a separate indicator pane. In this script, CVD values are scaled according to price ranges and represented on the main chart pane.
█ CONCEPTS
Bar polarity
Bar polarity refers to the position of the close price relative to the open price. In other words, bar polarity is the direction of price change.
Intrabars
Intrabars are chart bars at a lower timeframe than the chart's. Each 1H chart bar of a 24x7 market will, for example, usually contain 60 bars at the lower timeframe of 1min, provided there was market activity during each minute of the hour. Mining information from intrabars can be useful in that it offers traders visibility on the activity inside a chart bar.
Lower timeframes (LTFs)
A lower timeframe is a timeframe that is smaller than the chart's timeframe. This script utilizes a LTF to analyze intrabars, or price changes within a chart bar. The lower the LTF, the more intrabars are analyzed, but the less chart bars can display information due to the limited number of intrabars that can be analyzed.
Volume delta
Volume delta is a measure that separates volume into "up" and "down" parts, then takes the difference to estimate the net demand for the asset. This approach gives traders a more detailed insight when analyzing volume and market sentiment. There are several methods for determining whether an asset's volume belongs in the "up" or "down" category. Some indicators, such as On Balance Volume and the Klinger Oscillator , use the change in price between bars to assign volume values to the appropriate category. Others, such as Chaikin Money Flow , make assumptions based on open, high, low, and close prices. The most accurate method involves using tick data to determine whether each transaction occurred at the bid or ask price and assigning the volume value to the appropriate category accordingly. However, this method requires a large amount of data on historical bars, which can limit the historical depth of charts and the number of symbols for which tick data is available.
In the context where historical tick data is not yet available on TradingView, intrabar analysis is the most precise technique to calculate volume delta on historical bars on our charts. This indicator uses intrabar analysis to achieve a compromise between simplicity and accuracy in calculating volume delta on historical bars. Our Volume Profile indicators use it as well. Other volume delta indicators in our Community Scripts , such as the Realtime 5D Profile , use real-time chart updates to achieve more precise volume delta calculations. However, these indicators aren't suitable for analyzing historical bars since they only work for real-time analysis.
This is the logic we use to assign intrabar volume to the "up" or "down" category:
• If the intrabar's open and close values are different, their relative position is used.
• If the intrabar's open and close values are the same, the difference between the intrabar's close and the previous intrabar's close is used.
• As a last resort, when there is no movement during an intrabar and it closes at the same price as the previous intrabar, the last known polarity is used.
Once all intrabars comprising a chart bar are analyzed, we calculate the net difference between "up" and "down" intrabar volume to produce the volume delta for the chart bar.
█ FEATURES
CVD resets
The "cumulative" part of the indicator's name stems from the fact that calculations accumulate during a period of time. By periodically resetting the volume delta accumulation, we can analyze the progression of volume delta across manageable chunks, which is often more useful than looking at volume delta accumulated from the beginning of a chart's history.
You can configure the reset period using the "CVD Resets" input, which offers the following selections:
• None : Calculations do not reset.
• On a fixed higher timeframe : Calculations reset on the higher timeframe you select in the "Fixed higher timeframe" field.
• At a fixed time that you specify.
• At the beginning of the regular session .
• On trend changes : Calculations reset on the direction change of either the Aroon indicator, Parabolic SAR , or Supertrend .
• On a stepped higher timeframe : Calculations reset on a higher timeframe automatically stepped using the chart's timeframe and following these rules:
Chart TF HTF
< 1min 1H
< 3H 1D
<= 12H 1W
< 1W 1M
>= 1W 1Y
Specifying intrabar precision
Ten options are included in the script to control the number of intrabars used per chart bar for calculations. The greater the number of intrabars per chart bar, the fewer chart bars can be analyzed.
The first five options allow users to specify the approximate amount of chart bars to be covered:
• Least Precise (Most chart bars) : Covers all chart bars by dividing the current timeframe by four.
This ensures the highest level of intrabar precision while achieving complete coverage for the dataset.
• Less Precise (Some chart bars) & More Precise (Less chart bars) : These options calculate a stepped LTF in relation to the current chart's timeframe.
• Very precise (2min intrabars) : Uses the second highest quantity of intrabars possible with the 2min LTF.
• Most precise (1min intrabars) : Uses the maximum quantity of intrabars possible with the 1min LTF.
The stepped lower timeframe for "Less Precise" and "More Precise" options is calculated from the current chart's timeframe as follows:
Chart Timeframe Lower Timeframe
Less Precise More Precise
< 1hr 1min 1min
< 1D 15min 1min
< 1W 2hr 30min
> 1W 1D 60min
The last five options allow users to specify an approximate fixed number of intrabars to analyze per chart bar. The available choices are 12, 24, 50, 100, and 250. The script will calculate the LTF which most closely approximates the specified number of intrabars per chart bar. Keep in mind that due to factors such as the length of a ticker's sessions and rounding of the LTF, it is not always possible to produce the exact number specified. However, the script will do its best to get as close to the value as possible.
As there is a limit to the number of intrabars that can be analyzed by a script, a tradeoff occurs between the number of intrabars analyzed per chart bar and the chart bars for which calculations are possible.
Display
This script displays raw or cumulative volume delta values on the chart as either line or histogram oscillator zones scaled according to the price chart, allowing traders to visualize volume activity on each bar or cumulatively over time. The indicator's background shows where CVD resets occur, demarcating the beginning of new zones. The vertical axis of each oscillator zone is scaled relative to the one with the highest price range, and the oscillator values are scaled relative to the highest volume delta. A vertical offset is applied to each oscillator zone so that the highest oscillator value aligns with the lowest price. This method ensures an accurate, intuitive visual comparison of volume activity within zones, as the scale is consistent across the chart, and oscillator values sit below prices. The vertical scale of oscillator zones can be adjusted using the "Zone Height" input in the script settings.
This script displays labels at the highest and lowest oscillator values in each zone, which can be enabled using the "Hi/Lo Labels" input in the "Visuals" section of the script settings. Additionally, the oscillator's value on a chart bar is displayed as a tooltip when a user hovers over the bar, which can be enabled using the "Value Tooltips" input.
Divergences occur when the polarity of volume delta does not match that of the chart bar. The script displays divergences as bar colors and background colors that can be enabled using the "Color bars on divergences" and "Color background on divergences" inputs.
An information box in the lower-left corner of the indicator displays the HTF used for resets, the LTF used for intrabars, the average quantity of intrabars per chart bar, and the number of chart bars for which there is LTF data. This is enabled using the "Show information box" input in the "Visuals" section of the script settings.
FOR Pine Script™ CODERS
• This script utilizes `ltf()` and `ltfStats()` from the lower_tf library.
The `ltf()` function determines the appropriate lower timeframe from the selected calculation mode and chart timeframe, and returns it in a format that can be used with request.security_lower_tf() .
The `ltfStats()` function, on the other hand, is used to compute and display statistical information about the lower timeframe in an information box.
• The script utilizes display.data_window and display.status_line to restrict the display of certain plots.
These new built-ins allow coders to fine-tune where a script’s plot values are displayed.
• The newly added session.isfirstbar_regular built-in allows for resetting the CVD segments at the start of the regular session.
• The VisibleChart library developed by our resident PineCoders team leverages the chart.left_visible_bar_time and chart.right_visible_bar_time variables to optimize the performance of this script.
These variables identify the opening time of the leftmost and rightmost visible bars on the chart, allowing the script to recalculate and draw objects only within the range of visible bars as the user scrolls.
This functionality also enables the scaling of the oscillator zones.
These variables are just a couple of the many new built-ins available in the chart.* namespace.
For more information, check out this blog post or look them up by typing "chart." in the Pine Script™ Reference Manual .
• Our ta library has undergone significant updates recently, including the incorporation of the `aroon()` indicator used as a method for resetting CVD segments within this script.
Revisit the library to see more of the newly added content!
Look first. Then leap.

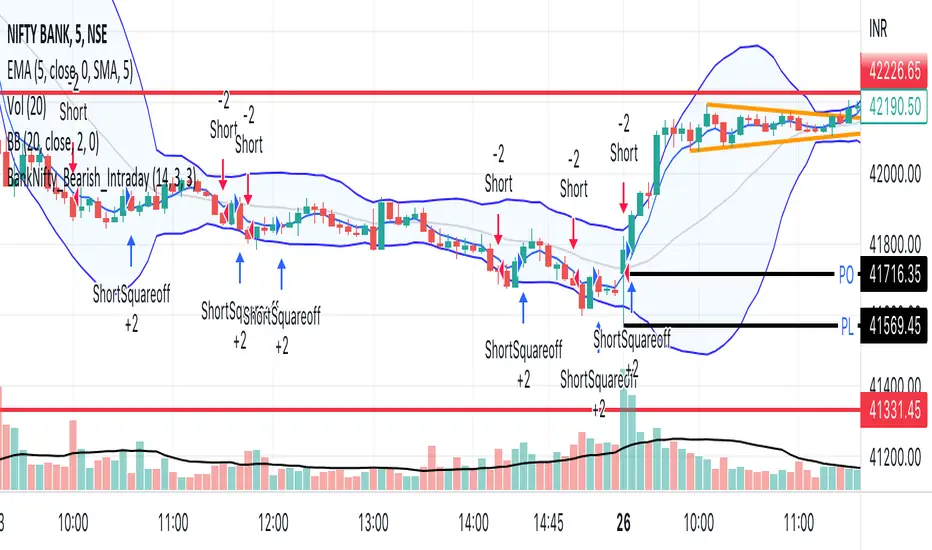
BankNifty_Bearish_Intraday
The script uses following mechanism to give a signal of SELL if multiple parameters evaluated are all passed.
ENTRY-
1. 5 min MACD should be less than its previous tick
2. 15 min MACD should be less than its previous tick
3. 60 min MACD should be less than its previous tick
4. ADX should be more than 12
5. RSI should be less than 40
6. Stochastic %k should have negative cross over with %d
7. Bollinger band lower band value should be less than previous tick
EXIT
If the 5 min bar price closes above 5 min EMA , it gives an exit signal.
Delox EMA CrossThis indicator works with the change of trend of emas
When the fast 14 crosses above the 21 this is an uptrend.
and when the slow ema of 21 crosses below the slow ema of 14 then we have a downtrend.
It is accompanied by the Stochastic indicator that when there is a cross of Emas will give a bullish or bearish signal.
Bearish signal
When the D-stochastic or the Orange line of the stochastic is greater than 60 and there is a trend reversal crossover it will give a bearish signal painted on the background of the chart.
Bullish signal
When the stochastic D which is the orange line of the stochastic is less than 30 and has a line crossing on the lines it will give a bullish signal.
White bar
White bar appears when there is a change in trend between ema 14 and ema 21.
Remember this is not an investment recommendation this script is for educational purposes only.
If you like the script please follow me this helps a lot and you can also follow me this would help me a lot to keep uploading videos and new scripts for the community.

Weird Renko StratThis strategy uses Renko, it generates a signal when there is a reversal in Renko. When using historical data, it provides a good entry and an okay exit. However, in a real-time environment, this strategy is subject to repaint and may produce a false signal.
As a result, the backtesting result should not be used as a metric to predict future results. It is highly recommended to forward-test the strategy before using it in real trading. I forward test it from 12/18/2022 to 12/21/2022 in paper trading, using the alert feature in Tradingview. I made 60 trades trading the BTCUSDT BINANCE 3 min with 26 as the param and under the condition that I use 20x margin, compounding my yield, and having 0 trading fee, a steady loss is generated: from $10 to $3.02.
This is quite interesting. As if I flip the signal from "Long" to "Short" and another way too, it will be a steady profit from $10 to $21.85. Hence, if I'm trying to anti-trade the real-time alert signal, the current "4 Days Result" will be good. Nevertheless, I still have to forward-test it for longer to see if it will fail eventually.
Dive into the setting of the strategy
- Margin is the leverage you use. 1 means 1x, 10 means 10x. It affects the backtest yield when you backtest
- Compound Yield button is for compound calculation, disable it to go back to normal backtesting
- Anti Strategy button is to do the opposite direction trade, when the original strat told you to "Long", you "Short" instead. Enable it to use the feature
- Param is the block size for the Renko chart
- Drawdown is just a visual tool for you in case you want to place a stop loss (represent by the semitransparent red area in the chart)
- From date Thru Date is to specify the backtest range of the strategy, This feature is turned off by default. It is controlled by the Max Backtest Timeframe which will be explain below
- Max Backtest Timeframe control the From date Thru Date function, disable it to enable the From Date Thru Date function
Param is the most important input in this strategy as it directly affects performance. It is highly recommended to backtest nearly all the possible parameters before deploying it in real trading. Some factors should be considered:
- Price of the asset (like an asset of 1 USD vs an asset of 10000 USD required different param)
- Timeframe (1-minute param is different than 1-month param)
I believe this is caused by the volatility of the selected timeframe since different timeframe has different volatility. Param should be fine-tuned before usage.
Here is the param I'm using:
BTCUSDT BINANCE 3min: 26
BTCUSDT BINANCE 5min: 28
BTCUSDT BINANCE 1day: 15
Background of the strategy:
- The strategy starts with $10 at the start of backtesting (customizable in setting)
- The trading fee is set to 0.00% which is not common for most of the popular exchanges (customizable in setting)
- The contract size is not a fixed amount, but it uses your balance to buy it at the open price. If you are using the compound mode, your balance will be your current total balance. If you are using the non-compound mode, it will just use the $10 you start with unless you change the amount you start with. If you are using a margin higher than 1, it will calculate the corresponding contract size properly based on your margin. (Only these options are allowed, you are not able to change them without changing the code)
