Bollinger Bands Difference Score
Bollinger Bands Difference Score (TradingView – Pine Script v6)
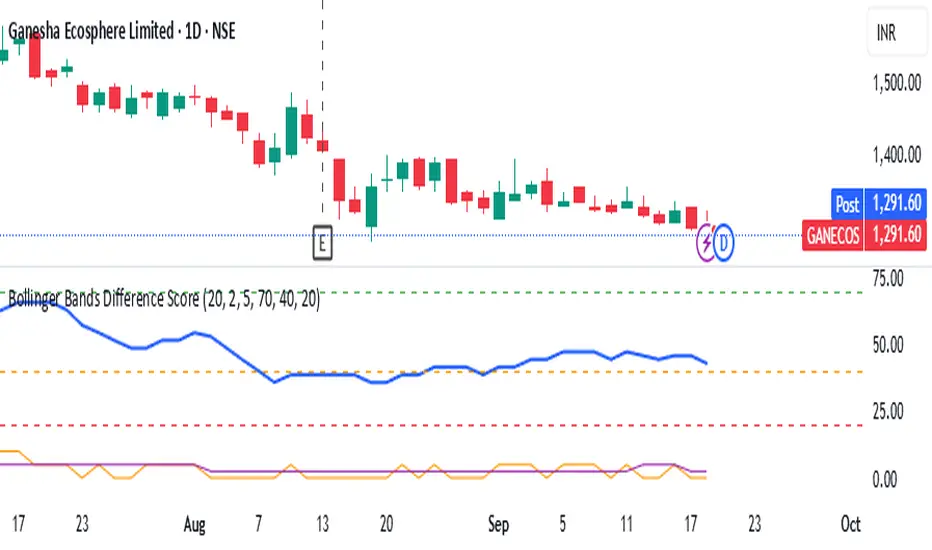
The **Bollinger Bands Difference Score** is a volatility-based scoring system designed to help traders quickly assess whether a stock is in a **strong trend, neutral zone, or weak setup**. It transforms the raw **Bollinger Band Width (BB-Diff)** into a **normalized score (0–100)** and classifies conditions with intuitive thresholds.
---
### 🔹 What is Bollinger Bands Difference (BB-Diff)?
* **Bollinger Bands** are built from a moving average with upper and lower bands set by standard deviations.
* The **difference (or width)** between the bands reflects market volatility.
* A **high difference** = wide bands = strong volatility (breakout/trend).
* A **low difference** = narrow bands = low volatility (consolidation).
This indicator standardizes BB-Diff into a score and smooths it for cleaner signals.
---
### 🔹 Key Features
1. **BB-Diff Scoring System**
* Converts Bollinger Band width into a **0–100 normalized score**.
* Higher score → higher volatility/trend strength.
* Lower score → consolidation or weaker momentum.
2. **Signal Levels**
* **Strong Zone (≥ 70):** Indicates strong trend strength or expansion in volatility.
* **Neutral Zone (40–70):** Sideways or undecided price action.
* **Weak Zone (≤ 20):** Suggests very low volatility, potential upcoming squeeze.
3. **Score Smoothing**
* Applies a moving average to reduce noise.
* Helps avoid false signals during choppy markets.
4. **Visual Enhancements**
* Plots the score as a line (0–100 scale).
* Adds horizontal reference lines for **Strong**, **Neutral**, and **Weak** levels.
* Background colors automatically highlight **bullish strength (green)** or **weakness (red)**.
---
### 🔹 How to Use
* **Trend Confirmation:**
Look for scores **above 70** → suggests trend continuation or volatility breakout.
* **Consolidation Watch:**
Scores in the **20 or below** zone may precede volatility squeezes → breakout setups.
* **Neutral Zone:**
Scores between **40–70** suggest sideways price action; avoid aggressive trades.
* **Combine with Price Action:**
Use with support/resistance, candlestick patterns, or momentum indicators for confirmation.
---
### 🔹 Best Practices
* Great as a **volatility filter** before entries.
* Use in combination with **RSI, MACD, or OBV** for directional bias.
* Works well for **breakout trading** (when score rises from low levels).
* Monitor on multiple timeframes for alignment.
---
✅ **In summary:** The **Bollinger Bands Difference Score** is a simple yet powerful tool that quantifies volatility strength into an actionable score, making it easier to spot strong trends, consolidation phases, and potential breakout opportunities.
在腳本中搜尋"弘历投教boll指标代码分析"
Bollinger Bands With Squeeze [Nic]Bollinger bands with color indicators to detect two key scenarios :
- The squeeze (yellow) detects a potential breakout (or down) in price volatility.
- The extreme overbought / over sold conditions. This happens during a 'band ride'.
"There is nothing more beautiful than when a stock becomes overbought, and stays overbought" - John Bollinger

Bollinger Bands, multi toolBollinger bands multi tool.
The user is allowed to turn on/off four sets of bollinger bands.
The calculation uses simple moving average as default.
However have other options:
Basis options:
options : "SMA", "EMA", "WMA", "VWMA", "SMMA", "DEMA", "TEMA", "HullMA", "LSMA", "VWAP"
Basis can be turned on/off.
The tool allows the user to adjust standard deviation and period.
Two bands with same timeframe as used on chart.
Two bands with option to choose different timeframe.
Very powerfull tool to identify important pivots in volatility analysis.
But can also be used to identify

Bollinger Bands with Ema and Two DeviationBollinger Bands with Ema calculation. Based on high and low valus of candle. Also can be used two deviation for both upper and lower bands.
Bollinger band 1+2Bollinger band with 1 and 2 standard deviation
Default with 21 SMA
Also count number of candlesticks of previous trend when crossing 1 standard deviation


Bollinger bubble | Forex editionBollinger bubble is an edition for forex market. Work better en JPY pairs.
We buy when a candle open & close outside the lower bollingers band and we target the last highest point on the last 10 candles.
And we sell when a candle open & close outside the higher bollingers band we the target the last lowest point on the last 10 candles.

Bollinger bubble | Stock EditionBollinger bubble is an edition for market like CAC40, DJ30, ..
The market are uptrend with the inflation, this edition only buy (you have less risk then sell)
We buy when a candle open & close outside the lower bollingers band and we target the last highest point on the last 10 candles.

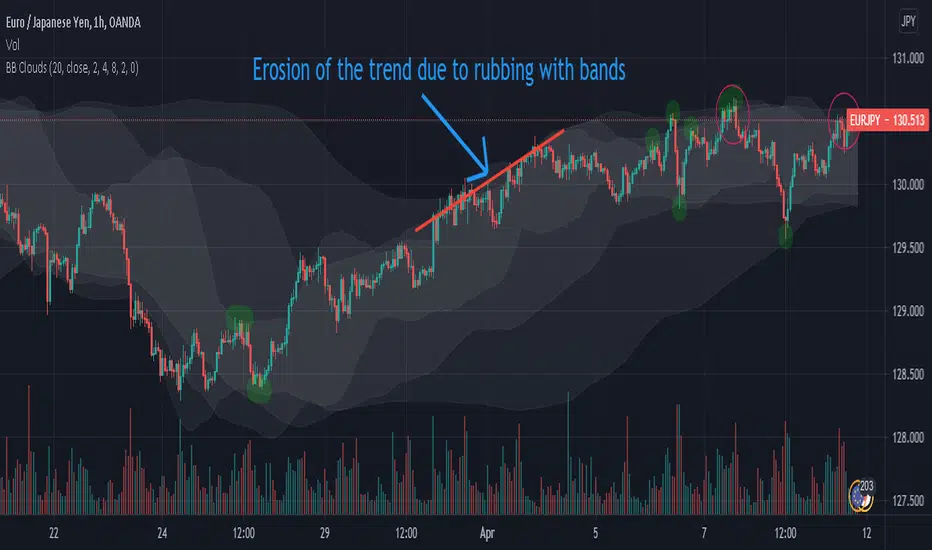
Bollinger Bands Clouds - BB CloudsBollinger Bands Clouds provides Bollinger Bands of different timeframes in a chart.
It actually shows BB from a new angles.
This indicator can show three BB from different timeframes simultaneously.
The idea is to be able to combine different levels of BB from other timeframes in one chart
Each cloud is a Bollinger band whose time frame is a multiple of the current chart time frame. If this multiplier is set to 1, its Bollinger bands will be drawn for the current time frame and will be no different from normal Bollinger bands.
This indicator can be suitable for fractal perspective.
Multipliers can be changed from within the indicator settings:
settings -> mult1, mult2 and mult3
For a dark theme, enable the Dark Theme option from the indicator settings.
Bollinger Bands with Moving Averages and MTFBollinger Bands basically use SMA, here I revised it for use with many moving averages. Moving average types I have added: "EMA", "RMA", "SMA", "WMA", "VWMA", "WWMA", "TMA", "VAR", "ZLEMA", "TSF".
There is also an MTF option to view different time zones.
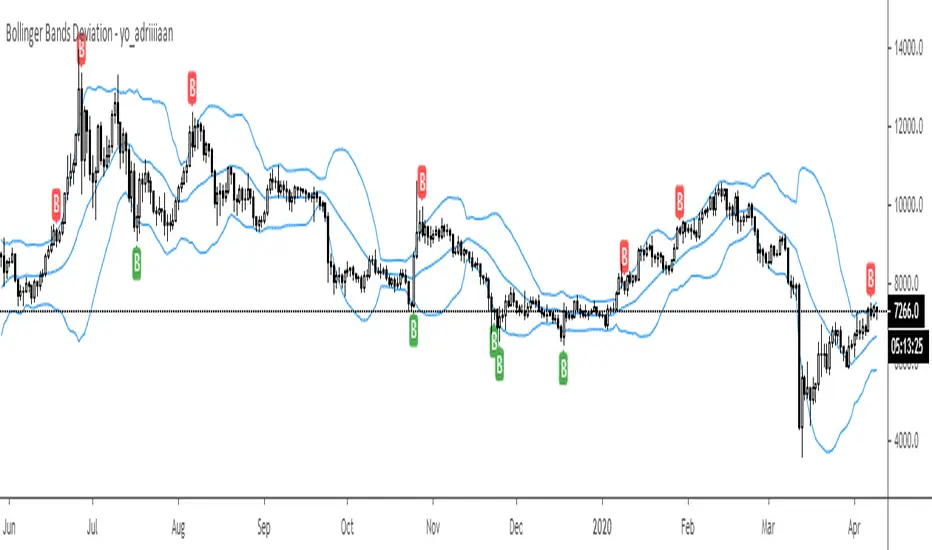
Bollinger Bands Deviation - yo_adriiiiaanBollinger Band Deviations
In theory price trades within 2 standard deviations 95% of the time. This is an attempt to capture that 5% that deviates from the bands.
Useful for taking profit or signaling a reversal.
Bollinger Bands Plus [xdecow]Bollinger bands with the option to use different types of moving averages.
-SMA
-EMA
-RMA
-WMA
-VWMA
-SWMA
-DEMA
-HMA
-SMMA
-T3
-TEMA

Bollinger band (band display 5σ)Set the color for each bands and indicate the Bollinger bands.
In order to indicate with simple moving average line,hide the bollonger bands line and set the color for bands.
ボリンジャーバンドの帯域ごとに色を設定して表示します。
単純移動平均線と同時表示しても見やすいように、ボリンジャーバンドの線を非表示にして、帯域に色を設定して表示することができます。

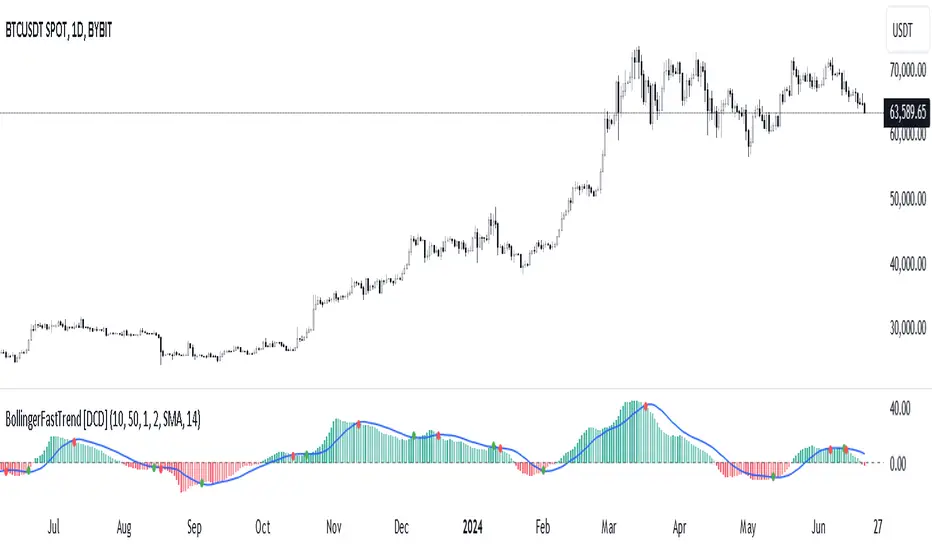
Bollinger Bands Fast Trend Indicator [DCD]Description:
The Bollinger Bands Fast Trend Detector indicator is an advanced tool designed to provide traders with more precise trend detection and clearer entry and exit signals. This script builds upon the traditional Bollinger Bands indicator by adding customizable standard deviations and incorporating multiple moving averages to enhance the accuracy of the signals.
Main Features:
1. **Customizable Bollinger Bands**:
- Each Bollinger Band has its own standard deviation setting, allowing for more granular control and better trend detection.
- The short Bollinger Band is set to a 10-period SMA for faster trend recognition.
2. **Multiple Moving Averages**:
- The indicator includes several types of moving averages (SMA, EMA, LSMA, HMA, WMA) applied to the Bollinger Trend value, giving traders flexibility to choose the best fit for their strategy.
3. **Crossover and Crossdown Detection**:
- The script identifies crossover and crossdown points between the Bollinger Trend value and the selected moving average, marking potential buy and sell signals with green and red circles, respectively.
4. **Color-Coded Histogram**:
- The histogram bars are color-coded to indicate the strength and direction of the trend, making it easy to visualize market conditions at a glance.
Instructions:
1. **Adding the Script to Your Chart**:
- Open your TradingView chart and add the Bollinger Bands Fast Trend Detector indicator.
2. **Adjusting Parameters**:
- Customize the Bollinger Bands and moving average settings according to your trading preferences:
- `Short BB Length` (default: 10): Adjusts the length of the short Bollinger Band.
- `Long BB Length` (default: 50): Adjusts the length of the long Bollinger Band.
- `StdDev` (for both bands): Sets the standard deviation multiplier.
- `Moving Average Type`: Choose between SMA, EMA, LSMA, HMA, and WMA.
- `Moving Average Length` (default: 14): Sets the length of the moving average.
3. **Interpreting the Output**:
- Observe the BBTrend and moving average plots on your chart.
- Look for green circles indicating crossover points (potential buy signals) and red circles indicating crossdown points (potential sell signals).
- Use the color-coded histogram bars to assess the strength and direction of the trend.
Configurable Parameters:
- `shortLengthInput` (default: 10): Length of the short Bollinger Band.
- `longLengthInput` (default: 50): Length of the long Bollinger Band.
- `shortDevMultInput` (default: 1.0): Standard deviation multiplier for the short Bollinger Band.
- `longDevMultInput` (default: 2.0): Standard deviation multiplier for the long Bollinger Band.
- `maTypeInput` (default: SMA): Type of moving average (options: SMA, EMA, LSMA, HMA, WMA).
- `maLengthInput` (default: 14): Length of the moving average.
Code Explanation:
The script calculates two sets of Bollinger Bands with distinct lengths and standard deviations. The difference between the lower bands and upper bands is normalized by the short middle band to compute the BBTrend value. A selected moving average is then applied to this BBTrend value. The script plots the BBTrend, the moving average, and uses color-coded histogram bars to represent trend strength and direction. It also identifies and marks crossover and crossdown points to provide potential trading signals.
Disclaimer:
This script is for educational purposes only and should not be considered financial advice. Always perform your own analysis before making any trading decisions.
Bollinger Bands HTF Hardcoded (Len 20 / Dev 2) [CHE]Bollinger Bands HTF Hardcoded (Len 20 / Dev 2) — Higher-timeframe BB emulation with bucket-based length scaling and on-chart diagnostics
Summary
This indicator emulates higher-timeframe Bollinger Bands directly on the current chart by scaling a fixed base length (20) via a timeframe-to-bucket multiplier map. It avoids cross-timeframe requests and instead applies the “HTF feel” by using a longer effective lookback on lower timeframes. Bands use the classic deviation of 2 and the original color scheme (Basis blue, Upper red, Lower green, blue fill). An on-chart table reports the resolved bucket, multiplier, and effective length.
Pine version: v6
Overlay: true
Primary outputs: Basis (SMA), Upper/Lower bands, background fill, optional info table
Motivation: Why this design?
Cross-timeframe Bollinger Bands typically rely on `request.security`, which can introduce complexity, mixed-bar alignment issues, and potential repaint paths depending on how users consume signals intrabar. This design offers a deterministic alternative: a single-series calculation on the chart timeframe, with a hardcoded “HTF emulation” achieved by scaling the BB length according to coarse higher-timeframe buckets. The result is a smoother, slower band structure on low timeframes without external timeframe calls.
What’s different vs. standard approaches?
Baseline: Standard Bollinger Bands with a fixed user length on the current timeframe, or true HTF bands via `request.security`.
Architecture differences:
Fixed base parameters: Length = 20, Deviation = 2.
Bucket mapping derived from the chart timeframe (or manually overridden).
No `request.security`; all computations occur on the current series.
Effective length is “20 × multiplier”, where multiplier approximates aggregation into the chosen bucket.
Diagnostics table for transparency (bucket, multiplier, resolved length, bandwidth).
Practical effect: On lower timeframes, the effective length becomes much larger, behaving like a higher-timeframe Bollinger structure (smoother basis and wider stability), while remaining purely local to the chart series.
How it works (technical)
The script first resolves a target bucket (“Auto” or a manual selection such as 60/240/1D/…/12M). It then computes a multiplier that approximates how many current bars fit into that bucket (e.g., 1m→60m uses mult≈60, 5m→60m uses mult≈12). The effective Bollinger length becomes:
`bb_len = 20 mult` (clamped to at least 1)
Using the effective length, it calculates:
`basis = ta.sma(src, bb_len)`
`dev = 2 ta.stdev(src, bb_len)`
`upper = basis + dev`
`lower = basis - dev`
A “bandwidth” diagnostic is also computed as `(upper-lower) / basis` (guarded against division by zero) and shown in the table as a percentage. A persistent table object is created/deleted based on the visibility toggle and updated only on the last bar for performance.
Parameter Guide
Source — Input series for the bands — Default: Close
Use close for classic behavior; smoother sources reduce responsiveness.
Bucket — HTF bucket selection — Default: Auto
Auto derives a bucket from the chart timeframe; manual selection forces the intended target bucket.
Offset — Plot offset — Default: 0
Shifts plots forward/back for visual alignment, displayed in the data window.
Table X / Table Y — Table anchor — Default: Right / Top
Places the diagnostics table in one of nine anchor points.
Table Size — Table text size — Default: Normal
Use small on dense charts, large for presentations.
Dark Mode — Table theme — Default: Enabled
Switches table palette for readability against chart background.
Show Table — Toggle diagnostics table — Default: Enabled
Disable for a cleaner chart.
Reading & Interpretation
Basis (blue): The moving average centerline of the bands (SMA of effective length).
Upper (red) / Lower (green): ±2 standard deviations around the basis using the same effective length.
Fill (blue tint): Visual band zone to quickly see compression/expansion.
Interpretation staples:
Price riding the upper band suggests strong bullish pressure; riding the lower band suggests strong bearish pressure.
Band expansion indicates rising volatility; contraction indicates volatility compression.
Mean reversion setups often key off the basis and re-entries from outside bands, while breakout/trend setups often key off sustained band rides.
Diagnostics table:
HTF Tag: Human-readable label showing the current timeframe → bucket mapping.
Bucket: The resolved target bucket (Auto result or manual selection).
Multiplier: The integer factor applied to the base length.
Len/Dev: Shows base length (20) and the effective length result plus deviation (2).
Bandwidth: Normalized width of the band (percent), useful for spotting squeezes.
Practical Workflows & Combinations
HTF context on LTF charts: Use this as “slow structure” bands on 1m–15m charts without requesting HTF data.
Squeeze detection: Watch bandwidth shrink to historically low levels, then look for break/hold outside bands.
Trend filtering: Favor long bias when price stays above the basis and repeatedly respects it; favor short bias when below.
Confluence: Combine with market structure (swing highs/lows), volume tools, or a trend filter (e.g., a longer MA) for confirmation.
Behavior, Constraints & Performance
Repaint/confirmation: No cross-timeframe requests. Values can still evolve intrabar and settle on close, as with any indicator computed on live bars.
History requirements: Very large effective lengths need sufficient historical bars; expect a warm-up period after loading or switching symbols/timeframes.
Known limits: Because the method approximates HTF behavior by scaling lookback, it is not identical to true HTF Bollinger Bands computed on aggregated candles. In particular, volatility and mean can differ slightly versus a real HTF series.
Sensible Defaults & Quick Tuning
Default workflow:
Bucket: Auto
Source: Close
Table: On (until you trust the mapping), then optionally off
If bands feel too slow on your timeframe: choose a smaller bucket (e.g., 60 instead of 240).
If bands feel too reactive/noisy: choose a larger bucket (e.g., 1D or 3D).
If chart looks cluttered: hide the table; keep only the bands and fill.
What this indicator is—and isn’t
This is a Bollinger Band visualization layer that emulates higher-timeframe “slowness” via deterministic length scaling. It is not a complete trading system and does not include entries, exits, sizing, or risk management. Use it as context alongside your execution rules and protective stops.
Disclaimer
The content provided, including all code and materials, is strictly for educational and informational purposes only. It is not intended as, and should not be interpreted as, financial advice, a recommendation to buy or sell any financial instrument, or an offer of any financial product or service. All strategies, tools, and examples discussed are provided for illustrative purposes to demonstrate coding techniques and the functionality of Pine Script within a trading context.
Any results from strategies or tools provided are hypothetical, and past performance is not indicative of future results. Trading and investing involve high risk, including the potential loss of principal, and may not be suitable for all individuals. Before making any trading decisions, please consult with a qualified financial professional to understand the risks involved.
By using this script, you acknowledge and agree that any trading decisions are made solely at your discretion and risk.
Do not use this indicator on Heikin-Ashi, Renko, Kagi, Point-and-Figure, or Range charts, as these chart types can produce unrealistic results for signal markers and alerts.
Best regards and happy trading
Chervolino.

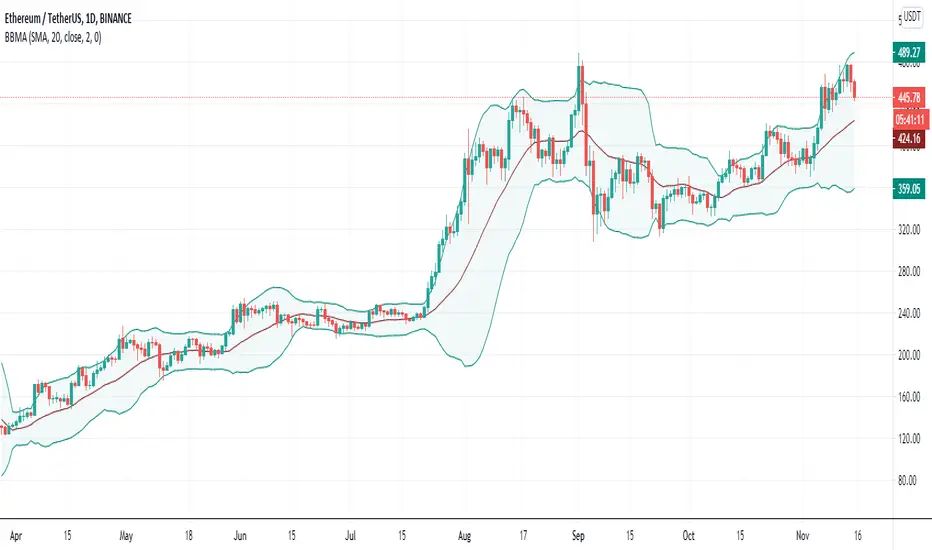
H BollingerBollinger Bands are a widely used technical analysis indicator that helps spot relative price highs and lows. The tool comprises three lines: a central band representing the 20-period simple moving average (SMA), and upper and lower bands usually placed two standard deviations above and below the SMA. These bands adjust with market volatility, offering insights into price fluctuations and trading conditions.
How this indicator works
Bollinger Bands helps traders assess price volatility and potential price reversals. They consist of three bands: the middle band, the upper band, and the lower band. Here's how Bollinger Bands work:
Middle band: This is typically a simple moving average (SMA) of the asset's price over a specified period. The most common period used is 20 days.
Upper band: This is calculated by adding a specified number of standard deviations to the middle band. The standard deviation measures the asset's price volatility. Commonly, two standard deviations are added to the middle band.
Lower band: Similar to the upper band, it is calculated by subtracting a specified number of standard deviations from the middle band.
What do Bollinger Bands tell you?
Bollinger bands primarily indicate the level of market volatility and trading opportunities. Narrow bands indicate low market volatility, while wide bands suggest high market volatility. Bollinger bands indicators can be used by traders to assess potential buy or sell signals. For instance, a sell signal may be interpreted or generated if the asset’s price moves closer or crosses the upper band, as it may indicate that the asset is overbought. Alternatively, a buy signal may be interpreted or generated if the price moves closer to the lower band, as it may signify that the asset is oversold.
However, traders should be cautious when using Bollinger Bands as standalone indicators when making trading decisions. Experienced traders refrain from confirming signals based on one indicator. Instead, they generally combine various technical indicators and fundamental analysis methods to make informed trading decisions. Basing trading decisions on only one indicator can result in misinterpretation of signals and heavy losses.
Bollinger Bands assist in identifying whether prices are relatively high or low. They are applied as a pair—upper and lower bands—alongside a moving average. However, these bands are not designed to be used in isolation. Instead, they should be used to validate signals generated by other technical indicators.
Calculation of Bollinger Band

Bollinger Blast Buy Unholy GrailThis strategy copy the Nick Radge's trading ideas for a profitable systems. He mentions a Bollinger Band idea which is also published in his book Unholy Grails. Nick says:
he strategy that we did test and showed very promising results was an entry using a Bollinger band and an exit using the opposite Bollinger band, but we use 3 standard deviations for the entry and 1 standard deviation for the exit, just to keep the trailing stop a little bit tighter.”
Entry: Buy on the Open the day after a stock closes above the top Bollinger Band
Exit: Exit on the Open the day after a stock closes below the lower Bollinger Band
Results tested on Nasdaq market are very good and better than simply buy& hold

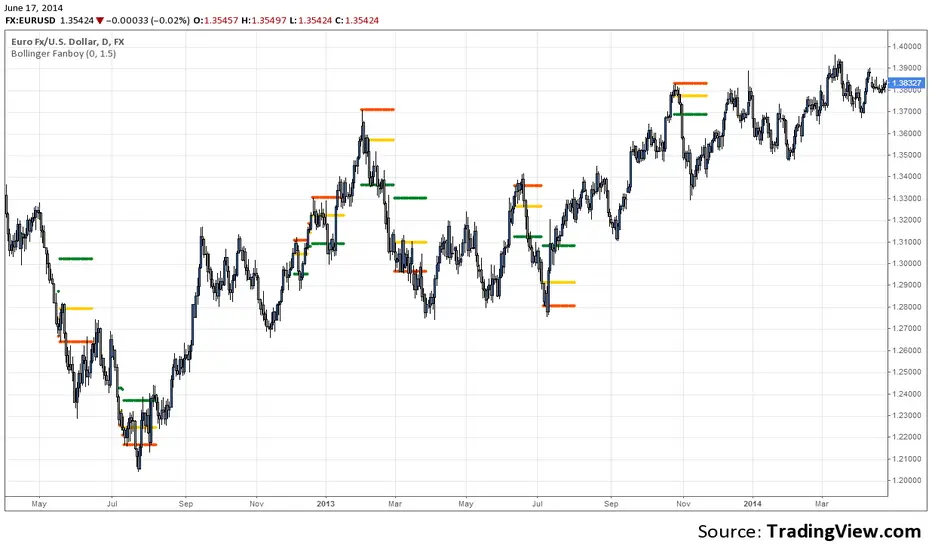
Bollinger Fanboy v4.0Set spread value from your broker, eg my broker has a spread of 0.0003 for EURUSD. You can set your required profit ratio eg 1.5 means risk 1 to win 1.5. Enter if price crosses orange (or set a buy stop order or sell limit order) and set stoploss at red and take profit at green. Setup lasts for 20 bars. If it doesn't cross the orange in that time, forget it. Long if red is below orange, short if red is above orange. Recommended to be used on 4H, D, W charts only. Use at your own risk. I cannot be held liable for any damages financial or otherwise, directly or indirectly related to using this script and trading strategy.
Copyright 2014 Michael Edwards (info@bollingerfanboy.com)
www.bollingerfanboy.com
Bollinger Bands Levels | VTS Pro📊 Bollinger Bands Levels | VTS Pro
by Alireza Mossaheb
This advanced Bollinger Bands indicator takes your technical analysis to the next level by providing dynamic price bands along with customizable horizontal levels and labels. Whether you're a trend trader or a mean reversion strategist, this tool adapts to your workflow.
🔧 Key Features:
Three Modes: Choose between Strong (20, 2), Weak (10, 1.5), or Custom settings for full control.
Multi-Timeframe Support: Plot Bollinger Bands from any higher or lower timeframe.
Multiple MA Types: Select from SMA, EMA, RMA (SMMA), WMA, and VWMA for the basis line.
Visual Enhancements:
Optional background fill between bands
Stylized horizontal lines with labels (Top/Mid/Low)
Customizable line style, width, and color
Smart Labeling: Automatically names levels based on timeframe and mode.
Improved Plot Logic: Line width bug fixed for smoother rendering across presets.
🧠 Ideal For:
Spotting volatility squeezes or expansions
Confirming support/resistance with upper/lower bands
Creating confluence zones using higher timeframe Bollinger levels

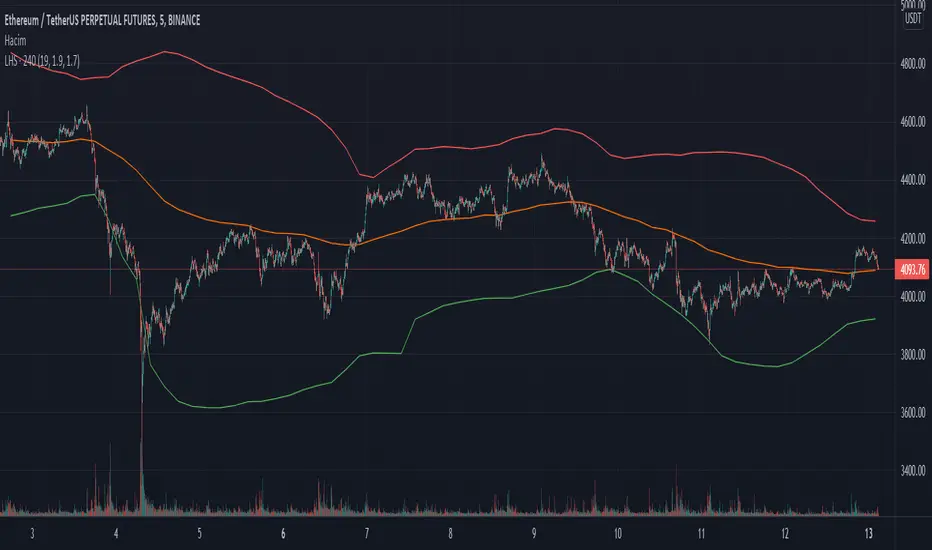
Bollinger but BetterA better Bollinger Band with an average of 20 EMAs as pivot price, which makes its standard deviation way more sensitive compared to traditional Bollinger Band.
-- My Tips --
Long flat convergence suggests a big potential price movement.
Short quick convergence of short supportive ema(default: 10days) and upper band suggests a safe middle entry point.
Recommended auxiliary indicator: Wavetrend by Lazybear, which points out entry and exit points quite accurately in bull market.
-- PS --
This system is a hybrid of EMA Ribbons and Bollinger Band.
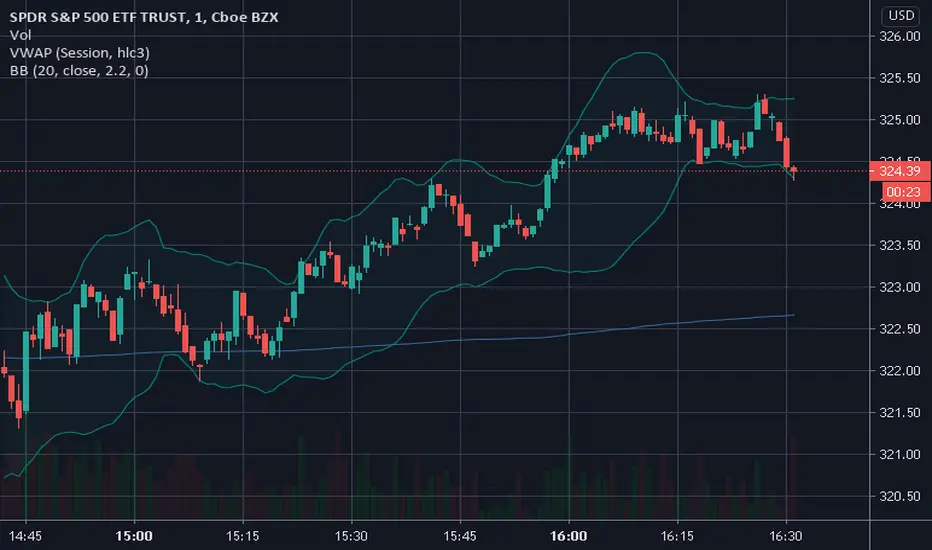
Bollinger Bands - Custom moving averageFormula for bollinger bands is as below:
Mid = sma(20)
Top = sma(20) + 2*StdDev(20)
Bottom = sma(20) - 2*StdDev(20)
While standard bollinger bands allow changing standard deviation and length, there is no option to use different moving average.
This indicator allows you to define bollinger bands based on different moving average types which can be selected from input.

Bollinger ratioSo this indicator is hybrid of MACD and Bollinger
The aim here is to see where the direction of the Bollinger is going to the zero up or down . if it above the zero line or bellow it
I add bullish area and bearish area by the ratio of donchian channel
