在腳本中搜尋"弘历投教boll指标代码分析"
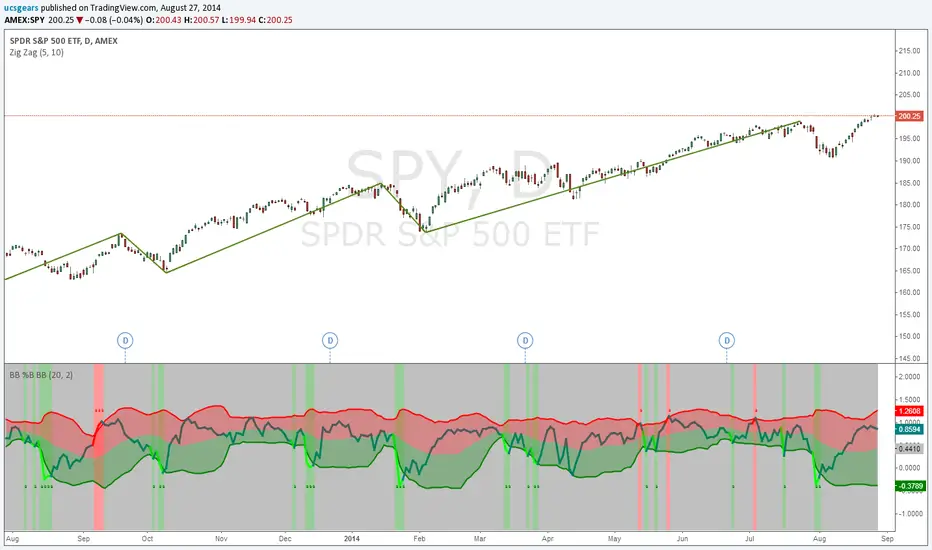
Bollinger Bands %B Bollinger Bands - Version 2Thanks to Chris Moody for his touch
List of All my Indicators - www.tradingview.com
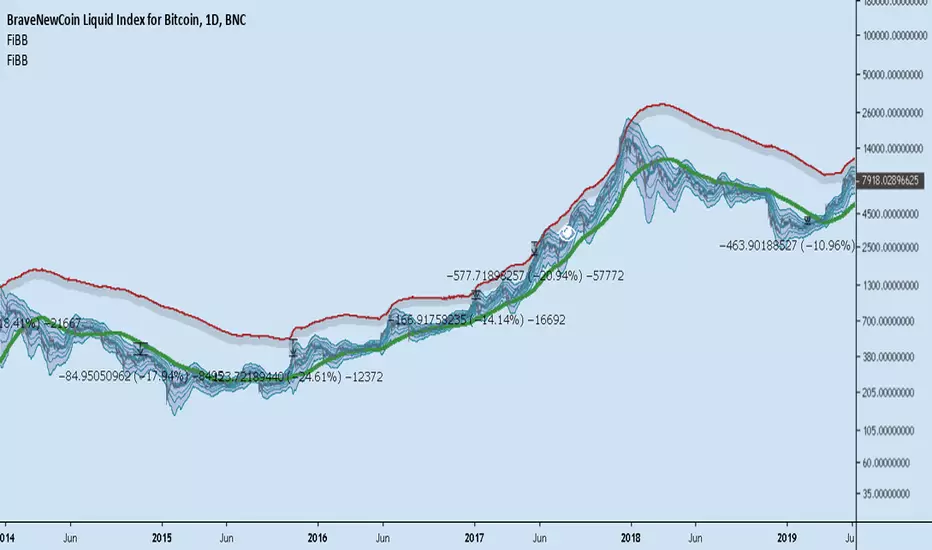
Bollinger Fanboy v3.0I can't be help liable for any losses suffered from the use of this script. Use at your own risk.

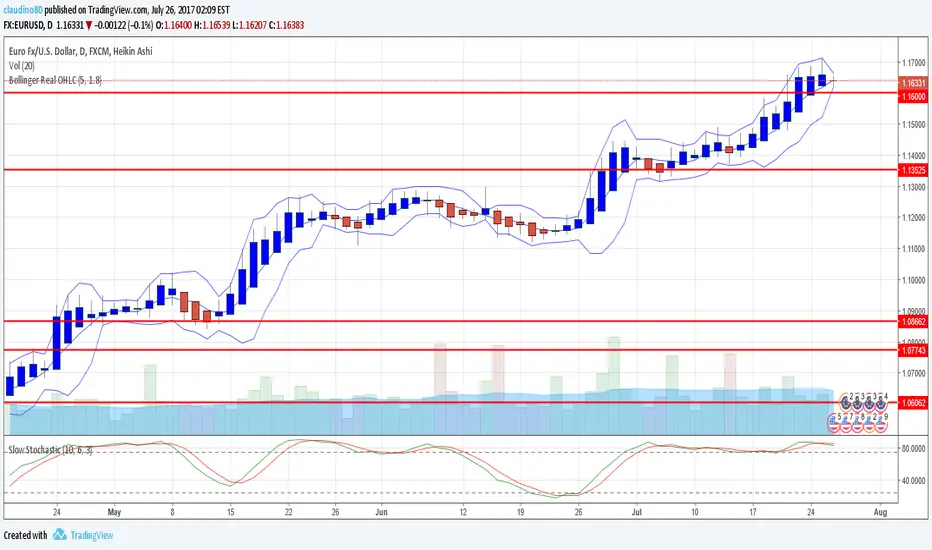
Bollinger Real OHLCThis uses the real OHLC not the one of the chart (useful for not standard chat like Heikin Ashi).
custom Bollinger bands with filters - indicator (AS)-----------Description-------------
This indicator is basically Bollinger bands with many ways to customize. It uses highest and lowest values of upper and lower band for exits. I think something is wrong with the script but cant find any mistakes – most probably smoothing. The ATR filter is implemented but is working incorrectly. In code you can also turn it into strategy but I do not recommend it for now as it is not ready yet.
So this is my first script and I am looking for any advice, ideas to improve this script, sets of parameters, markets to apply, logical mistakes in code or any ideas that you may have. Indicator was initially designed for EURUSD 5MIN but I would be interested in other ideas.
-----------SETTINGS--------------
---START - In starting settings we can choose
Line 1: what parts to use BB/DC/ATR
Line 2: what parts to plot on chart
Line 3 Whether or not apply smoothing to BB or ATR filter
Line 4 Calculate deviation for BB from price or Moving average
Line 5 Fill colors and plot other parts for debug (overlay=false)
Line 6:( for strategy) – enable Long/Short Trades
---BB and DC – here we modify Bollinger bands and Donchian
Line 1: Length and type of BB middle line and also length of DC from BB
Line 2: Length and type of BB standard deviation and multiplier
Line 3: Length and type of BB smoothing and %width for BB filter
---ATR filter – (not ready fully yet)
Line 1: type and length of ATR
Line 2: threshold and smoothing value of ATR
---DATE and SESSION
Line 1: apply custom date or session?
Line 2: session hours settings
Line 3:Custom starting date
Line 4: Custom Ending date
-----------HOW TO USE--------------
We open Long if BB width is bigger than threshold and close when upper band is no longer highest in the period set. Exact opposite with Short

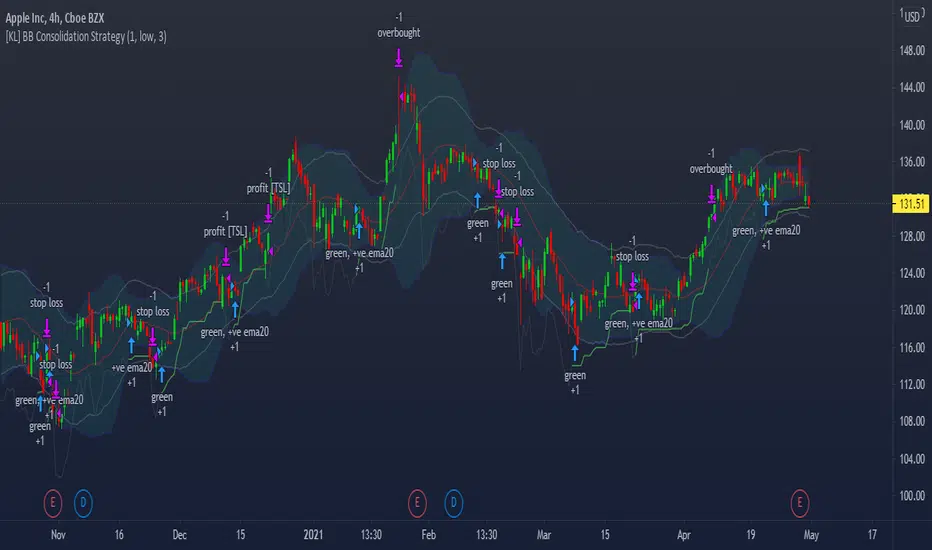
[KL] Bollinger Bands Consolidation StrategyThis strategy will enter into long position based on the volatility of prices implied by indicators of (a) Bollinger bands, and (b) ATR.
Application of Bollinger bands ("BOLL")
Using plain vanilla settings for BOLL (i.e. 20 period moving average, and 2 standard deviations of closing prices), we are interested to know about the shape of the area that is bounded by the upper and lower bands.
In theory, consolidation happens when volatility of price decreases. Visually speaking, this is represented by the narrowing of the upper/lower bands. This strategy considers the narrowing of BOLL bands as the primary indicator for long-entry.
Application of ATRs (as confirmations)
Firstly, to confirm that BOLL bands are narrowing (as mentioned above), the ATR at a potential point of entry is compared against the standard deviation of prices over BOLL's lookback periods. Once again, visualizing the shape of BOLL bands during consolidation, we assume the lines begin to squeeze when the distance between the center line and upper/lower band is less than two current ATRs.
Secondly, this strategy looks into the moving average of ATRs to assure that prices are not too choppy when entering into market. If the moving average of ATR decreases at a point in time such that all the above conditions are met, then we can assert that the volatility of price is decreasing.
Thirdly, ATR is used for determining the size of our trailing stop loss. We will keep the multiplier fixed at two.
Bollinger Band BreakoutIt is a long only strategy.
1. Buy when price breaks out of the upper band.
2. Exit has two options. Option 1 allows you to exit using lower band. Option 2 allows you to exit using moving average.
3. Option 1 preferred over option 2 if the instrument is highly volatile.
4. Slippage and commissions are not considered in the return calculation.

ViVen-Multi Time Frame Bollinger Band StrategyThis indicator created to identify the strong Support and Resistance levels based on the Bollinger Bands. When two different time frame Bollinger Bands are travelling together then its a strong Support or Resistance Levels.
I have added 5 Min, 15 Min, 30 Min, 1 Hr and 1 Day time frame Bollinger Bands in one Chart. You can select and combine whichever the TF you want.
Default values considered - Period - 20 and Std.Dev is 2
You can on/off the indicator based on the requirement.
Trade plan:
BUY - When price comes near to the Bottom Bollinger Band level (look for candle confirmation is plus). If multiple Bollinger bands travels together then is Strong Support. (Exit if Price Breaks down the BB)
SELL - When price reaches the Upper Bollinger Band level (look for candle confirmation is plus). If multiple Bollinger bands travels together then is Strong Support. (Exit if Price Breaks Up the BB)
Middle Line - is the 20 SMA line
When the Gap between Upper and Lower Band is narrow then we can expect a trending movement soon.

two BollingersThe Double Bollinger Band consists of an average and two Bollingers and two backgrounds, each of which has separate settings and can be approved more strongly for trades. Moves and vice versa. With the price chart coming out of the second band, the price is much more likely to move in the same direction.
To use this feature, we had to use two Bollinger indicators with different settings at the same time, but we no longer need to do this with the Double Bollinger .
Its main use is crypto, but it can be used in all markets

Dual Bollinger Band Mean ReversionSimple but solid mean reversion indicator with sl and tp levels. Most of the code is based on the built in bollinger bands script. Designed for scalping 1-5 minute timeframes.
The indicator consists of two sets of bollinger bands.
Price has to close below the lower (fast) bollinger band, above the moving average of the (slower) bollinger band.
If price now closes above the lower (fast) bb, the indicator draws a label at the open of the next candle (which would be a potential entry point). Take profit becomes the upper bollinger band, stop loss the same distance below the open of the candle.
I've built in a simple backtesting function that calculates the potential win/loss-ratio. Loss and profit levels are 1:1. Exit strategy could be improved on.
Adjusting the lengths depending on the asset proves to be a good idea.
The slower bollinger bands can help to identify ranging markets and/or trends following regular bollinger bands theory.
Feel free to comment with any changes that you'd like to be made.

Ichimoku Cloud and Bollinger Bands (by Coinrule)The Ichimoku Cloud is a collection of technical indicators that show support and resistance levels, as well as momentum and trend direction. It does this by taking multiple averages and plotting them on a chart. It also uses these figures to compute a “cloud” that attempts to forecast where the price may find support or resistance in the future.
The Ichimoku Cloud was developed by Goichi Hosoda, a Japanese journalist, and published in the late 1960s. It provides more data points than the standard candlestick chart. While it seems complicated at first glance, those familiar with how to read the charts often find it easy to understand with well-defined trading signals.
The Ichimoku Cloud is composed of five lines or calculations, two of which comprise a cloud where the difference between the two lines is shaded in.
The lines include a nine-period average, a 26-period average, an average of those two averages, a 52-period average, and a lagging closing price line.
The cloud is a key part of the indicator. When the price is below the cloud, the trend is down. When the price is above the cloud, the trend is up.
The above trend signals are strengthened if the cloud is moving in the same direction as the price. For example, during an uptrend, the top of the cloud is moving up, or during a downtrend, the bottom of the cloud is moving down.
The Bollinger Bands are among the most famous and widely used indicators. A Bollinger Band is a technical analysis tool defined by a set of trendlines plotted two standard deviations (positively and negatively) away from a simple moving average ( SMA ) of a security's price, but which can be adjusted to user preferences. They can suggest when an asset is oversold or overbought in the short term, thus providing the best time for buying and selling it.
This strategy combines the Ichimoku Cloud with Bollinger Bands to better enter trades.
Long orders are placed when these basic signals are triggered.
Long Position:
Tenkan-Sen is above the Kijun-Sen
Chikou-Span is above the close of 26 bars ago
Close is above the Kumo Cloud
The closing price is greater than the upper standard deviation of the Bollinger Bands
Short Position:
Tenkan-Sen is below the Kijun-Sen
Chikou-Span is below the close of 26 bars ago
Close is below the Kumo Cloud
The upper standard deviation of the Bollinger Band is greater than the closing price
The script is backtested from 1 January 2022 and provides good returns.
The strategy assumes each order is using 30% of the available coins to make the results more realistic and to simulate you only ran this strategy on 30% of your holdings. A trading fee of 0.1% is also taken into account and is aligned to the base fee applied on Binance.
This script also works well on BTC 30m/1h, ETH 2h, MATIC 2h/30m, AVAX 1h/2h, SOL 45m timeframes

Waddah Attar Explosion V3 [NHK] -Bollinger - MACDWaddah Attar Explosion Version3 indicator to work in Forex and Crypto, This indicator oscillates above and below zero and the Bollinger band is plotted over the MACD Histogram to take quick decisions, Colors are changed for enhanced look. dead zone is plotted in a background area and option is provided to hide dead zone. One can easily detect sideways market movement using Bollinger band and volume. when volume is in between Bollinger band no trades are to be taken as volume is low and market moving in sideways
credits to: @shayankm and @LazyBear
Read the main description below...
- - - - - - - - - - - - - - - - - - - - - - - - - - - - - - - - - - - - - - -
This is a port of a famous MT4 indicator. This indicator uses MACD /BB to track trend direction and strength. Author suggests using this indicator on 30mins.
Explanation from the indicator developer:
"Various components of the indicator are:
Dead Zone Line: Works as a filter for weak signals. Do not trade when the up or down histogram is in between Dead Zone.
Histograms:
- Pink histogram shows the current down trend.
- Blue histogram shows the current up trend.
- Sienna line / Bollinger Band shows the explosion in price up or down.
Signal for ENTER_BUY: All the following conditions must be met.
- Blue histogram is raising.
- Blue histogram above Explosion line.
- Explosion line raising.
- Both Blue histogram and Explosion line above DeadZone line.
Signal for EXIT_BUY: Exit when Blue histogram crosses below Explosion line / Bollinger Band.
Signal for ENTER_SELL: All the following conditions must be met.
- Pink histogram is raising.
- Pink histogram above Explosion line.
- Explosion line raising.
- Both Pink histogram and Explosion line above DeadZone line.
Signal for EXIT_SELL: Exit when Pink histogram crosses below Explosion line.
All of the parameters are configurable via options page. You may have to tune it for your instrument.

Advanced RSI-ADX-Bollinger Market Overview DashboardStudy Material: Advanced RSI–ADX–Bollinger Market Overview Dashboard
This dashboard is a comprehensive trading tool designed to combine three powerful technical analysis methods—RSI (Relative Strength Index), ADX (Average Directional Index), and Bollinger Bands—into one unified system with live table output and progress indicators. It aims to provide a complete market snapshot at a glance, helping traders monitor momentum, volatility, trend, and market signals.
________________________________________
🔹 Core Concepts Used
1. RSI (Relative Strength Index)
• RSI measures market momentum by comparing price gains and losses.
• A high RSI indicates overbought conditions (possible reversal or sell zone).
• A low RSI indicates oversold conditions (possible reversal or buy zone).
• In this dashboard, RSI is also represented with progress bars to show how far the current value is moving toward extreme zones.
2. ADX (Average Directional Index)
• ADX is used to gauge the strength of a trend.
• When ADX rises above a threshold, it signals a strong trend (whether bullish or bearish).
• The system checks when ADX momentum crosses above its threshold to confirm whether a signal has strong backing.
3. Bollinger Bands
• Bollinger Bands measure volatility around a moving average.
• The upper band indicates potential overbought pressure, while the lower band shows oversold pressure.
• Expansion of the bands signals rising volatility, contraction shows calming markets.
• This tool also assigns a BB Trend Label: Expand ↑ (bullish), Contract ↓ (bearish), or Neutral →.
________________________________________
🔹 What This Dashboard Tracks
1. Signal Generation
o BUY Signal: RSI oversold + price near lower Bollinger Band + ADX strength confirmation.
o SELL Signal: RSI overbought + price near upper Bollinger Band + ADX strength confirmation.
o Labels are plotted on the chart to indicate BUY or SELL points.
2. Trend Direction & Strength
o The script analyzes short- and medium-term moving averages to decide whether the market is Bullish, Bearish, or Flat.
o An arrow symbol (↑, ↓, →) is shown to highlight the trend.
3. Signal Performance Tracking
o Once a BUY or SELL signal is active, the dashboard tracks:
Maximum profit reached
Maximum loss faced
Whether the signal is still running or closed
o This gives the trader performance feedback on past and ongoing signals.
4. Volume Analysis
o Volume is split into Buy Volume (candles closing higher) and Sell Volume (candles closing lower).
o This provides insight into who is in control of the market—buyers or sellers.
5. Comprehensive Data Table
o A professional table is displayed directly on the chart showing:
RSI Value
ADX Strength
Buy/Sell Volumes
Trend Direction
Bollinger Band Trend
Previous Signal Performance (Max Profit / Max Loss)
Current Signal Performance (Max Profit / Max Loss)
Symbol Name
o Each metric is color-coded for instant decision-making.
6. Progress Indicators
o RSI Progress Bar (0–100 scale).
o ADX Progress Bar (0–50 scale).
o Bollinger Band Expansion/Contraction progress.
o Signal profit/loss progress visualization.
7. Market Status Summary
o The dashboard issues a status label such as:
🔴 SELL ACTIVE
🔵 BUY ACTIVE
🟢 BULL MARKET
🔴 BEAR MARKET
🟡 NEUTRAL
________________________________________
🔹 Practical Use Case
This dashboard is ideal for traders who want a consolidated decision-making tool. Instead of monitoring RSI, ADX, and Bollinger Bands separately, the system automatically combines them and shows signals, trends, volumes, and performance in one view.
It can be applied to:
• Intraday Trading (short-term moves with high volatility).
• Swing Trading (holding positions for days to weeks).
• Trend Confirmation (identifying when to stay in or exit trades).
________________________________________
⚠️ Strict Disclaimer (aiTrendview Policy)
• This script is a research and educational tool only.
• It does NOT guarantee profits and must not be used as a sole decision-making system.
• Past performance tracking inside the dashboard is informational and does not predict future outcomes.
• Trading involves significant financial risk, including potential loss of all capital.
• Users are fully responsible for their own trading decisions.
________________________________________
🚫 Misuse Policy (aiTrendview Standard)
• Do not misuse this tool for false claims of guaranteed profits.
• Redistribution, resale, or repackaging under another name is strictly prohibited without aiTrendview permission.
• This tool is intended to support disciplined trading practices, not reckless speculation.
• aiTrendview does not support gambling-style use or over-leveraging based on this script.
________________________________________
👉 In short: This system is a professional decision-support tool that integrates RSI, ADX, and Bollinger Bands into one dashboard with signals, performance tracking, and progress visualization. It helps traders see the bigger picture of market health—but the responsibility for action remains with the trader.
________________________________________

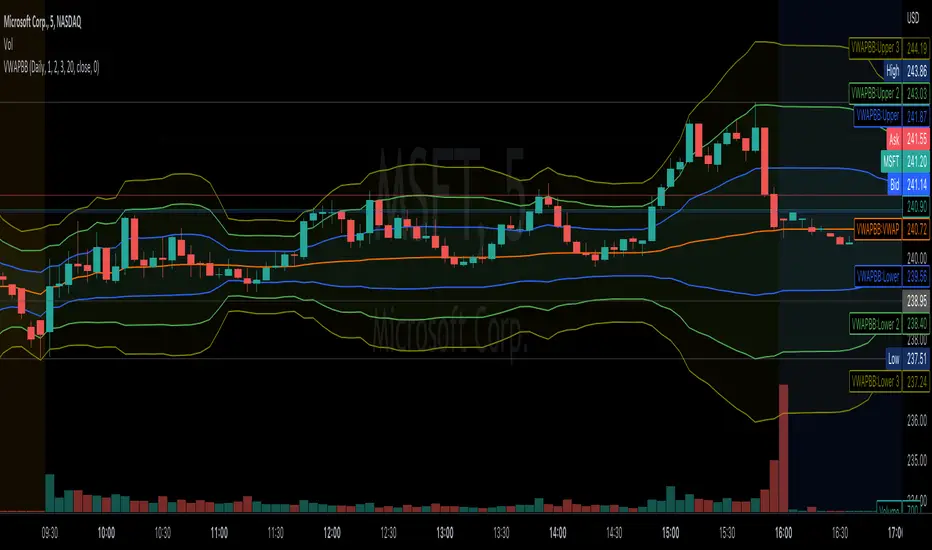
VWAP Bollinger BandsWhat makes this different from vwap bands / bollinger bands?
This indicator takes a bit of inspiration from bollinger but instead of utilizing built in pine script std dev that uses simple moving average internally, this version replaces that with vwap.
Also instead of traditional bollinger band basis of 20 period simple moving average, the basis here for the bands is the vwap.
How to use it?
Usage is similar to vwap itself, though the standard deviation bands will expand and contract like normal bollinger bands instead of vwap bands that just widen as the market movement continues. The bands tell a slightly different story from bollinger bands as the underlying data utilized is the vwap itself.
Which markets is this meant for?
Any market.
What conditions?
This aids in finding conditions of entry standard to vwap, but the bands could give key areas of focus for entries and exits better than standard bollinger bands or vwap bands.
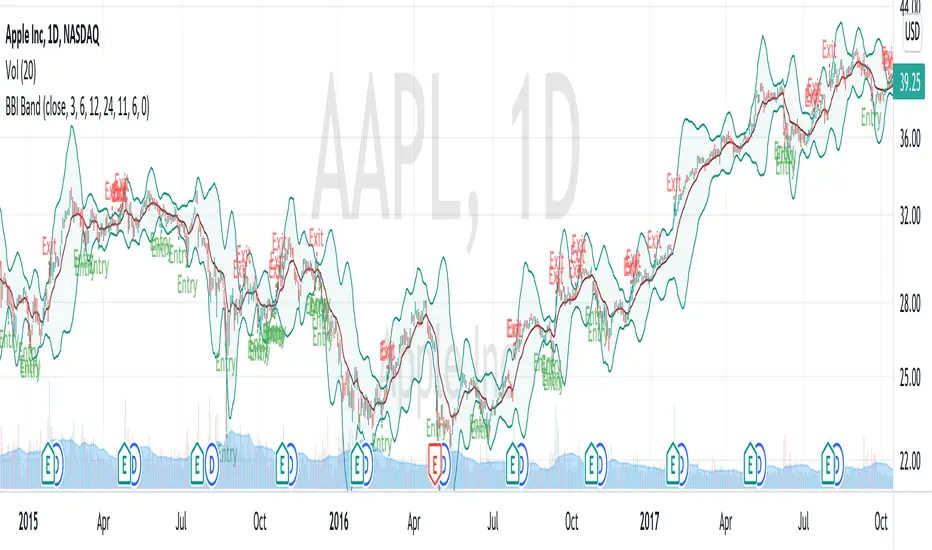
BBI Bollinger BandsBBI (Bull and Bear Index) is an indicator aims on measuring the general short/mid-term (< 1 month) trend and sentiment of the stock/market. It used an average of 4 SMAs (3, 6, 12, 24) as a cut-off of a bullish/bearish trend. In general, YMMV, you can enter when close> BBI and exit when close
BBSS - Bollinger Bands Scalping SignalsModified Bollinger Bands Indicator
Added:
- color change divergence (green) and narrowing (red) of the upper and lower bands
- color change of the moving average - upward trend (green) and downward trend (red)
- the appearance of a potential signal for long and short positions when the candle closes behind the upper or lower bands.
How to use the indicator:
Long conditions:
- the price breaks through the upper band
- Bollinger bands are expanding and should be green
- the mid-line is green
- the trigger candle should be green
Short conditions:
- the price breaks through the lower band
- Bollinger bands are expanding and should be red
- the mid-line is red
- the trigger candle should be red

Williams %R w/ Bollinger Bands [Loxx]Williams %R w/ Bollinger Bands is a Williams %R indicator with Bollinger bands. The Bollinger bands are used to determine when breakouts/breakdowns occur.
What is Williams %R?
Williams %R , also known as the Williams Percent Range, is a type of momentum indicator that moves between 0 and -100 and measures overbought and oversold levels. The Williams %R may be used to find entry and exit points in the market. The indicator is very similar to the Stochastic oscillator and is used in the same way. It was developed by Larry Williams and it compares a stock’s closing price to the high-low range over a specific period, typically 14 days or periods.
Included:
bar coloring
signals
alerts

Advanced Bollinger Bands StrategyAdvanced Bollinger Bands Strategy
Why is it an advanced Bollinger Bands Strategy?
The purpose of Bollinger Bands is to provide a relative definition of high and low prices of a market. By definition, prices are high at the upper band and low at the lower band. This definition can aid in rigorous pattern recognition and is useful in comparing price action to the action of indicators to arrive at systematic trading decisions. Adding a Moving Average filter which only allows trades if MA and Price are outside of the BB increases the probability of profitable trades with the sacrifice of a lower trade-frequency.
Inputs for Bollinger Bands
-> BB Source
-> BB Length
-> BB Multiplier
-> Moving Average Period
-> Moving Average Source
-> Strategy Condition Options:
-> Exit Trades if Price crosses Basis Line
-> Enable Moving Average Filter

Regression Fit Bollinger Bands [Spiritualhealer117]This indicator is best suited for mean reversion trading, shorting at the upper band and buying at the lower band, but it can be used in all the same ways as a standard bollinger band.
It differs from a normal bollinger band because it is centered around the linear regression line, as opposed to the moving average line, and uses the linear regression of the standard deviation as opposed to the standard deviation.
This script was an experiment with the new vertical gradient fill feature.

Sideways Strategy DMI + Bollinger Bands (by Coinrule)Markets don’t always trade in a clear direction. At a closer look, most of the time, they move sideways. Relying on trend-following strategies all the time can thus lead to repeated false signals in such conditions.
However, before you can safely trade sideways, you have to identify the most suitable market conditions.
The main features of such strategies are:
Short-term trades, with quick entries and quick exits
Slightly contrarian and mean-reversionary
Require some indicator that tells you it’s a sideways market
This Sideways DMI + Bollinger Bands strategy incorporates such features to bring you a profitable alternative when the regular trend-following systems stop working.
ENTRY
1. The trading system requires confirmation for a sideways market from the Directional Movement Index (DMI) before you can start opening any trades. For this purpose, the strategy uses the absolute difference between positive and negative DMI, which must be lower than 20.
2. To pick the right moment to buy, the strategy looks at the Bollinger Bands (BB). It enters the trade when the price crosses over the lower BB.
EXIT
The strategy then exits when the move has been exhausted. Generally, in sideways markets, the price should revert lower. The position is closed when the price crosses back down below the upper BB.
The best time frame for this strategy based on our backtest is the 1-hr. Shorter timeframes can also work well on certain coins that are more volatile and trade sideways more often. However, as expected, these exhibit larger volatility in their returns. In general, this approach suits medium timeframes. A trading fee of 0.1% is taken into account. The fee is aligned to the base fee applied on Binance, which is the largest cryptocurrency exchange.

RSI Divergences + Bollinger Bands█ OVERVIEW
Here's the RSI divergences with Bollingers bands.
█ CONCEPTS
5 features
1 — RSI
2 — Bollinger bands
3 — RSI signal is in another color when above 70 or below 30
4 — Looking for previous Divergences, Bullish, Bearish and Hidden Bullish and Bearish but I don't like Hidden divergences
5 — Color fill when overbuy or oversold
█ OTHER SECTIONS
I like to see it like a moutain, with snow on top and lake on bottom. I think you don't want to start walking at the top, nor sink to the bottom of the lake for ever and ever.
It is an idea of sjoerd , tip him if you like it.
An oscillator is good to know where we are in the trends, but it's not enough to run a small business of trading, you need to learn how to use it.
What is a divergence ?
Thanks to The rational investor for teaching me how to use this indicator.
Compare Crypto Bollinger Bands//This is not financial advice, I am not a financial advisor.
//What are volatility tokens?
//Volatility tokens are ERC-20 tokens that aim to track the implied volatility of crypto markets.
//Volatility tokens get their exposure to an asset’s implied volatility using FTX MOVE contracts.
//There are currently two volatility tokens: BVOL and IBVOL.
//BVOL targets tracking the daily returns of being 1x long the implied volatility of BTC
//IBVOL targets tracking the daily returns of being 1x short the implied volatility of BTC.
/////////////////////////////////////////////////////////////////
CAN USE ON ANY CRYPTO CHART AS BINANCE:BTCUSD is still the most dominant crypto, positive volatility for BTC is positive for all.
/////////////////////////////////////////////////////////////////
//The Code.
//The blue line (ChartLine) is the current chart plotted on in Bollinger
//The red line (BVOLLine) plots the implied volatility of BTC
//The green line (IBVOLLine) plot the inverse implied volatility of BTC
//The orange line (TOTALLine) plots how well the crypto market is performing on the Bolling scale. The higher the number the better.
//There are 2 horizontal lines, 0.40 at the bottom & 0.60 at the top
/////////To Buy
//1. The blue line (ChartLine) must be higher than the green line (IBVOLLine)
//2. The green line (IBVOLLine) must be higher than the red line (BVOLLine)
//3. The red line (BVOLLine) must be less than 0.40 // This also acts as a trendsetter
//4. The orange line (TOTALLine) MUST be greater than the red line. This means that the crypto market is positive.
//5.IF THE BLUE LINE (ChartLine) IS GREATER THAN THE ORANGE LINE (TOTALLine) IT MEANS YOUR CRYPTO IS OUTPERFOMING THE MARKET {good for short term explosive bars}
//6. If the orange line (TOTALLine) is higher than your current chart, say BTCUSD. And BTC is going up to. It just means BTC is going up slowly. it's fine as long as they are moving in the same position.
//5. I use this on the 4hr, 1D, 1W timeframes
///////To Exit
//1.If the blue line (ChartLine) crosses under the green line (IBVOLLine) exit{ works best on 4hr,1D, 1W to avoid fakes}
//2.If the red line crosses over the green line when long. {close positions, or watch positions} It means negative volatility is wining

Newton theory (Bollinger Band Breakout)Initial capital 1000 USD
Order size 10%
Commission 0.3% with slippage
Timeframe 4h
This is Simple Bollinger Band Trend find out strategy.
I'm using the usual trailing offset as an exit for this strategy.
using 1x leverage to go long short within 3years backtest result more then 200% for all usd pair.
in next version i will try to find out more optimize sma,std,sl,tp parameter by using freqtrade hyperparameter optimization.
Happy Trading :)
