MACD + BB + RSI Strategy [Alorse]A very simple and highly effective strategy that combines 3 famous indicators:
MACD
Bollinger Bands
RSI
Entry conditions are:
The MACD line crosses over the signal line.
RSI less than 50
Price below the BB baseline
Exit conditions are:
RSI greater than 70
Closing price higher than the upper BB
Or when the price hits the Stop Loss defined by you (Feature).
在腳本中搜尋"弘历投教boll指标代码分析"

RSI in Bollinger bandsI added Bolinger bands to the RSI indicator.
This shows you the area of reversal for the RSI. Generally, when the indicator falls out of the bands, you'll see a quick reversal. Indeed this is a better way to find the overbought and oversold areas.

RSI+ChannelbandsThis Indicator displays a normal RSI with overbought/-sold lines which is calculated with donchian channels, pivot channel, bollinger bands and three horizontal lines.
You can averaged the channels, bands and h-lines in any combination or you can use just one of them for calculating the overbought/-sold lines.
The midline is colored in default settings in yellow for upptrending and blue for downtrending.

Tradingview ToolkitA new trader's biggest barrier to entry is lack of understanding where they are in terms of time and price and with tradingview free they are often limited to just 1 or 2 extra indicators as many new traders slap on RSI and MACD as 2/3 free ones. While these indicators are fine for trend analysis, its important to know where the price is in relation to time. Thus, this all-in-one script is meant to have a lot of customizable utility to save on indicator spots and act as a hotspot for many common needs.
-2 Sets of VWAP line w/ standard deviation bands with customizable timeframes.
-1 more customizable timeframe VWAP line (no std dev bands) to use as a long time frame reference
-Ability to plot previous VWAP close prices over current timeframe on all VWAP lines w/ basic color changing if price closes above/below
-2 Sets of Bollinger Bands with customizable source length and MA type
-3 customizable moving averages with custom timeframe/resolutions
-Inside candle barcolor repainter to easily notice if a candle was inside the range of the previous candle (price contraction)
Not meant to have everything on at once, but simply a place to enable and disable different things and save spots for more important things

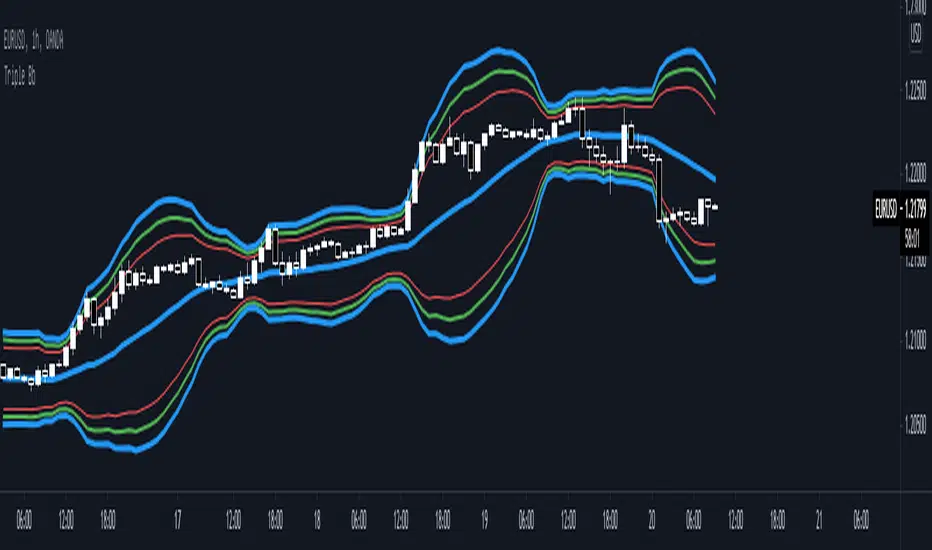
Triple Bb* Triple Bb display maximum 3 Bollinger Bands and each bands could be easily adjust.
* Each Bands Adjustable:
1. Source
2. Period
3. Standard Deviation
4. Color
5. Width
6. Show / Not Show
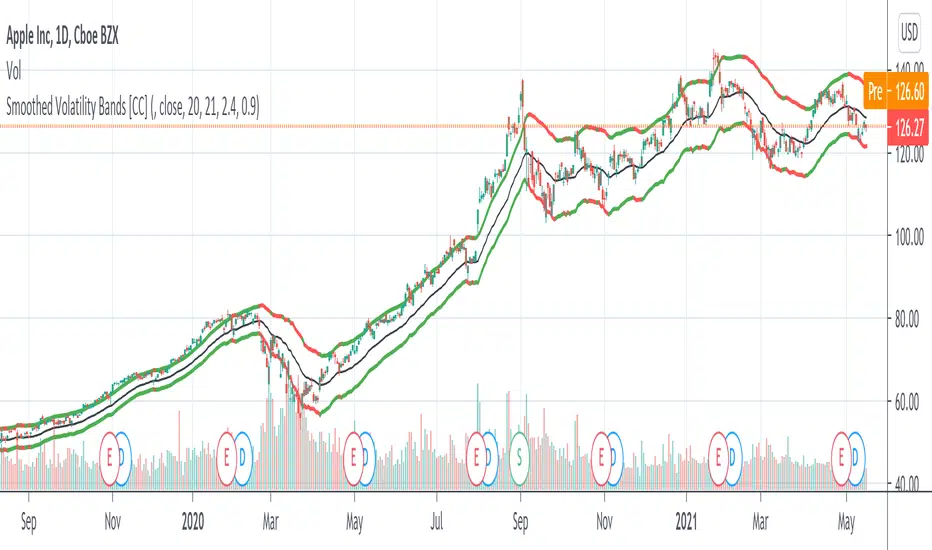
Smoothed Volatility Bands [CC]The Smoothed Volatility Bands were created by Sylvain Vervoort (Stocks and Commodities Sep 2020 pg 19) and this is a heavily customized version of regular Bollinger Bands that take volatility into account. Feel free to change the moving average since Vervoort recommended trying that out. Buy when the indicator line turns green and sell when it turns red.
Let me know if there are any other indicators you want me to publish!
VWMACDV2 w/Intraday Intensity Index Histogram & VBCB Hello traders! In this script i tried to combine Kıvanç Özbilgiç's Volume Based Coloured Bars, Volume Weighted Macd V2 and Intraday Intensity Index developed by Dave Bostian and added to Tradingview by Kıvanç Özbilgiç. Let's see what we got here;
VBCB, Paints candlestick bars according to the volume of that bar. Period is 30 by default. If you're trading stocks, 21 should be better.
Volume Weighted Macd V2, "Here in this version; Exponential Moving Averages used and Weighted by Volume instead of using only vwma (Volume Weighted Moving Averages)." Says, Kıvanç Özbilgiç.
III, "A technical indicator that approximates the volume of trading for a specified security in a given day. It is designed to help track the activity of institutional block traders and is calculated by subtracting the day's high and low from double the closing price, divided by the volume and multiplied by the difference between the high and the low."
*Histogram of vwmacd changes color according to the value of III. (Green if positive, yellow if negative value)*
VWMACD also comes with the values of 21,13,3... Which are fibonacci numbers and that's how i use it. You can always go back to the good old 26,12,9.
Other options according to the fibonacci numbers might be= 21,13,5-13,8,3-13,8,5... (For shorter terms of trading)
Trading combined with the bollinger bands is strongly advised for both VWMACD and III. VBCB is just the candy on top :)
Enjoy!

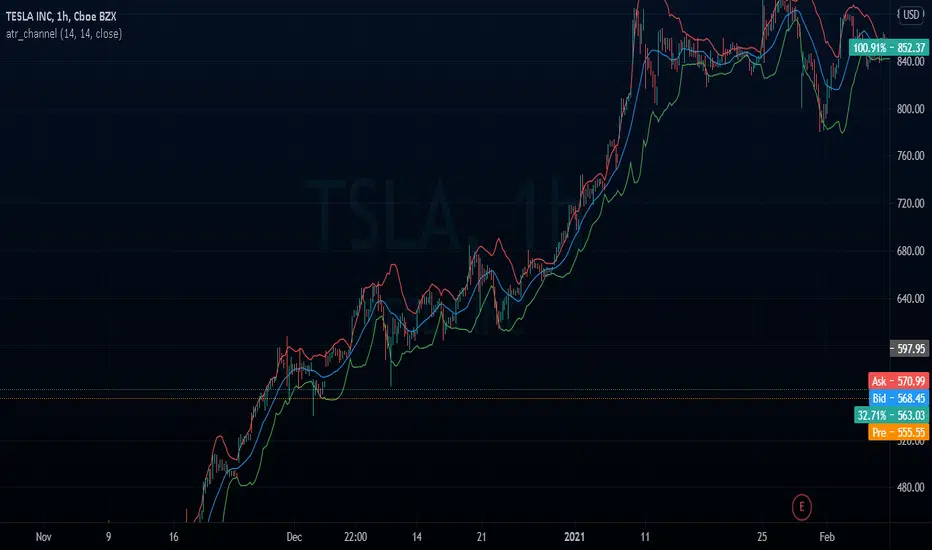
atr_channelThe original bollinger bands have a fixed deviation of 2%, this channel calculates the ATR % (Atr Percentage) and places the upper and lower bands
RSI + Kijun/Standard Deviation on RSIThe script is inspired by Bollinger bands but instead of applying them on the price, they are applied on a RSI oscillator. The standard deviation is not plotted against the average like in normal BBs but instead is based on median values (equivalent of a Kijun in Ichimoku ). The goal is to better identify excess in prices that offer good entering points. The usage of a median provides a clearer view of ranging market (ie. the line will be flat).
I use it for long-term investments on stocks to find "fair" entry points. After picking a list of stocks of interest based on fundamentals, I switch to a weekly view. If the stock RSI is under the bands, it indicates that we are in favorable conditions for a buy. For an accurate timing, you can switch to the daily chart and watch out for either a break or a reintegration in the bands. This is your signal.

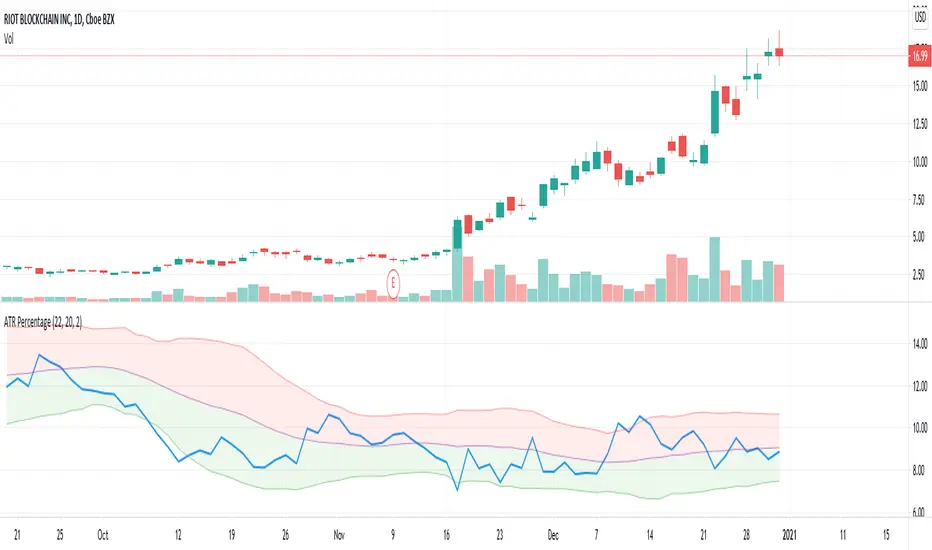
ATR PercentageThis indicator plots ATR as percentage of close price. Also applying bollinger bands on it to visualize it is relatively high or low.
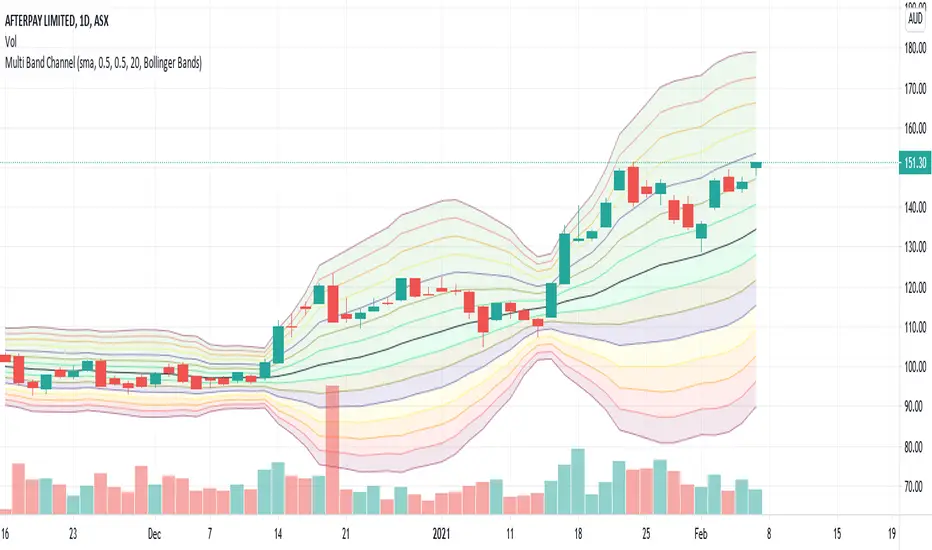
Multi Band ChannelPutting multiple bollinger bands/keltener channels together helps visualize the relative price movement. I have also used this in my BuyTheDip V2 strategy to measure dip and bounce back. 7 Standard deviation is used here. These are calculated based on the input fields StdDevStart and StdDevStep .
Cosmic BB SRThis script is based on Bollinger Bands/Bandwidth data and displays support and resistance levels (thick horizontal lines), the direction/volatility of the levels (thin dynamic lines), and the testing of the levels (cross markers).

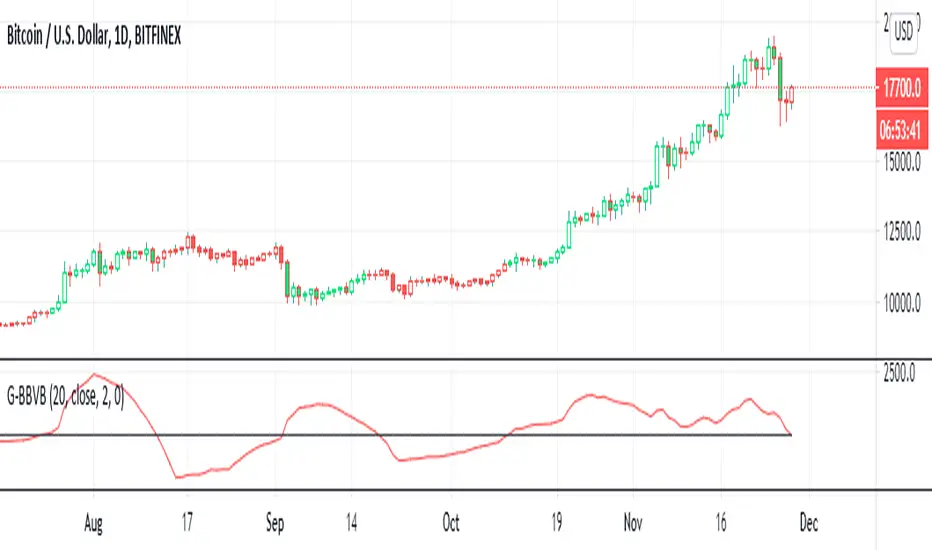
G-Bollinger bands volatility breakout v.1This is my frist publish scrpit. I developed this indicator origin is BB. It make from easy idea but powerful for sideway to breakout
1. I findout volatility by upper band of BB - lower band of BB (I called "Aline")
2. I created SMA of Aline (I called Bline)
3. I created the special line is "Cline" from Aline - Bline
4. I created 0 line " Baseline "
G-BBvB is the very good indicator to detect low volatility to begin the volatility = Buy signal
Now I can't find the sell signal form indicator. I try backtest sell at Cline cross zeroline but it not work.
I'll develop "G" indicator for free .
Goodluck :D
Horcrux OscilatorDoes your oscilator give exit signal on time? Mine does. However worst the idea is, I had to come up with a horcrux plan :P
Concept is as below:
I use 7 standard deviation Bollinger bands to identify which level current price is in. Standard deviations used are from 0.5 (lowest level) to 3.5(highest level) with 0.5 step . This creates overall 16 levels ranging from 0 to 15 with 0 being the highest level and 15 being the lowest.
LookbackPeriod is used to calculate max and min values of these threshold over certain bars. Average of max and min constitutes threshold.
Horcrux value is difference between max state and current state in LookbackPeriod.
Lower the horcrux much closer the current state to the highest state. Hence, horcrux higher than threshold is considered as green region where prices are moving up. Decrease in number of horcruxes means price state moving closer to highest state (which is the lower level). Hence, indicates reduced momentum or reversal.
Use higher LookbackPeriod for increased accuracy. Increase BBLength for long term trades. Adjustment is used to adjust threshold line by up to + or - 20%

Stock Market Strategy : VWAP, MACD, EMA, Breakout, BBHello there,
Today I bring you a stock market strategy, specialized in NASDAQ stocks.
Its a daytrading strategy, that can only do a max of 1 trade per day. In this case it only trades the first 2 opening hours of the market.
The rules are simple :
We follow the trend based on a big EMA, in this case 200, after that, we check for VWAP direction , then, we check histogram from MACD. This is the simple logic of the strategy.
Inside there is another strategy, that not just do the above, but also uses Bollinger bands, and checks for breakout of bottom or top line. Also it uses Average directional Index, for even a bigger criteria .
So for example a long condition it would be : candle is above the ema, and candle is above vwap, and histogram is positive, and candle break the top bb level and ADI < 40 -> long signal . The opposite works for short(ADI > 20).
In this case all this criterias are between the first 2 hours of market. So we enter between the first hour, and exit in the next hour. For this we need to use very short time frames.
Hope you enjoy it.
Let me know if you have any questions

Radar Screen v3This is a combination of various indicators that very rarely conflict, thus giving us a good understanding:
- "Price Rally" detecting whether price is rallying, giving us confidence it will continue.
- Volume - knowing volume is going with the trend is a good confidence check.
- Trend Angle - This will go red or green depending on whether the price angle is going up or down, taken over three bars.
- VWAP for all of these stock traders.
- EMA8 is a very sensitive moving average, good for short term trades.
- CCI SMA is a strategy I commonly use, please check out my other indicators for a functional description.
- Stochastics is used throughout many systems.
- RSI BB shows where price is rebounding of the bollinger band and then moving up or down.
As per all of my indicators, the system is simple - The more green lines you see, the stronger the buy signal. The more red lines you see, the stronger the sell. If its a 50/50 mix of red and green, then don't trade.
I can customise this further or add other strategies, please message me.
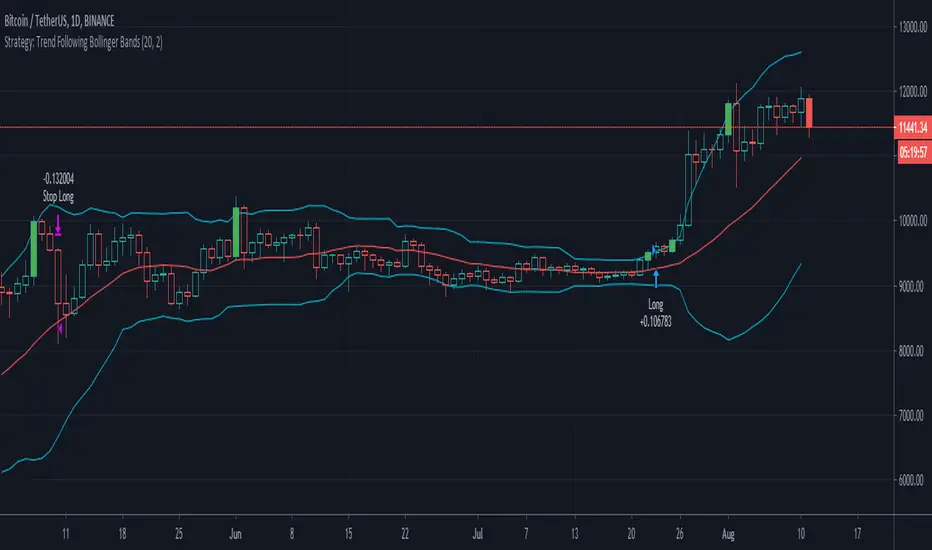
Setup Trend Following Bollinger Bands - ValenteBuy when the candle closes above upper BB
Sell when the candle closes bellow lower BB
Stop always on base line
3MAs & BB, Time-Res, Low-VolTriple MAs with EMA/SMA option, and specific timeframe options.
Very customizable.
Bollinger Bands
If BollingerBand Width is lowest in 100 bars it fills background.

Ichimoku ++ public v0.9Description:
The intention of this script is to build/provide a kind of work station / work bench for analysing markets and especially Bitcoin . Another goal is to get maximum market information while maintaining a good chart overview. A chart overloaded with indicators is useless because it obscures the view of the chart as the most important indicator. The chart should be clear and market structure should be easy to see. In addition, some indicator signals can be activated to better assess the quality of signals from the past. The chart environment or the chart context is important for the quality of a signal.
The intention of this script is not to teach someone how to trade or how to use these Indicators but to provide a tool to analyse markets better and to help to draw conclusions of market behaviour in a higher quality.
A general advise:
Use the included indicators and signals in a confluent way to get stoploss, buy and sell entry points. SR clusters can be identified for use in conjunction with fractals as entry and exit pints. My other scripts can also help. Prefer 4 hours, daily and a longer time frame. There is no "Holy Grail" :).
If someone is new to trading you should learn about the indicators first. Definitely learn about Ichimoku Cloud Indicator.
Integrated indicators are:
Ichimoku Cloud and signals
Parabolic SAR and signal
ATR stop
Bollinger Bands
EMA / SMA and background color as signal
Williams Fractals and signal
Puell Multiple signal

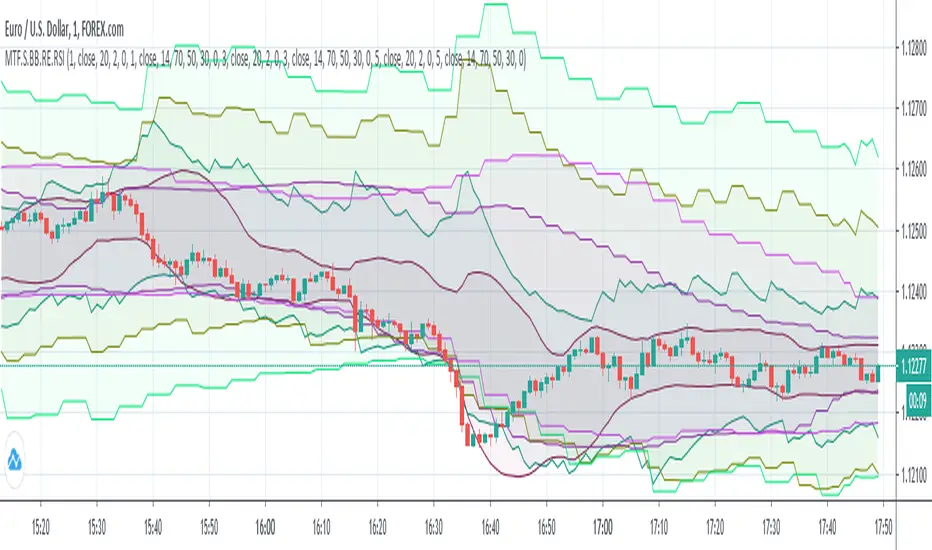
MTF Shifting BBs + Reverse Engineering RSIs Overlay on ChartAnother multi-timeframe indicator presents 3 MTF (each) Bollinger Bands and 3 MTF (each) Reverse Engineering RSI and of course with shifting (left/right) capability.
RERSI in a simple term is the RSI but on the main chart alongside with candles.
There are many adjustable options like:
- Show/Hide each BB
- Show/Hide each MA
- Non-integer BB deviation values
- Positive/Negative shifting values
- Show/Hide each RSI
- Show/Hide each RSI Mid Level
- Adjustable Overbought, Oversold and Mid Levels values
I wrote this after my first script MTFSBB, because it's very useful to have BBs and RSIs together on a chart.
Calculating RERSIs will take some time, so be patient with it and feel free to use it.
Triple MA + EMA + SMMA + BBCombined multiple scripts under one script.
Great for Free account users. ;-)
This script contains:
Moving Average
Exponential Moving Average
Smoothed Moving Moving Average
Bollinger Bands

BB Monitor IndicatorThis is a basic volatile indicator based in the Bollinger Bands that show the explosive market moves (up/down).

Mean Absolute Deviation BandsThe other way to build bands around price that uses Mean Absolute Deviation instead of Standard Deviation.
MAD is also a measure of variability, but less frequently used. MAD is better for use with distributions other than the Gaussian.
MAD is always less than or equal to Standard Deviation and the resulting bands are more tighter for the same parameters if we compare it to Bollinger Bands.
If you use band stops this can be useful.
