Bollinger Bands Delta Matrix Analytics [BDMA] Bollinger Bands Delta Matrix Analytics (BDMA) v7.0
Deep Kinetic Engine – 5x8 Volatility & Delta Decision Matrix
1. Introduction & Concept
Bollinger Bands Delta Matrix Analytics (BDMA) v7.0 is an analytical framework that merges:
- Spatial analysis via Bollinger Bands (%B location),
- with a 4-factor Deep Kinetic Engine based on:
• Total Volume
• Buy Volume
• Sell Volume
• Delta (Buy – Sell) Z-Scores
and converts them into an expanded 5×8 decision matrix that continuously tracks where price is trading and how the underlying orderflow is behaving.
BDMA is not a trading system or strategy. It does not generate entry/exit signals.
Instead, it provides a structured contextual map of volatility, volume, and delta so traders can:
- identify climactic extensions vs. fakeouts,
- distinguish strong initiative moves vs. passive absorption,
- and detect squeezes, traps, and liquidity voids with a unified visual dashboard.
2. Spatial Engine – Bollinger S-States (S1–S5)
The spatial dimension of BDMA comes from classic Bollinger Bands.
Price location is expressed as Percent B (%B) and mapped into 5 spatial states (S-States):
S1 – Hyper Extension (Above Upper Band)
Price has pushed beyond the upper Bollinger Band.
Often associated with parabolic or blow-off behavior, late-stage momentum, and elevated reversal risk.
S2 – Resistance Test (Upper Zone)
Price trades in the upper Bollinger region but remains inside the bands.
Represents a sustained test of resistance, typically within an established or emerging uptrend.
S3 – Neutral Zone (Middle)
Price hovers around the mid-band.
This is the mean reversion gravity field where the market often consolidates or transitions between regimes.
S4 – Support Test (Lower Zone)
Price trades in the lower Bollinger region but inside the bands.
Represents a sustained test of support within range or downtrend structures.
S5 – Hyper Drop (Below Lower Band)
Price extends below the lower Bollinger Band.
Often aligned with panic, forced liquidations, or capitulation-type behavior, with increased snap-back risk.
These 5 S-States define the vertical axis (rows) of the BDMA matrix.
3. Deep Kinetic Engine – 4-Factor Z-Score & D-States (D1–D8)
The Deep Kinetic Engine transforms raw volume and delta into standardized Z-Scores to measure how abnormal current activity is relative to its recent history.
For each bar:
- Raw Buy Volume is estimated from the candle’s position within its range
- Raw Sell Volume is complementary to buy volume
- Raw Delta = Buy Volume – Sell Volume
- Total Volume = Buy Volume + Sell Volume
These 4 series are then normalized using a unified Z-Score lookback to produce:
1. Z_Vol_Total – overall activity and liquidity intensity
2. Z_Vol_Buy – aggression from buyers (attack)
3. Z_Vol_Sell – aggression from sellers (defense or attack)
4. Z_Delta – net victory of one side over the other
Thresholds for Extreme, Significant, and Neutral Z-Score levels are fully configurable, allowing you to tune the sensitivity of the kinetic states.
Using Z_Vol_Total and Z_Delta (plus threshold logic), BDMA assigns one of 8 Deep Kinetic states (D-States):
D1 – Climax Buy
Extreme Total Volume + Extreme Positive Delta → Buying climax or blow-off behavior.
D2 – Strong Buy
High Volume + High Positive Delta → Confirmed bullish initiative activity.
D3 – Weak Buy / Fakeout
Low Volume + High Positive Delta → Bullish delta without commitment, low-liquidity breakout risk.
D4 – Absorption / Conflict
High Volume + Neutral Delta → Aggressive two-way trade, strong absorption, war zone behavior.
D5 – Neutral
Low Volume + Neutral Delta → Low-energy environment with low conviction.
D6 – Weak Sell / Fakeout
Low Volume + High Negative Delta → Bearish delta without commitment, low-liquidity breakdown risk.
D7 – Strong Sell
High Volume + High Negative Delta → Confirmed bearish initiative activity.
D8 – Capitulation
Extreme Volume + Extreme Negative Delta → Panic selling or capitulation regime.
These 8 D-States define the horizontal axis (columns) of the BDMA matrix.
4. The 5×8 BDMA Decision Matrix
The core of BDMA is a 5×8 matrix where:
- Rows (1–5) = Spatial S-States (S1…S5)
- Columns (1–8) = Kinetic D-States (D1…D8)
Each of the 40 possible combinations (SxDy) is pre-computed and mapped to:
- a Status or Regime Title (for example: Climax Breakout, Bear Trap Spring, Capitulation Breakdown),
- a Bias (Climactic Bull, Neutral, Strong Bear, Conflict or Reversal Risk, and similar labels),
- and a Strategic Signal or Consideration (for example: High reversal risk, Wait for confirmation, Low probability zone – avoid).
Internally, BDMA resolves all 40 regimes so the current state can be displayed on the dashboard without performance overhead.
5. Key Regime Families (How to Read the Matrix)
5.1. Breakouts and Breakdowns
Climax Breakout (Top-side)
Spatial S1 with Kinetic D1 or D2
Bias: Explosive or Extreme Bull
Signal:
- Strong or climactic upside extension with abnormal bullish orderflow.
- Trend continuation is possible, but reversal risk is extremely high after blow-off phases.
Low-Conviction Breakout (Fakeout Risk)
S1 with D3 (Weak Buy, low liquidity)
Bias: Weak Bull – Caution
Signal:
- Breakout not supported by volume.
- Elevated risk of failed auction or bull trap.
Capitulation Breakdown (Bottom-side)
Spatial S5 with Kinetic D8
Bias: Climactic Bear (panic)
Signal:
- Capitulation-type selling or forced liquidations.
- Trend can still proceed, but snap-back or violent short-covering risk is high.
Initiative Breakdown vs. Weak Breakdown
- Strong, high-volume breakdown typically corresponds to D7 (Strong Sell).
- Low-volume breakdown often corresponds to D6 (Weak Sell or Fakeout) with potential for failure.
5.2. Absorption, Traps and Springs
Absorption at Resistance (Top-side conflict)
S1 or S2 with D4 (Absorption or Conflict)
Bias: Conflict – Extreme Tension
Signal:
- Heavy two-way trade near resistance.
- Potential distribution or reversal if sellers begin to dominate.
Bull Trap or Failed Auction
Typically S1 with D6 (Weak Sell breakdown behavior after a top-side attempt)
Indicates a breakout attempt that fails and reverses, often after poor liquidity structure.
Absorption at Support and Bear Trap (Spring)
S4 or S5 with D4 or D3
Bias: Conflict or Weak Bear – Reversal Risk
Signal:
- Aggressive buying into lows (spring or shakeout behavior).
- Potential bear trap if price reclaims lost territory.
5.3. Trend Phases
Strong Uptrend Phases
Typically seen when S2–S3 combine with strong bullish kinetic behavior.
Bias: Strong or Extreme Bull
Signal:
- Pullbacks into S3 or S4 with supportive kinetic states often act as trend continuation zones.
Strong Downtrend Phases
Typically seen when S3–S4 combine with strong bearish kinetic behavior.
Bias: Strong or Extreme Bear
Signal:
- Rallies into resistance with strong bearish kinetic backing may act as continuation sell zones.
5.4. Neutral, Exhaustion and Squeeze
Exhaustion or Liquidity Void
S1 or S5 with D5 (Neutral kinetics)
Bias: Neutral or Exhaustion
Signal:
- Spatial extremes without kinetic confirmation.
- Often marks the end of a move, with poor follow-through.
Choppy, Low-Activity Range
S3 with D5
Bias: Neutral
Signal:
- Low volume, low conviction market.
- Typically a low-probability environment where standing aside can be logical.
Squeeze or High-Tension Zone
S3 with D4 or tightly clustered kinetic values
Bias: Conflict or High Tension
Signal:
- Hidden battle inside a volatility contraction.
- Often precedes large directionally-biased moves.
6. Dashboard Layout & Reading Guide
When Show Dashboard is enabled, BDMA displays:
1. Title and Status Line
Name of the current regime (for example: Climax Breakout, Bear Trap Spring, Mean Reversion).
2. Bias Line
Plain-language summary of directional context such as Climactic Bull, Strong Bear, Neutral, or Conflict and Reversal Risk.
3. Signal or Strategic Notes
Concise guidance focused on risk and context, not entries. For example:
- High reversal risk – aggressive traders only
- Wait for confirmation (break or rejection)
- Low probability zone – avoid taking new positions
4. Kinetic Profile (4-Factor Z-Score)
Shows the current Z-Scores for Total Volume (Activity), Buy Volume (Attack), Sell Volume (Defense), and Delta (Net Result).
5. Matrix Heatmap (5×8)
Visual representation of S-State vs. D-State with color coding:
- Bullish clusters in a green spectrum
- Bearish clusters in a red spectrum
- Conflict or exhaustion zones in yellow, amber, or neutral tones
The dashboard can be repositioned (top right, middle right, or bottom right) and its size can be adjusted (Tiny, Small, Normal, or Large) to fit different layouts.
7. Inputs & Customization
7.1. Core Parameters (Bollinger and Z-Score)
- Bollinger Length and Standard Deviation define the spatial engine.
- Z-Score Lookback (All Factors) defines how many bars are used to normalize volume and delta.
7.2. Deep Kinetic Thresholds
- Extreme Threshold defines what is considered climactic (D1 or D8).
- Significant Threshold distinguishes strong initiative vs. weak or fakeout behavior.
- Neutral Threshold is the band within which delta is treated as neutral.
These thresholds allow you to tune the sensitivity of the kinetic classification to fit different timeframes or instruments.
7.3. Calculation Method (Volume Delta)
Geometry (Approx)
- Fast, non-repainting approach based on candle geometry.
- Suitable for most users and real-time decision-making.
Intrabar (Precise)
- Uses lower-timeframe data for more precise volume delta estimation.
- Intrabar mode can repaint and requires compatible data and plan support on the platform.
- Best used for post-analysis or research, not blind automation.
7.4. Visuals and Interface
- Toggle Bollinger Bands visibility on or off.
- Switch between Dark and Light color themes.
- Configure dashboard visibility, matrix heatmap display, position, and size.
8. Multi-Language Semantic Engine (Asia and Middle East Focus)
BDMA v7.0 includes a fully integrated multi-language layer, targeting a wide geographic user base.
Supported Languages:
English, Türkçe, Русский, 简体中文, हिन्दी, العربية, فارسی, עברית
All dashboard labels, regime titles, bias descriptions, and signal texts are dynamically translated via an internal dictionary, while semantic meaning is kept consistent across languages.
This makes BDMA suitable for multi-language communities, study groups, and educational content across different regions.
However, due to the heavy computational load of the Deep Kinetic Engine and TradingView’s strict Pine Script execution limits, it was not possible to expand support to additional languages. Adding more translation layers would significantly increase memory usage and exceed runtime constraints. For this reason, the current language set represents the maximum optimized configuration achievable without compromising performance or stability.
9. Practical Usage Notes
BDMA is most powerful when used as a contextual overlay on top of market structure (HH, HL, LH, LL), higher-timeframe trend, key levels, and your own execution framework.
Recommended usage:
- Identify the current regime (Status and Bias).
- Check whether price location (S-State) and kinetic behavior (D-State) agree with your trade idea.
- Be especially cautious in climactic and absorption or conflict zones, where volatility and risk can be elevated.
Avoid treating BDMA as an automatic green equals buy, red equals sell tool.
The real edge comes from understanding where you are in the volatility or kinetic spectrum, not from forcing signals out of the matrix.
10. Limitations & Important Warnings
BDMA does not predict the future.
It organizes current and recent data into a structured context.
Volume data quality depends on the underlying symbol, exchange, and broker feed.
Forex, crypto, indices, and stocks may all behave differently.
Intrabar mode can repaint and is sensitive to lower-timeframe data availability and your plan type.
Use it with extra caution and primarily for research.
No indicator can remove the need for clear trading rules, disciplined risk management, and psychological control.
11. Disclaimer
This script is provided strictly for educational and analytical purposes.
It is not a trading system, signal service, financial product, or investment advice.
Nothing in this indicator or its description should be interpreted as a recommendation to buy or sell any asset.
Past behavior of any indicator or market pattern does not guarantee future results.
Trading and investing involve significant risk, including the risk of losing more than your initial capital in leveraged products.
You are solely responsible for your own decisions, risk management, and results.
By using this script, you acknowledge that you understand these risks and agree that the author or authors and publisher or publishers are not liable for any loss or damage arising from its use.
在腳本中搜尋"弘历投教boll指标代码分析"

Bollinger Bands Reversal Strategy Analyzer█ OVERVIEW
The Bollinger Bands Reversal Overlay is a versatile trading tool designed to help traders identify potential reversal opportunities using Bollinger Bands. It provides visual signals, performance metrics, and a detailed table to analyze the effectiveness of reversal-based strategies over a user-defined lookback period.
█ KEY FEATURES
Bollinger Bands Calculation
The indicator calculates the standard Bollinger Bands, consisting of:
A middle band (basis) as the Simple Moving Average (SMA) of the closing price.
An upper band as the basis plus a multiple of the standard deviation.
A lower band as the basis minus a multiple of the standard deviation.
Users can customize the length of the Bollinger Bands and the multiplier for the standard deviation.
Reversal Signals
The indicator identifies potential reversal signals based on the interaction between the price and the Bollinger Bands.
Two entry strategies are available:
Revert Cross: Waits for the price to close back above the lower band (for longs) or below the upper band (for shorts) after crossing it.
Cross Threshold: Triggers a signal as soon as the price crosses the lower band (for longs) or the upper band (for shorts).
Trade Direction
Users can select a trade bias:
Long: Focuses on bullish reversal signals.
Short: Focuses on bearish reversal signals.
Performance Metrics
The indicator calculates and displays the performance of trades over a user-defined lookback period ( barLookback ).
Metrics include:
Win Rate: The percentage of trades that were profitable.
Mean Return: The average return across all trades.
Median Return: The median return across all trades.
These metrics are calculated for each bar in the lookback period, providing insights into the strategy's performance over time.
Visual Signals
The indicator plots buy and sell signals on the chart:
Buy Signals: Displayed as green triangles below the price bars.
Sell Signals: Displayed as red triangles above the price bars.
Performance Table
A customizable table is displayed on the chart, showing the performance metrics for each bar in the lookback period.
The table includes:
Win Rate: Highlighted with gradient colors (green for high win rates, red for low win rates).
Mean Return: Colored based on profitability (green for positive returns, red for negative returns).
Median Return: Colored similarly to the mean return.
Time Filtering
Users can define a specific time window for the indicator to analyze trades, ensuring that performance metrics are calculated only for the desired period.
Customizable Display
The table's font size can be adjusted to suit the user's preference, with options for "Auto," "Small," "Normal," and "Large."
█ PURPOSE
The Bollinger Bands Reversal Overlay is designed to:
Help traders identify high-probability reversal opportunities using Bollinger Bands.
Provide actionable insights into the performance of reversal-based strategies.
Enable users to backtest and optimize their trading strategies by analyzing historical performance metrics.
█ IDEAL USERS
Swing Traders: Looking for reversal opportunities within a trend.
Mean Reversion Traders: Interested in trading price reversals to the mean.
Strategy Developers: Seeking to backtest and refine Bollinger Bands-based strategies.
Performance Analysts: Wanting to evaluate the effectiveness of reversal signals over time.

Bollinger Bands Reversal + IBS Strategy█ STRATEGY DESCRIPTION
The "Bollinger Bands Reversal Strategy" is a mean-reversion strategy designed to identify potential buying opportunities when the price deviates below the lower Bollinger Band and the Internal Bar Strength (IBS) indicates oversold conditions. It enters a long position when specific conditions are met and exits when the IBS indicates overbought conditions. This strategy is suitable for use on various timeframes.
█ WHAT ARE BOLLINGER BANDS?
Bollinger Bands consist of three lines:
- **Basis**: A Simple Moving Average (SMA) of the price over a specified period.
- **Upper Band**: The basis plus a multiple of the standard deviation of the price.
- **Lower Band**: The basis minus a multiple of the standard deviation of the price.
Bollinger Bands help identify periods of high volatility and potential reversal points.
█ WHAT IS INTERNAL BAR STRENGTH (IBS)?
Internal Bar Strength (IBS) is a measure of where the closing price is relative to the high and low of the bar. It is calculated as:
IBS = (Close - Low) / (High - Low)
A low IBS value (e.g., below 0.2) indicates that the close is near the low of the bar, suggesting oversold conditions. A high IBS value (e.g., above 0.8) indicates that the close is near the high of the bar, suggesting overbought conditions.
█ SIGNAL GENERATION
1. LONG ENTRY
A Buy Signal is triggered when:
The IBS value is below 0.2, indicating oversold conditions.
The close price is below the lower Bollinger Band.
The signal occurs within the specified time window (between `Start Time` and `End Time`).
2. EXIT CONDITION
A Sell Signal is generated when the IBS value exceeds 0.8, indicating overbought conditions. This prompts the strategy to exit the position.
█ ADDITIONAL SETTINGS
Length: The lookback period for calculating the Bollinger Bands. Default is 20.
Multiplier: The number of standard deviations used to calculate the upper and lower Bollinger Bands. Default is 2.0.
Start Time and End Time: The time window during which the strategy is allowed to execute trades.
█ PERFORMANCE OVERVIEW
This strategy is designed for mean-reverting markets and performs best when the price frequently deviates from the Bollinger Bands.
It is sensitive to oversold and overbought conditions, as indicated by the IBS, which helps to identify potential reversals.
Backtesting results should be analyzed to optimize the Length and Multiplier parameters for specific instruments.

Bollinger Bands Percentile + Stdev Channels (BBPct) [AlgoAlpha]Description:
The "Bollinger Bands Percentile (BBPct) + STD Channels" mean reversion indicator, developed by AlgoApha, is a technical analysis tool designed to analyze price positions using Bollinger Bands and Standard Deviation Channels (STDC). The combination of these two indicators reinforces a stronger reversal signal. BBPct calculates the percentile rank of the price's standard deviation relative to a specified lookback period. Standard deviation channels operate by utilizing a moving average as the central line, with upper and lower lines equidistant from the average based on the market's volatility, helping to identify potential price boundaries and deviations.
How it Works:
The BBPct indicator utilizes Bollinger Bands, which consist of a moving average (basis) and upper and lower bands based on a specified standard deviation multiplier. By default, it uses a 20-period moving average and a standard deviation multiplier of 2. The upper band is calculated by adding the basis to the standard deviation multiplied by the multiplier, while the lower band is calculated by subtracting the same value. The BBPct indicator calculates the position of the current price between the lower and upper Bollinger Bands as a percentile value. It determines this position by comparing the price's distance from the lower band to the overall range between the upper and lower bands. A value of 0 indicates that the price is at the lower band, while a value of 100 indicates that the price is at the upper band. The indicator also includes an optional Bollinger Band standard deviation percentage (%Stdev) histogram, representing the deviation of the current price from the moving average as a percentage of the price itself.
Standard deviation channels, also known as volatility channels, aid in identifying potential buying and selling opportunities while minimizing unfavorable trades. These channels are constructed by two lines that run parallel to a moving average. The separation between these lines is determined by the market's volatility, represented by standard deviation. By designating upper and lower channel lines, the channels demarcate the borders between typical and atypical price movements. Consequently, when the market's price falls below the lower channel line, it suggests undervaluation, whereas prices surpassing the upper channel line indicate overvaluation.
Signals
The chart displays potential reversal points through the use of red and green arrows. A red arrow indicates a potential bearish retracement, signaling a possible downward movement, while a green arrow represents a potential pullback to the positive, suggesting a potential upward movement. These signals are generated only when both the BBPct (Bollinger Bands Percentage) and the STDC (Standard Deviation Channel) indicators align with bullish or bearish conditions. Consequently, traders might consider opening long positions when the green arrow appears and short positions when the red arrow is plotted.
Usage:
This indicator can be utilized by traders and investors to effectively identify pullbacks, reversals, and mean regression, thereby enhancing their trading opportunities. Notably, extreme values of the BBPct, such as below -5 or above 105, indicate oversold or overbought conditions, respectively. Moreover, the presence of extreme STDC zones occurs when prices fall below the lower channel line or cross above the upper channel line. Traders can leverage this information as a mean reversion tool by identifying instances of peak overbought and oversold values. These distinctive characteristics facilitate the identification of potential entry and exit points, thus augmenting trading decisions and enhancing market analysis.
The indicator's parameters, such as the length of the moving average, the data source, and the standard deviation multiplier, can be customized to align with individual trading strategies and preferences.
Originality:
The BBPct + STDC indicator, developed by AlgoAlpha, is an original implementation that combines the calculation of Bollinger Bands, percentile ranking, the %Stdev histogram and the STDC. While it shares some similarities with the Bollinger Bands %B indicator, the BBPct indicator introduces additional elements and customization options tailored to AlgoAlpha's methodology. The script is released under the Mozilla Public License 2.0, granting users the freedom to utilize and modify it while adhering to the license terms.

[Mad]Triple Bollinger Bands ForecastTriple Bollinger Bands Forecast (BBx3+F)
This open-source indicator is an advanced version of the classic Bollinger Bands, designed to provide a more comprehensive and forward-looking view of market volatility and potential price levels.
It plots three distinct sets of Bollinger Bands and projects them into the future based on statistical calculations.
How It Is Built and Key Features
Triple Bollinger Bands: Instead of a single set of bands, this indicator plots three. All three share the same central basis line (a Simple Moving Average), but each has a different standard deviation multiplier. This creates three distinct volatility zones for analyzing price deviation from its mean.
Multi-Timeframe (MTF) Capability: The indicator can calculate and display Bollinger Bands from a higher timeframe (e.g., showing daily bands on a 4-hour chart). This allows for contextualizing price action within the volatility structure of a more significant trend.
(Lower HTF selection will result in script-crash!)
Future Forecasting: This is the indicator's main feature. It projects the calculated Bollinger Bands up to 8 bars into the future. This forecast is a recalculation of the Simple Moving Average and Standard Deviation based on a projected future source price.
Selectable Forecast Methods: The mathematical model for estimating the future source price can be selected:
Flat: A model that uses the most recent closing price as the price for all future bars in the calculation window.
Linreg (Linear Regression): A model that calculates a linear regression trend on the last few bars and projects it forward to estimate the future source price.
Efficient Drawing with Polylines: The future projections are drawn on the chart using Pine Script's polyline object. This is an efficient method that draws the forecast data only on the last bar, which avoids repainting issues.
Differences from a Classical Bollinger Bands Indicator
Band Count: A classical indicator shows one set of bands. This indicator plots three sets for a multi-layered view of volatility.
Perspective: Classical Bollinger Bands are purely historical. This indicator is both historical and forward-looking .
Forecasting: The classic version has no forecasting capability. This indicator projects the bands into the future .
Timeframe: The classic version works only on the current timeframe. This indicator has full Multi-Timeframe (MTF) support .
The Mathematics Behind the Future Predictions
The core challenge in forecasting Bollinger Bands is that a future band value depends on future prices, which are unknown. This indicator solves this by simulating a future price series. Here is the step-by-step logic:
Forecast the Source Price for the Next Bar
First, the indicator estimates what the price will be on the next bar.
Flat Method: The forecasted price is the current bar's closing price.
Price_forecast = close
Linreg Method: A linear regression is calculated on the last few bars and extrapolated one step forward.
Price_forecast = ta.linreg(close, linreglen, 1)
Calculate the Future SMA (Basis)
To calculate the Simple Moving Average for the next bar, a new data window is simulated. This window includes the new forecasted price and drops the oldest historical price. For a 1-bar forecast, the calculation is:
SMA_future = (Price_forecast + close + close + ... + close ) / length
Calculate the Future Standard Deviation
Similarly, the standard deviation for the next bar is calculated over this same simulated window of prices, using the new SMA_future as its mean.
// 1. Calculate the sum of squared differences from the new mean
d_f = Price_forecast - SMA_future
d_0 = close - SMA_future
// ... and so on for the rest of the window's prices
SumOfSquares = (d_f)^2 + (d_0)^2 + ... + (d_length-2)^2
// 2. Calculate future variance and then the standard deviation
Var_future = SumOfSquares / length
StDev_future = sqrt(Var_future)
Extending the Forecast (2 to 8 Bars)
For forecasts further into the future (e.g., 2 bars), the script uses the same single Price_forecast for all future steps in the calculation. For a 2-bar forecast, the simulated window effectively contains the forecasted price twice, while dropping the two oldest historical prices. This provides a statistically-grounded projection of where the Bollinger Bands are likely to form.
Usage as a Forecast Extension
This indicator's functionality is designed to be modular. It can be used in conjunction with as example Mad Triple Bollinger Bands MTF script to separate the rendering of historical data from the forward-looking forecast.
Configuration for Combined Use:
Add both the Mad Triple Bollinger Bands MTF and this Triple Bollinger Bands Forecast indicator to your chart.
Open the Settings for this indicator (BBx3+F).
In the 'General Settings' tab, disable the Activate Plotting option.
To ensure data consistency, the Bollinger Length, Multipliers, and Higher Timeframe settings should be identical across both indicators.
This configuration prevents the rendering of duplicate historical bands. The Mad Triple Bollinger Bands MTF script will be responsible for visualizing the historical and current bands, while this script will overlay only the forward-projected polyline data.

Bollinger Volatility AnalyzerThe Bollinger Volatility Analyzer (BVA) is a powerful enhancement of the traditional Bollinger Bands indicator, tailored to help traders identify volatility cycles and catch potential breakouts with better precision and timing. It builds upon the foundational concept of Bollinger Bands—using a moving average and standard deviation bands—but adds crucial insights into market contraction and expansion, which can be instrumental in timing entries and exits.
Here's how it works and why it's useful
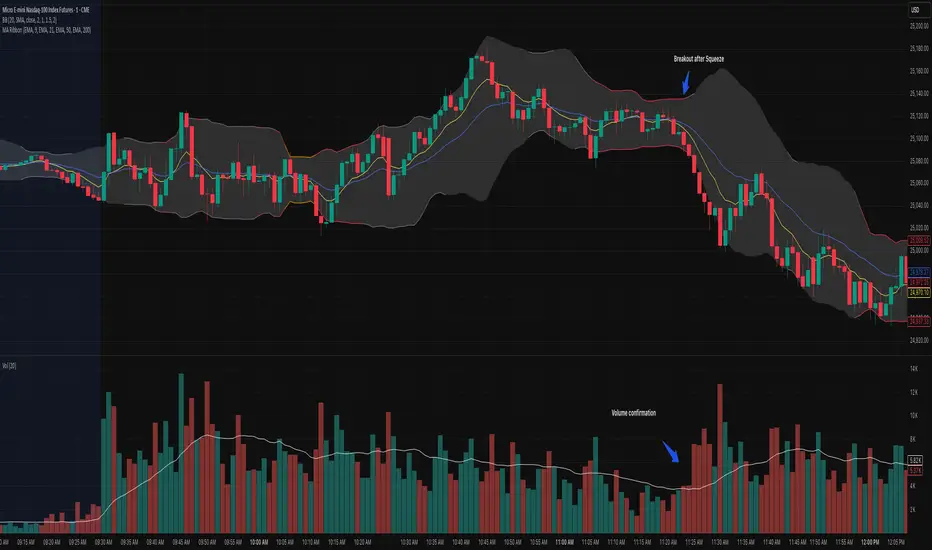
At its core, the indicator calculates a moving average (called the "basis") and plots two bands—one above and one below—based on a multiple of standard deviation. These bands expand during volatile periods and contract during quiet ones. The width between these bands, normalized as a percentage of the basis, gives us a sense of how compressed or expanded the market currently is. When the band width drops below a user-defined threshold (like 2%), the script highlights this with an orange triangle below the bar. This is the "squeeze" condition, signaling a potential buildup of market energy—a kind of calm before the storm.
What makes this version of Bollinger Bands particularly powerful is that it not only detects squeezes, but also tells you when price breaks out of that squeeze range. If price closes above the upper band after a squeeze, a green "Breakout ↑" label is shown; if it closes below the lower band, a red "Breakout ↓" appears. These breakout labels act as entry signals, suggesting that volatility is returning and a directional move has begun.
This indicator is especially useful in markets that tend to alternate between consolidation and breakout phases, such as forex, crypto, and even individual stocks. Traders who look for early signs of momentum—whether for swing trading, scalping, or position building—can benefit from this tool. During a quiet market phase, the indicator warns you that a move might be coming; when the move starts, it tells you the direction.
In fast-moving markets, BVA helps filter out noise by focusing only on high-probability conditions: quiet consolidation followed by a strong breakout. It’s not a complete system by itself—it works best when paired with volume confirmation or oscillators like RSI—but as a volatility trigger and directional guide, it’s a reliable component of a trading workflow.

Bollinger Band Wick and SRSI Signals [MW]Introduction
This indicator uses a novel combination of Bollinger Bands, candle wicks crossing the upper and lower Bollinger Bands and baseline, and combines them with the Stochastic SRSI oscillator to provide early BUY and SELL signals in uptrends, downtrends, and in ranging price conditions.
How it’s unique
People generally understand Bollinger Bands and Keltner Channels. Buy at the bottom band, sell at the top band. However, because the bands themselves are not static, impulsive moves can render them useless. People also generally understand wicks. Candles with large wicks can represent a change in pattern, or volatile price movement. Combining those two to determine if price is reaching a pivot point is relatively novel. When Stochastic RSI (SRSI) filtering is also added, it becomes a genuinely unique combination that can be used to determine trade entries and exits.
What’s the benefit
The benefit of the indicator is that it can help potentially identify pivots WHEN THEY HAPPEN, and with potentially minimal retracement, depending on the trader’s time window. Many indicators wait for a trend to be established, or wait for a breakout to occur, or have to wait for some form of confirmation. In the interpretation used by this indicator, bands, wicks, and SRSI cycles provide both the signal and confirmation.
It takes into account 3 elements:
Price approaching the upper or lower band or the baseline - MEANING: Price is becoming extended based on calculations that use the candle trading range.
A candle wick of a defined proportion (e.g. wick is 1/2 the size of a full candle OR candle body) crosses a band or baseline, but the body does not cross the band or baseline - MEANING: Buyers and sellers are both very active.
The Stochastic RSI reading is above 80 for SELL signals and below 20 for BUY signals - MEANING: Additional confirmation that price is becoming extended based on the current cyclic price pattern.
How to Use
SIGNALS
Buy Signals - Green(ish):
B Signal - Potential pivot up from the lower band when using the preferred multiplier
B1 Signal - Potential pivot up from baseline
Sell Signals - Red(ish):
S Signal - Potential pivot down from the upper band when using the preferred multiplier
S1 Signal - Potential pivot down from the baseline
DISCUSSION
During an uptrend or downtrend, signals from the baseline can help traders identify areas where they may enter the trending move with the least amount of drawdown. In both cases, entry points can occur with baseline signals in the direction of the trend.
For example, in an uptrend (when the price is forming higher highs and higher lows, or when the baseline is rising), price tends to oscillate between the upper band and baseline. In this case, the baseline BUY signal (B3) can show an entry point.
In a downtrend (when the price is forming lower highs and lower lows, or when the baseline is falling), price tends to oscillate between the baseline and the lower band. In this case, the baseline SELL signal (S3) can show an entry point.
During consolidation, when price is ranging, price tends to oscillate between the upper and lower bands, while crossing through the baseline unperturbed. Here, entry points can occur at the upper and lower bands.
When all conditions are met at the lower band during consolidation, a BUY signal (B), can occur. This signal may also occur prior to a break out of consolidation to the upside.
When all conditions are met at the upper band during consolidation, a SELL signal (S), can occur. This signal may also occur prior to a break out of consolidation to the downside.
Additional, B1 and S1 signals can be displayed that use the baseline as the pivot level.
Settings
SIGNALS
Show Bollinger Band Signals (Default: True): Allows signal labels to be shown.
Hide Baseline Signals (Default: False): Baseline signals are on by default. This will turn them off.
Show Wick Signals (Defau
lt: True): Displays signals when wicking occurs.
BOLLINGER BAND SETTINGS
Period length for Bollinger Band Basis (Default: 21): Length of the Bollinger Band (BB) moving average basis line.
Basis MA Type (Default: SMA): The moving average type for the BB Basis line.
Source (Default: “close”): The source of time series data.
Standard Deviation Multiplier (Default: 2.5: The deviation multiplier used to calculate the band distance from the basis line.
WICK SETTINGS FOR BOLLINGER BANDS
Wick Ratio for Bands (Default: 0.3): The ratio of wick size to total candle size for use at upper and lower bands.
Wick Ratio for Baseline (Default: 0.3): The ratio of wick size to total candle size for use at baseline.
WICK SETTINGS FOR CANDLE SIGNALS
Upper Wick Threshold (Default: 50): The percent of upper wick compared to the full candle size or candle body size.
Lower Wick Threshold (Default: 50): The percent of lower wick compared to the full candle size or candle body size.
Use Candle Body (Default: false): Toggles the use of the full candle size versus the candle body size when calculating the wick signal.
VISUAL PREFERENCES
Fill Bands (Default: true): Use a background color inside the Bollinger Bands.
Show Signals (Default: true): Toggle the Bollinger Band upper band, lower band, and baseline signals.
Show Bollinger Bands (Default: true): Show the Bollinger Bands.
STOCHASTIC SETTINGS
Use Stochastic RSI Filtering (Default: False): This will only trigger some SELL signals when the stochastic RSI is above 80, and BUY signals when below 20.
K (Default: 3): The smoothing level for the Stochastic RSI.
RSI Length (Default: 14): The period length for the RSI calculation.
Stochastic Length (Default: 8): The period length over which the stochastic calculation is performed.
Calculations
Bollinger Bands are a technical analysis tool that are used to measure market volatility and identify overbought or oversold conditions in the trading of financial instruments, such as stocks, bonds, commodities, and currencies. Bollinger Bands consist of three lines plotted on a price chart:
Middle Band, Basis, or Baseline: This is typically a simple moving average (SMA) of the closing prices over a certain period. It represents the intermediate-term trend of the asset's price.
Upper Band: This is calculated by adding a certain number of standard deviations to the middle band (SMA). The upper band adjusts itself with the increase in volatility.
Lower Band: This is calculated by subtracting the same number of standard deviations from the middle band (SMA). Like the upper band, the lower band adjusts to changes in volatility.
The candle wick signals occur if the wick is at the specified ratio compared to either the entire candle or the candle body. The upper band, lower band, and baseline signals happen if the wick is the specified ratio of the total candle size. For the major signals for upper and lower bands, these occur when the wick extends outside of the bands while closing a candle inside of the bands. For the baseline signals, they occur if a wick crosses a baseline but closes on the other side.
Other Usage Notes and Limitations
To understand future price movement, this indicator assumes that 3 things must be known:
Evidence of a change of market structure. This can be demonstrated by increased volatility, consolidation, volume spikes (which can be tracked with the MW Volume Impulse Indicator) or, in the case of this indicator, candle wicks.
The potential cause of the change. It could be a VWAP line (which can be tracked with the Multi VWAP , and Multi VWAP from Gaps indicators), an event, an important support or resistance level, a key moving average, or many other things. This indicator assumes the ATR bands can be a cause.
The current position in the price cycle. Oscillators like the RSI, and MACD, are typical measures of price oscillation (other oscillators like the Price and Volume Stochastic Divergence indicator can also be useful). This indicator uses the Stochastic RSI oscillator to determine overbought and oversold conditions.
When evidence of the change appears, and the potential cause of the change is identified, and the price oscillation is at a favorable position for the desired trading direction, this indicator will generate a signal.
ATR Bands (or Keltner Channels) are used to determine when price might “revert to the mean”. Crossing, or being near the upper or lower band, can indicate an overbought or oversold condition, which could lead to a price reversal. By tracking the behavior of candle wicks during these events, we can see how active the battle is between buyers and sellers.
If the top of a wick is large, it may indicate that sellers are aggressively attempting to bring the price down. Conversely, if the bottom wick is large, it can indicate that buyers are actively trying to counter the price action caused by selling pressure.
When this wicking action occurs at times when price is not near the upper band, lower band, or baseline, it could indicate the presence of an important level. That could mean a nearby VWAP line, a supply or demand zone, a round price number, or a number of other factors. In any case, this wick may be the first indication of a price reversal.
Shorter baseline periods may be better for short period trading like scalping or day trading, while longer period baselines can show signals that are better suited to swing trading, or longer term investing.
It's important for traders to be aware of the limitations of any indicator and to use them as part of a broader, well-rounded trading strategy that includes risk management, fundamental analysis, and other tools that can help with reducing false signals, determining trend direction, and providing additional confirmation for a trade decision. Diversifying strategies and not relying solely on one type of indicator or analysis can help mitigate some of these risks.
The TradingView platform allows a maximum of 500 labels per chart. This means that if your settings allow for a lot of signals, labels for earlier ones may not appear if the total number of labels exceeds 500 for the chart.

Bollinger Bands (Nadaraya Smoothed) | Flux ChartsTicker: AMEX:SPY , Timeframe: 1m, Indicator settings: default
General Purpose
This script is an upgrade to the classic Bollinger Bands. The idea behind Bollinger bands is the detection of price movements outside of a stock's typical fluctuations. Bollinger Bands use a moving average over period n plus/minus the standard deviation over period n times a multiplier. When price closes above or below either band this can be considered an abnormal movement. This script allows for the classic Bollinger Band interpretation while de-noising or "smoothing" the bands.
Efficacy
Ticker: AMEX:SPY , Timeframe: 1m, Indicator settings: Standard Dev: 2; Level 1 : off; Level 2: off; labels: off
Upper Band Key:
Blue: Bollinger No smoothing
Orange: Bollinger SMA smoothing period of 10
Purple: Bollinger EMA smoothing period of 10
Red: Nadaraya Smoothed Bollinger bandwidth of 6
Here we chose periods so that each would have a similar offset from the original Bollinger's. Notice that the Red Band has a much smoother result while on average having a similar fit to the other smoothing techniques. Increasing the EMA's or SMA's period would result in them being smoother however the offset would increase making them less accurate to the original data.
Ticker: AMEX:SPY , Timeframe: 1m, Indicator settings: Standard Dev: 2; Level 1: off; Level 2: off; labels: off
Upper Band Key:
Blue: Bollinger No smoothing
Orange: Bollinger SMA smoothing period of 20
Purple: Bollinger EMA smoothing period of 20
Red: Nadaraya Smoothed Bollinger bandwidth of 6
This makes the Nadaraya estimator a particularly efficacious technique in this use case as it achieves a superior smoothness to fit ratio.
How to Use
This indicator is not intended to be used on its own. Its use case is to identify outlier movements and periods of consolidation. The Smoothing Factor when lowered results in a more reactive but noisy graph. This setting is also known as the "bandwidth" ; it essentially raises the amplitude of the kernel function causing a greater weighting to recent data similar to lowering the period of a SMA or EMA. The repaint smoothing simply draws on the Bollinger's each chart update. Typically repaint would be used for processing and displaying discrete data however currently it's simply another way to display the Bollinger Bands.
What makes this script unique.
Since Bollinger bands use standard deviation they have excess noise. By noise we mean minute fluctuations which most traders will not find useful in their strategies. The Nadaraya-Watson estimator, as used, is essentially a weighted average akin to an ema. A gaussian kernel is placed at the candlestick of interest. That candlestick's value will have the highest weight. From that point the other candlesticks' values effect on the average will decrease with the slope of the kernel function. This creates a localized mean of the Bollinger Bands allowing for reduced noise with minimal distortion of the original Bollinger data.

Robust Bollinger Bands with Trend StrengthThe "Robust Bollinger Bands with Trend Strength" indicator is a technical analysis tool designed assess price volatility, identify potential trading opportunities, and gauge trend strength. It combines several robust statistical methods and percentile-based calculations to provide valuable information about price movements with Improved Resilience to Noise while mitigating the impact of outliers and non-normality in price data.
Here's a breakdown of how this indicator works and the information it provides:
Bollinger Bands Calculation: Similar to traditional Bollinger Bands, this indicator calculates the upper and lower bands that envelop the median (centerline) of the price data. These bands represent the potential upper and lower boundaries of price movements.
Robust Statistics: Instead of using standard deviation, this indicator employs robust statistical measures to calculate the bands (spread). Specifically, it uses the Interquartile Range (IQR), which is the range between the 25th percentile (low price) and the 75th percentile (high price). Robust statistics are less affected by extreme values (outliers) and data distributions that may not be perfectly normal. This makes the bands more resistant to unusual price spikes.
Median as Centerline: The indicator utilizes the median of the chosen price source (either HLC3 or VWMA) as the central reference point for the bands. The median is less affected by outliers than the mean (average), making it a robust choice. This can help identify the center of price action, which is useful for understanding whether prices are trending or ranging.
Trend Strength Assessment: The indicator goes beyond the standard Bollinger Bands by incorporating a measure of trend strength. It uses a robust rank-based correlation coefficient to assess the relationship between the price source and the bar index (time). This correlation coefficient, calculated over a specified length, helps determine whether a trend is strong, positive (uptrend), negative (down trend), or non-existent and weak. When the rank-based correlation coefficient shifts it indicates exhaustion of a prevailing trend. Trend Strength" indicator is designed to provide statistically valid information about trend strength while minimizing the impact of outliers and data distribution characteristics. The parameter choices, including a length of 14 and a correlation threshold of +/-0.7, considered to offer meaningful insights into market conditions and statistical validity (p-value ,0.05 statistically significant). The use of rank-based correlation is a robust alternative to traditional Pearson correlation, especially in the context of financial markets.
Trend Fill: Based on the robust rank-based correlation coefficient, the indicator fills the area between the upper and lower Bollinger Bands with different colors to visually represent the trend strength. For example, it may use green for an uptrend, red for a down trend, and a neutral color for a weak or ranging market. This visual representation can help traders quickly identify potential trend opportunities. In addition the middle line also informs about the overall trend direction of the median.

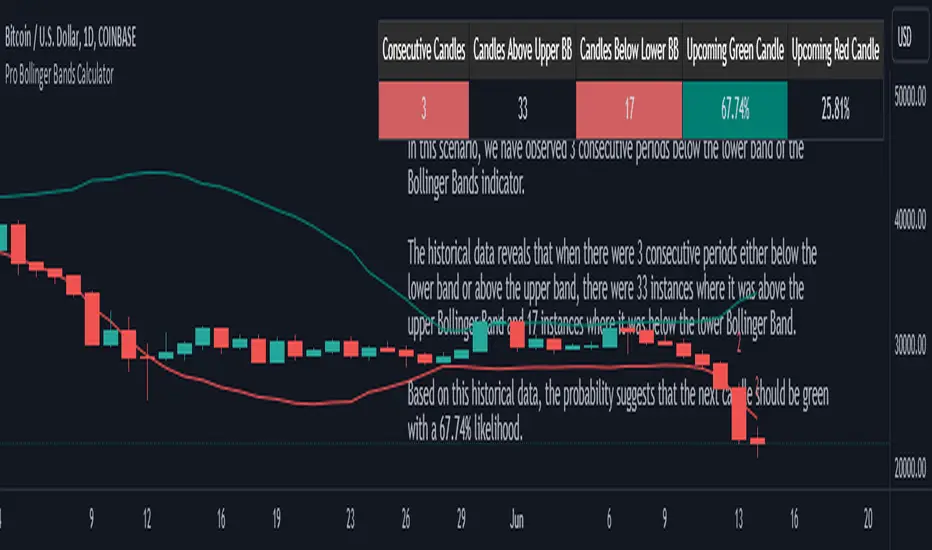
Pro Bollinger Bands CalculatorThe "Pro Bollinger Bands Calculator" indicator joins our suite of custom trading tools, which includes the "Pro Supertrend Calculator", the "Pro RSI Calculator" and the "Pro Momentum Calculator."
Expanding on this series, the "Pro Bollinger Bands Calculator" is tailored to offer traders deeper insights into market dynamics by harnessing the power of the Bollinger Bands indicator.
Its core mission remains unchanged: to scrutinize historical price data and provide informed predictions about future price movements, with a specific focus on detecting potential bullish (green) or bearish (red) candlestick patterns.
1. Bollinger Bands Calculation:
The indicator kicks off by computing the Bollinger Bands, a well-known volatility indicator. It calculates two pivotal Bollinger Bands parameters:
- Bollinger Bands Length: This parameter sets the lookback period for Bollinger Bands calculations.
- Bollinger Bands Deviation: It determines the deviation multiplier for the upper and lower bands, typically set at 2.0.
2. Visualizing Bollinger Bands:
The Bollinger Bands derived from the calculations are skillfully plotted on the price chart:
- Red Line: Represents the upper Bollinger Band during bearish trends, suggesting potential price declines.
- Teal Line: Represents the lower Bollinger Band in bullish market conditions, signaling the possibility of price increases.
3.Analyzing Consecutive Candlesticks:
The indicator's core functionality revolves around tracking consecutive candlestick patterns based on their relationship with the Bollinger Bands lines. To be considered for analysis, a candlestick must consistently close either above (green candles) or below (red candles) the Bollinger Bands lines for multiple consecutive periods.
4. Labeling and Enumeration:
To convey the count of consecutive candles displaying consistent trend behavior, the indicator meticulously assigns labels to the price chart. The position of these labels varies depending on the direction of the trend, appearing either below (for bullish patterns) or above (for bearish patterns) the candlesticks. The label colors match the candle colors: green labels for bullish candles and red labels for bearish ones.
5. Tabular Data Presentation:
The indicator complements its graphical analysis with a customizable table that prominently displays comprehensive statistical insights. Key data points within the table encompass:
- Consecutive Candles: The count of consecutive candles displaying consistent trend characteristics.
- Candles Above Upper BB: The number of candles closing above the upper Bollinger Band during the consecutive period.
- Candles Below Lower BB: The number of candles closing below the lower Bollinger Band during the consecutive period.
- Upcoming Green Candle: An estimated probability of the next candlestick being bullish, derived from historical data.
- Upcoming Red Candle: An estimated probability of the next candlestick being bearish, also based on historical data.
6. Custom Configuration:
To cater to diverse trading strategies and preferences, the indicator offers extensive customization options. Traders can fine-tune parameters such as Bollinger Bands length, upper and lower band deviations, label and table placement, and table size to align with their unique trading approaches.
Bollinger Band Alert with RSI Filter IndicatorThis code is for a technical analysis indicator called Bollinger Band Alert with RSI Filter. It uses two tools: Bollinger Bands and Relative Strength Index (RSI) to identify potential trading signals in the market.
Bollinger Bands are lines plotted two standard deviations away from a simple moving average of the price of a stock or asset. They help traders determine whether prices are high or low on a relative basis.
The RSI is a momentum indicator that measures the strength of recent price changes to evaluate whether an asset is overbought or oversold.
The code has some input parameters that a user can change, such as length and multiplier, which are used to calculate the Bollinger Bands, and upper and lower RSI levels to define the overbought and oversold zones.
The code then uses if statements to generate alerts if certain conditions are met. The alert condition is triggered if the close price of an asset crosses above or below the upper or lower Bollinger Bands, and if the RSI is either above or below the overbought or oversold threshold levels.
Finally, the code generates plots to visualize the Bollinger Bands and displays triangles above or below the bars indicating when to enter a long or short position based on the strategy's criteria.

Trending Bollinger Bands by SiddWolfBollinger Bands are mostly used for trend reversal. I believe they should be used for Trend Continuation and Trend Confirmation.
In this Trending Bollinger Bands script you will see two bands drawn on chart. The Upper band is suggestive of Uptrend and Lower Band is suggestive of Downtrend Market. It just provides the guidance of where the market is now and where it is headed. It is not to be used as a standalone indicator. Use this to confirm your hypothesis of Uptrend or Downtrend.
Bollinger Bands Trend
When the price crosses the moving average it is interpreted as the price is gonna continue in that direction. But most of the time it is a fake breakout. With this script you get an additional confirmation so that you know it is not a fake breakout and the price have caught the trend.
Bollinger Bands Reversal:
This indicator can also work for reversal. For example when price closes outside the outer bands, it is most likely that the trend is gonna reverse. Don't just enter the trade wait for some other confirmation as reversal trading is more complicated.
Confluence:
Confluence is the key factor for profitable trading. Don't use this indicator as standalone indicator instead combine it with other indicators and price action. Like the divergence occurring when the price is outside the bands is suggestive of trend reversal. I have created a non-delay, non-repaint indicator for finding divergence. I'd soon publish that script. Stay tuned.
Settings is the Key:
Try to play around with the settings. It is a simple yet effective indicator. Change the moving average type or length. I've found moving average RMA or WMA works better than SMA. Find the best setting that works with your setup. Set the Band Source as High/Low to make the outer bands more extreme.
Conclusion:
This is my first script but it isn't my last. I've created quite a few gems that I'm gonna publish soon. If you have any questions or suggestions feel free to comment below. I'd love to connect with you. Thank you.

Volume Adaptive Bollinger Bands (MZ VABB)This indicator is a functional enhancement to John Bollinger's Bollinger Bands. I've used Volume to adapt dynamic length which is used in basis (middle line) of Bollinger Bands and Simple Moving Average is replaced with Adaptive Ehlers Deviation Scaled Moving Average ( AEDSMA ).
BOLLINGER BANDS BASIC USAGE AND LIMITATIONS
Bollinger bands are popular among traders because of their simple way to detect volatility in market and redefine support and resistance accordingly. These are some basic usages of original Bollinger Bands:
Most commonly Bollinger Band works on 20 period Simple Moving Average as Basis / Middle Line and standard deviation of 2 for volatility detection.
Upper and lower bands can act as support and resistance which accordingly update with standard deviation of same period as of Simple Moving Average.
As upper and lower bands act as volatility measure which benefits in Squeeze detection and breakout trading.
Among all the usages there are some limitations as follows:
Original Bollinger Bands use 20 period Simple Moving Average as Basis which itself restricted to some number of data pints and if market moves in one direction or simply goes sideways for long time; candles can stay on either bands for long time. This gives benefit for staying in directional trade but will completely nullify the use of both bands as support and resistance.
Above point simply be explained as markets can stay overbought / oversold for long time and one way to make Bollinger Bands more useful is to simply use higher periods in SMA but as we know with higher periods SMA becomes more laggy and less adaptive.
Most traders use BBs alongside some other Volume Oscillator for example "On Balance Volume" but that does solve BBs limitations issue that it should be more adaptive to detect volatility in market.
VOLUME ADAPTIVE BOLLINGER BAND WORKING PRINCIPLE
Best way to make original Bollinger band more adaptive was to just use dynamic length instead on constant 20 period. This dynamic length had to be based on some other powerful parameter which can't be volatility as BB itself is a volatility indicator and adapting its length based volatility would have been superimposing volatility on Bollinger bands giving unrealistic results.
For adaptive length, I tried using Volume and for this purpose I used my Relative Volume Strength Index " RVSI " indicator. RVSI is the best way to detect if Volume is going for a breakout or not and based on that indication length of Bollinger Band Basis Moving Average changes.
RVSI breaking above provided value would indicate Volume breakout and hence dynamic length would accordingly make Bollinger band basis moving average more over fitted and similarly standard deviation of achieved dynamic length would give better bands for support and resistance. Similar case would happen if Volume goes down and dynamic length becomes more underfit.
According to my back testing studies I found that Simple Moving Average wasn't the best choice for dynamic length usage in Bollinger Band Basis. So, I used Adaptive Ehlers Deviation Scaled Moving Average ( AEDSMA ) which is more adaptive and already modified to adapt with RVSI.
SLOPE USAGE FOR TREND STRENGTH DETCTION
Volume Adaptive Bollinger Bands are more reactive to market trends so, I used slope for trend strength detection.
If slope of Volume Adaptive Bollinger Band Basis (i.e. AEDSMA ), Upper and Lower Bands is supporting a trend at same time then script will provide signal in that direction. That signal can also use Volume as confirmation if Bollinger Bands trend direction is supported by Volume or not.
DYNAMIC COLORS AND TREND CORRELATION
I’ve used dynamic coloring in Basis ( AEDSMA ) to identify trends with more detail which are as follows:
Lime Color: Slope supported Strong Uptrend also supported by Volume and Volatility or whatever you’ve chosen from both of them.
Fuchsia Color: Weak uptrend only supported by Slope or whatever you’ve selected.
Red Color: Slope supported Strong Downtrend also supported by Volume and Volatility or whatever you’ve chosen from both of them.
Grey Color: Weak Downtrend only supported by Slope or whatever you’ve selected.
Yellow Color: Possible reversal indication by Slope if enabled. Market is either sideways, consolidating or showing choppiness during that period.
SIGNALS
Green Circle: Market good for long with support of Volume and Volatility or whatever you’ve chosen from both of them.
Red Circle: Market good to short with support from Volume and Volatility or whatever you’ve chosen from both of them.
Flag: Market either touched upper or lower band and can act as good TP and warning for reversal.
FIBONACCI BANDS
I’ve included Fibonacci multiple bands which would act as good support/resistance zones. For example, 0.618 Fib level act as good local support and resistance in both upper and lower zones. Fibonacci values can be modified but should be lower than 1.
DEFAULT SETTINGS
I’ve set default Minimum length to 50 and Maximum length to 100 which I’ve found works best for almost all timeframes but you can change this delta to adapt your timeframe accordingly with more precision.
Dynamic length adoption is enabled based on Volume only but volatility can be selected which is already explained above.
Trend signals are enabled based on Slope and Volume but Volatility can be enabled for more precise confirmations.
In “ RVSI ” settings "Klinger Volume Oscillator" is set to default but others work good too especially Volume Zone Oscillator. For more details about Volume Breakout you can check “MZ RVSI Indicator".
ATR breakout is set to be positive if period 14 exceeds period 46 but can be changed if more adaption with volatility is required.
EDSMA super smoother filter length is set to 20 which can be increased to 50 or more for better smoothing but this will also change slope results accordingly.
EDSMA super smoother filter poles are set to 2 because found better results with 2 instead of 3.
FURTHER ENHANCEMENTS
So far, I've achieved better results with "Klinger Volume Oscillator" in RVSI but TFS Volume Oscillator and On Balance Volume can be used which would change dynamic length differently. It doesn't mean that results would be wrong with some oscillator and precise with others but every oscillator works in its specific way for and RVSI just detect strength of Volume based on provided oscillator.

LAGging span leaves Bollinger Bands strategyAbstract
This script points out the positions a lagging span leaves a Bollinger Band.
This script does not plot a lagging span but moves the Bollinger Band forward.
You can find profit opportunities by combining this script and risk management.
Introduction
Bollinger Bands is a popular indicator.
It contains a moving average, an upper band and a lower band.
The moving average can indicate trend, the upper band and the lower band can indicate if the price is far away from the moving average.
However, in trading markets, anything can happen.
Both continuation and reversal are possible when the price touches the moving average, the upper band or the lower band.
Therefore, many traders adjust the parameters of the Bollinder Band or add other indicators to improve their trading strategies.
@Daveatt et. al. provided an idea that uses a lagging span.
A lagging span is a line chart. It displays the reference price but in earlier time.
For example, if the offset of a lagging span is 26 days, the value of the lagging span on 29 days ago is the reference price 3 days ago.
A lagging span is a part of Ichimoku Cloud.
It can compare the price to the earlier price and the values of indicators in the past.
To compare the price to the values of indicators in the past, we can also shift indicators forward instead of adding a lagging span into the chart.
This script uses shift-the-indicators-forward method.
In other words, this script plots the Bollinger Band forward so that the price can be compared to the values of the Bollinger Band in the past.
Computing and Adjusting
(1) Compute Moving Average
(2) Compute Standard Derivation
(3) Upper Band = Moving Average + Standard Derivation * Multi
(4) Lower Band = Moving Average - Standard Derivation * Multi
(5) Shift the Bollinger Band forward according to the offset parameter.
(6) Mark the points the price leaves the shifted Bollinger Band
(7) Compute the most possible loss and profit before the next opposite signal.
Parameters
source : the data for computing the bollinger band. can be open, high, low, close or their combination.
length : how many days are calculated by the bollinger band
mult : the distance from the moving average to the upper band and the distance from the moving average to the upper band is equal to ( mult * standard derivation ) .
x_offset : the offset of the lagging span
Conclusion
This script can find signals for potential breakout or trend continuation.
If you want to use this signal well, you need to know when to cut loss and protect the profit.
Reference
@Daveatt , Bollinger bands/Lagging span cross , BGyrPgOA , Tradingview 2019
How to trade with Bollinger Bands
How to use Ichimoku Cloud
How to trade with a line chart

Bollinger Band Open Gap Alert V1This is the bare bones of what I'm trying to achieve through pine script. The purpose of the script is to:
1. On a 15m chart, calculate and plot upper & lower Bollinger bands and simple moving average of 20 periods. (DONE)
2. On a new day, when the first 15m candle of a session forms, I want to check if a) the low of the new candle is outside the upper Bollinger band (also known as an open gap up) or b) if the high of the candle is the outside the lower Bollinger band (also known as open gap down). In other words, I want to know if the Bollinger Bands are not touching the new candle's wicks/shadows. (DONE)
3. Alert me if the above happens. (DONE)
4. Run the indicator through an entire watch list. I'm not sure if that's possible, yet. (HELP)
For the above job, this is what I could come up with. I need guidance for the last step . And any suggestions for corrections or improvements would be greatly appreciated!
Bollinger Bands Squeeze📈 Bollinger Bands Squeeze
This indicator enhances traditional Bollinger Bands by integrating Keltner Channel layers to visualize market compression and volatility expansion — allowing traders to easily identify when a squeeze is building or releasing.
🔍 Overview
This is a refined version of the classic Bollinger Bands, designed to detect volatility squeezes using multiple Keltner Channel thresholds.
The script plots standard Bollinger Bands and dynamically colors the bands according to the degree of compression relative to the Keltner Channels.
⚙️ How It Works
Bollinger Bands are calculated from a selected moving average (SMA, EMA, SMMA, WMA, or VWMA) and standard deviation multiplier.
Keltner Channels are derived from ATR (True Range) using three sensitivity levels (1.0, 1.5, and 2.0× multipliers).
When Bollinger Bands contract inside a Keltner Channel, the script marks a squeeze state:
🟠 High Compression (Orange): Very tight volatility — expect breakout soon.
🔴 Mid Compression (Red): Moderate contraction — volatility is building.
⚫ Low Compression (Gray/Black): Early compression phase.
🧩 Inputs & Customization
Length : Period for both Bollinger and Keltner calculations.
Basis MA Type: Choose from SMA, EMA, SMMA (RMA), WMA, or VWMA.
StdDev Multiplier : Controls Bollinger Bandwidth.
Keltner Multipliers (1.0 / 1.5 / 2.0) : Adjust compression thresholds.
Offset : Shifts the bands visually on the chart.
🕹️ Best Use Cases
Identify pre-breakout conditions before volatility expansion.
Combine with volume, momentum, or trend indicators (e.g., RSI) for confirmation.
Ideal for scalping, breakout trading, or volatility-based entries during session opens.
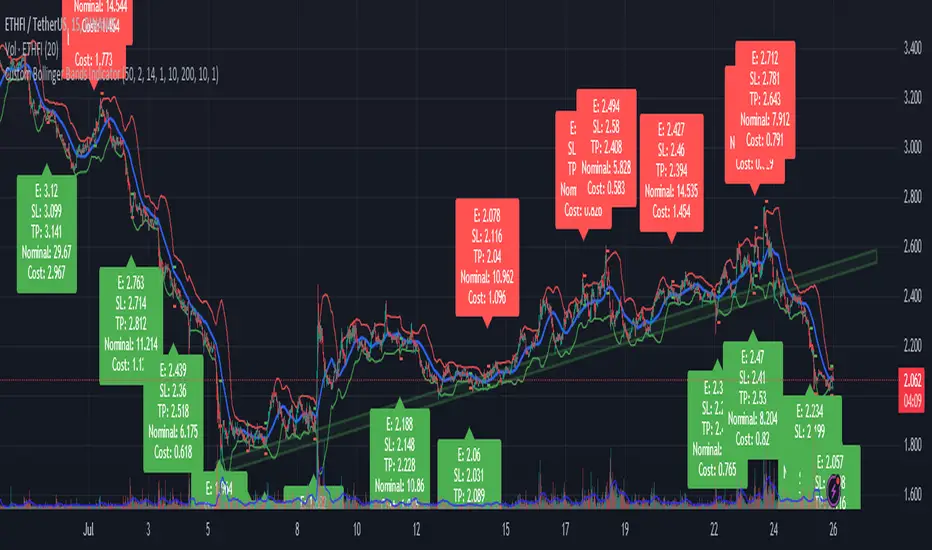
Chieu - Bollinger Bands SMA 50 StrategyOverview
The Custom Bollinger Bands Indicator is a versatile tool designed to help traders identify potential market reversals and optimize their trading strategies. This indicator combines Bollinger Bands with an ATR-based stop-loss mechanism, configurable take-profit levels, and dynamic position sizing to manage risk effectively. By highlighting key market conditions and providing clear visual cues, it enables traders to make informed decisions and execute trades with precision.
Key Features
Bollinger Bands Calculation:
The indicator calculates Bollinger Bands based on a configurable Simple Moving Average (SMA) length.
Standard deviation multiplier is adjustable, allowing traders to fine-tune the width of the bands.
Candlestick Highlighting:
Candles that touch the upper or lower Bollinger Bands are highlighted, indicating potential overbought or oversold conditions.
Reversal candles are identified and highlighted based on specific criteria:
The candle must touch the Bollinger Bands for two consecutive periods.
The reversal candle must have a body at least twice the size of the previous candle's body.
The reversal candle must close in the opposite direction to the previous candle (e.g., a bullish candle following a bearish one).
Stop-Loss and Take-Profit Levels:
Stop-loss levels are calculated using the ATR (Average True Range) indicator, ensuring they are dynamically adjusted based on market volatility.
Two configurable take-profit levels (1R and 2R) are plotted based on the initial risk (distance between entry and stop-loss).
Take-profit and stop-loss lines are visually represented on the chart for easy reference.
Position Sizing and Risk Management:
The indicator includes configurable inputs for account balance, leverage, and risk percentage.
It calculates the nominal value (position size without leverage) and cost value (position size with leverage) based on the specified risk parameters.
Combined labels display SL, TP, nominal value, and cost value, replacing the default "Reversal" text for clear, concise information.
Customization Options:
Users can configure the length of the take-profit lines.
The option to toggle the highlighting of candles touching the Bollinger Bands on or off, while always highlighting the identified reversal candles.
How to Use
Configuration:
Set the desired SMA length and Bollinger Bands multiplier in the input settings.
Configure the ATR length for accurate stop-loss calculations.
Adjust the risk-reward ratio and take-profit line length according to your trading strategy.
Specify your account balance, leverage, and risk percentage for precise position sizing.
Chart Analysis:
Monitor the chart for candles touching the upper or lower Bollinger Bands. These highlights indicate potential overbought or oversold conditions.
Look for highlighted reversal candles, which meet the specified criteria and suggest a potential market reversal.
Use the plotted stop-loss and take-profit lines to manage your trades effectively. The combined labels provide all necessary information (SL, TP, nominal value, and cost value) for quick decision-making.
Execution and Risk Management:
Enter trades based on the reversal candle signals.
Set your stop-loss at the indicated level using the ATR calculation.
Take partial profits at the first take-profit level (1R) and adjust your stop-loss to the entry point to secure the remaining position.
Exit the trade entirely at the second take-profit level (2R) or if the price returns to the adjusted stop-loss level.
Fibonacci Bollinger Volume Weighted DeviationDiscover market dynamics with the 'Fibonacci Bollinger Volume Weighted Deviation' indicator – a unique tool blending Fibonacci ratios, Bollinger Bands, and volume-weighted analysis. Ideal for spotting overbought/oversold conditions and potential market turnarounds, this indicator is a must-have for traders seeking nuanced insights into price behavior and volatility.
Description:
"The 'Fibonacci Bollinger Volume Weighted Deviation' indicator presents a novel approach to market trend analysis by integrating Fibonacci ratios with the classic concept of Bollinger Bands. Designed for traders who incorporate Fibonacci levels in their market analysis, this indicator adapts Bollinger Bands to a user-defined Fibonacci ratio. It creates dynamic upper and lower bands around a Simple Moving Average (SMA), offering insights into price deviations and potential overbought or oversold market states.
Incorporating volume data, this indicator provides a volume-weighted perspective of price deviations. This feature is crucial in gauging the market sentiment, as significant volumes linked with price deviations can signal strong market moves. By plotting these deviations and emphasizing those that significantly diverge from the volume-weighted average, it aids in pinpointing potential turning points or key support and resistance zones.
Versatile in nature, the 'Fibonacci Bollinger Volume Weighted Deviation' indicator is adaptable to various trading styles and market conditions. It proves especially valuable in markets where Fibonacci levels are a key factor. Traders can explore long positions when prices fall below the lower band and consider short positions when prices breach the upper band. The addition of volume-weighted deviation analysis refines these trading signals, offering a more sophisticated and nuanced decision-making process for entries and exits.
As a standalone tool or in conjunction with other technical instruments, this indicator is an invaluable addition to any technical analyst's toolkit. It not only enhances traditional Fibonacci and Bollinger Band methodologies but also integrates volume analysis to provide a comprehensive view of market trends and movements."
Bollinger Bands StrategyBollinger Bands Strategy :
INTRODUCTION :
This strategy is based on the famous Bollinger Bands. These are constructed using a standard moving average (SMA) and the standard deviation of past prices. The theory goes that 90% of the time, the price is contained between these two bands. If it were to break out, this would mean either a reversal or a continuation. However, when a reversal occurs, the movement is weak, whereas when a continuation occurs, the movement is substantial and profits can be interesting. We're going to use BB to take advantage of this strong upcoming movement, while managing our risks reasonably. There's also a money management method for reinvesting part of the profits or reducing the size of orders in the event of substantial losses.
BOLLINGER BANDS :
The construction of Bollinger bands is straightforward. First, plot the SMA of the price, with a length specified by the user. Then calculate the standard deviation to measure price dispersion in relation to the mean, using this formula :
stdv = (((P1 - avg)^2 + (P2 - avg)^2 + ... + (Pn - avg)^2) / n)^1/2
To plot the two Bollinger bands, we then add a user-defined number of standard deviations to the initial SMA. The default is to add 2. The result is :
Upper_band = SMA + 2*stdv
Lower_band = SMA - 2*stdv
When the price leaves this channel defined by the bands, we obtain buy and sell signals.
PARAMETERS :
BB Length : This is the length of the Bollinger Bands, i.e. the length of the SMA used to plot the bands, and the length of the price series used to calculate the standard deviation. The default is 120.
Standard Deviation Multipler : adds or subtracts this number of times the standard deviation from the initial SMA. Default is 2.
SMA Exit Signal Length : Exit signals for winning and losing trades are triggered by another SMA. This parameter defines the length of this SMA. The default is 110.
Max Risk per trade (in %) : It's the maximum percentage the user can lose in one trade. The default is 6%.
Fixed Ratio : This is the amount of gain or loss at which the order quantity is changed. The default is 400, meaning that for each $400 gain or loss, the order size is increased or decreased by a user-selected amount.
Increasing Order Amount : This is the amount to be added to or subtracted from orders when the fixed ratio is reached. The default is $200, which means that for every $400 gain, $200 is reinvested in the strategy. On the other hand, for every $400 loss, the order size is reduced by $200.
Initial capital : $1000
Fees : Interactive Broker fees apply to this strategy. They are set at 0.18% of the trade value.
Slippage : 3 ticks or $0.03 per trade. Corresponds to the latency time between the moment the signal is received and the moment the order is executed by the broker.
Important : A bot has been used to test the different parameters and determine which ones maximize return while limiting drawdown. This strategy is the most optimal on BITSTAMP:BTCUSD in 8h timeframe with the following parameters :
BB Length = 120
Standard Deviation Multipler = 2
SMA Exit Signal Length = 110
Max Risk per trade (in %) = 6%
ENTER RULES :
The entry rules are simple:
If close > Upper_band it's a LONG signal
If close < Lower_band it's a SHORT signal
EXIT RULES :
If we are LONG and close < SMA_EXIT, position is closed
If we are SHORT and close > SMA_EXIT, the position is closed
Positions close automatically if they lose more than 6% to limit risk
RISK MANAGEMENT :
This strategy is subject to losses. We manage our risk using the exit SMA or using a SL sets to 6%. This SMA gives us exit signals when the price closes below or above, thus limiting losses. If the signal arrives too late, the position is closed after a loss of 6%.
MONEY MANAGEMENT :
The fixed ratio method was used to manage our gains and losses. For each gain of an amount equal to the fixed ratio value, we increase the order size by a value defined by the user in the "Increasing order amount" parameter. Similarly, each time we lose an amount equal to the value of the fixed ratio, we decrease the order size by the same user-defined value. This strategy increases both performance and drawdown.
NOTE :
Please note that the strategy is backtested from 2017-01-01. As the timeframe is 8h, this strategy is a medium/long-term strategy. That's why only 51 trades were closed. Be careful, as the test sample is small and performance may not necessarily reflect what may happen in the future.
Enjoy the strategy and don't forget to take the trade :)

Bollinger Bands & Fibonacci StrategyThe Bollinger Bands & Fibonacci Strategy is a powerful technical analysis trading strategy designed to identify potential entry and exit points in financial markets. This strategy combines two widely used indicators, Bollinger Bands and Fibonacci retracement levels, to assist traders in making informed trading decisions.
Key Features:
Bollinger Bands: This strategy utilizes Bollinger Bands, a volatility-based indicator that consists of an upper band, a lower band, and a middle (basis) line. Bollinger Bands help traders visualize price volatility and potential reversal points.
Fibonacci Retracement Levels: Fibonacci retracement levels are essential tools for identifying potential support and resistance levels in price charts. This strategy incorporates Fibonacci retracement levels, including the 0% and 100% levels, to aid in pinpointing key price levels.
Long and Short Signals: The strategy generates long (buy) and short (sell) signals based on specific conditions derived from Bollinger Bands and Fibonacci levels. Long signals are generated when price crosses above the upper Bollinger Band and when the price is above the Fibonacci low level. Short signals are generated when price crosses below the lower Bollinger Band and when the price is below the Fibonacci high level.
Position Management: To prevent multiple concurrent positions of the same type (long or short), the strategy employs position management logic. It tracks open positions and ensures that only one position type is active at a time.
Exit Conditions: The strategy includes customizable exit conditions to manage and close open positions. Traders can fine-tune exit criteria to align with their risk management and profit-taking strategies.
User-Friendly: This strategy script is user-friendly and can be easily integrated into the TradingView platform, allowing traders to apply it to various financial instruments and timeframes.
Usage:
Traders and investors can apply the Bollinger Bands & Fibonacci Strategy to a wide range of financial markets, including stocks, forex, commodities, and cryptocurrencies. It can be adapted to different timeframes to suit various trading styles, from day trading to swing trading.
Disclaimer:
Trading carries inherent risks, and this strategy is no exception. It is essential to use proper risk management techniques, including stop-loss orders, and thoroughly backtest the strategy on historical data before implementing it in live trading.
The Bollinger Bands & Fibonacci Strategy is a valuable tool for technical traders seeking well-defined entry and exit points based on robust indicators. It can serve as a foundation for traders to build and customize their trading strategies according to their individual preferences and risk tolerance.
Feel free to customize this description to add any additional details or specifications unique to your strategy. When publishing your strategy on a trading platform like TradingView, a clear and informative description can help potential users understand and use your strategy effectively.

Bollinger Bands Heatmap (BBH)The Bollinger Bands Heatmap (BBH) Indicator provides a unique visualization of Bollinger Bands by displaying the full distribution of prices as a heatmap overlaying your price chart. Unlike traditional Bollinger Bands, which plot the mean and standard deviation as lines, BBH illustrates the entire statistical distribution of prices based on a normal distribution model.
This heatmap indicator offers traders a visually appealing way to understand the probabilities associated with different price levels. The lower the weight of a certain level, the more transparent it appears on the heatmap, making it easier to identify key areas of interest at a glance.
Key Features
Dynamic Heatmap: Changes in real-time as new price data comes in.
Fully Customizable: Adjust the scale, offset, alpha, and other parameters to suit your trading style.
Visually Engaging: Uses gradients of colors to distinguish between high and low probabilities.
Settings
Scale
Tooltip: Scale the size of the heatmap.
Purpose: The 'Scale' setting allows you to adjust the dimensions of each heatmap box. A higher value will result in larger boxes and a more generalized view, while a lower value will make the boxes smaller, offering a more detailed look at price distributions.
Values: You can set this from a minimum of 0.125, stepping up by increments of 0.125.
Scale ATR Length
Tooltip: The ATR used to scale the heatmap boxes.
Purpose: This setting is designed to adapt the heatmap to the instrument's volatility. It determines the length of the Average True Range (ATR) used to size the heatmap boxes.
Values: Minimum allowable value is 5. You can increase this to capture more bars in the ATR calculation for greater smoothing.
Offset
Tooltip: Offset mean by ATR.
Purpose: The 'Offset' setting allows you to shift the mean value by a specified ATR. This could be useful for strategies that aim to capitalize on extreme price movements.
Values: The value can be any floating-point number. Positive values shift the mean upward, while negative values shift it downward.
Multiplier
Tooltip: Bollinger Bands Multiplier.
Purpose: The 'Multiplier' setting determines how wide the Bollinger Bands are around the mean. A higher value will result in a wider heatmap, capturing more extreme price movements. A lower value will tighten the heatmap around the mean price.
Values: The minimum is 0, and you can increase this in steps of 0.2.
Length
Tooltip: Length of Simple Moving Average (SMA).
Purpose: This setting specifies the period for the Simple Moving Average that serves as the basis for the Bollinger Bands. A higher value will produce a smoother average, while a lower value will make it more responsive to price changes.
Values: Can be set to any integer value.
Heat Map Alpha
Tooltip: Opacity level of the heatmap.
Purpose: This controls the transparency of the heatmap. A lower value will make the heatmap more transparent, allowing you to see the price action more clearly. A higher value will make the heatmap more opaque, emphasizing the bands.
Values: Ranges from 0 (completely transparent) to 100 (completely opaque).
Color Settings
High Color & Low Color: These settings allow you to customize the gradient colors of the heatmap.
Purpose: Use contrasting colors for better visibility or colors that you prefer. The 'High Color' is used for areas with high density (high probability), while the 'Low Color' is for low-density areas (low probability).
Usage Scenarios for Settings
For Volatile Markets: Increase 'Scale ATR Length' for better smoothing and set a higher 'Multiplier' to capture wider price movements.
For Trend Following: You might want to set a larger 'Length' for the SMA and adjust 'Scale' and 'Offset' to focus on more probable price zones.
These are just recommendations; feel free to experiment with these settings to suit your specific trading requirements.
How To Interpret
The heatmap gives a visual representation of the range within which prices are likely to move. Areas with high density (brighter color) indicate a higher probability of the price being in that range, whereas areas with low density (more transparent) indicate a lower probability.
Bright Areas: Considered high-probability zones where the price is more likely to be.
Transparent Areas: Considered low-probability zones where the price is less likely to be.
Tips For Use
Trend Confirmation: Use the heatmap along with other trend indicators to confirm the strength and direction of a trend.
Volatility: Use the density and spread of the heatmap as an indication of market volatility.
Entry and Exit: High-density areas could be potential support and resistance levels, aiding in entry and exit decisions.
Caution
The Bollinger Bands Heatmap assumes a normal distribution of prices. While this is a standard assumption in statistics, it is crucial to understand that real-world price movements may not always adhere to a normal distribution.
Conclusion
The Bollinger Bands Heatmap Indicator offers traders a fresh perspective on Bollinger Bands by transforming them into a visual, real-time heatmap. With its customizable settings and visually engaging display, BBH can be a useful tool for traders looking to understand price probabilities in a dynamic way.
Feel free to explore its features and adjust the settings to suit your trading strategy. Happy trading!

Bollinger Bands Liquidity Cloud [ChartPrime]This indicator overlays a heatmap on the price chart, providing a detailed representation of Bollinger bands' profile. It offers insights into the price's behavior relative to these bands. There are two visualization styles to choose from: the Volume Profile and the Z-Score method.
Features
Volume Profile: This method illustrates how the price interacts with the Bollinger bands based on the traded volume.
Z-Score: In this mode, the indicator samples the real distribution of Z-Scores within a specified window and rescales this distribution to the desired sample size. It then maps the distribution as a heatmap by calculating the corresponding price for each Z-Score sample and representing its weight via color and transparency.
Parameters
Length: The period for the simple moving average that forms the base for the Bollinger bands.
Multiplier: The number of standard deviations from the moving average to plot the upper and lower Bollinger bands.
Main:
Style: Choose between "Volume" and "Z-Score" visual styles.
Sample Size: The size of the bin. Affects the granularity of the heatmap.
Window Size: The lookback window for calculating the heatmap. When set to Z-Score, a value of `0` implies using all available data. It's advisable to either use `0` or the highest practical value when using the Z-Score method.
Lookback: The amount of historical data you want the heatmap to represent on the chart.
Smoothing: Implements sinc smoothing to the distribution. It smoothens out the heatmap to provide a clearer visual representation.
Heat Map Alpha: Controls the transparency of the heatmap. A higher value makes it more opaque, while a lower value makes it more transparent.
Weight Score Overlay: A toggle that, when enabled, displays a letter score (`S`, `A`, `B`, `C`, `D`) inside the heatmap boxes, based on the weight of each data point. The scoring system categorizes each weight into one of these letters using the provided percentile ranks and the median.
Color
Color: Color for high values.
Standard Deviation Color: Color to represent the standard deviation on the Bollinger bands.
Text Color: Determines the color of the letter score inside the heatmap boxes. Adjusting this parameter ensures that the score is visible against the heatmap color.
Usage
Once this indicator is applied to your chart, the heatmap will be overlaid on the price chart, providing a visual representation of the price's behavior in relation to the Bollinger bands. The intensity of the heatmap is directly tied to the price action's intensity, defined by your chosen parameters.
When employing the Volume Profile style, a brighter and more intense area on the heatmap indicates a higher trading volume within that specific price range. On the other hand, if you opt for the Z-Score method, the intensity of the heatmap reflects the Z-Score distribution. Here, a stronger intensity is synonymous with a more frequent occurrence of a specific Z-Score.
For those seeking an added layer of granularity, there's the "Weight Score Overlay" feature. When activated, each box in your heatmap will sport a letter score, ranging from `S` to `D`. This score categorizes the weight of each data point, offering a concise breakdown:
- `S`: Data points with a weight of 1.
- `A`: Weights below 1 but greater than or equal to the 75th percentile rank.
- `B`: Weights under the 75th percentile but at or above the median.
- `C`: Weights beneath the median but surpassing the 25th percentile rank.
- `D`: All that fall below the 25th percentile rank.
This scoring feature augments the heatmap's visual data, facilitating a quicker interpretation of the weight distribution across the dataset.
Further Explanations
Volume Profile
A volume profile is a tool used by traders to visualize the amount of trading volume occurring at specific price levels. This kind of profile provides a deep insight into the market's structure and helps traders identify key areas of support and resistance, based on where the most trading activity took place. The concept behind the volume profile is that the amount of volume at each price level can indicate the potential importance of that price.
In this indicator:
- The volume profile mode creates a visual representation by sampling trading volumes across price levels.
- The representation displays the balance between bullish and bearish volumes at each level, which is further differentiated using a color gradient from `low_color` to `high_color`.
- The volume profile becomes more refined with sinc smoothing, helping to produce a smoother distribution of volumes.
Z-Score and Distribution Resampling
Z-Score, in the context of trading, represents the number of standard deviations a data point (e.g., closing price) is from the mean (average). It’s a measure of how unusual or typical a particular data point is in relation to all the data. In simpler terms, a high Z-Score indicates that the data point is far away from the mean, while a low Z-Score suggests it's close to the mean.
The unique feature of this indicator is that it samples the real distribution of z-scores within a window and then resamples this distribution to fit the desired sample size. This process is termed as "resampling in the context of distribution sampling" . Resampling provides a way to reconstruct and potentially simplify the original distribution of z-scores, making it easier for traders to interpret.
In this indicator:
- Each Z-Score corresponds to a price value on the chart.
- The resampled distribution is then used to display the heatmap, with each Z-Score related price level getting a heatmap box. The weight (or importance) of each box is represented as a combination of color and transparency.
How to Interpret the Z-Score Distribution Visualization:
When interpreting the Z-Score distribution through color and alpha in the visualization, it's vital to understand that you're seeing a representation of how unusual or typical certain data points are without directly viewing the numerical Z-Score values. Here's how you can interpret it:
Intensity of Color: This often corresponds to the distance a particular data point is from the mean.
Lighter shades (closer to `low_color`) typically indicate data points that are more extreme, suggesting overbought or oversold conditions. These could signify potential reversals or significant deviations from the norm.
Darker shades (closer to `high_color`) represent data points closer to the mean, suggesting that the price is relatively typical compared to the historical data within the given window.
Alpha (Transparency): The degree of transparency can indicate the significance or confidence of the observed deviation. More opaque boxes might suggest a stronger or more reliable deviation from the mean, implying that the observed behavior is less likely to be a random occurrence.
More transparent boxes could denote less certainty or a weaker deviation, meaning that the observed price behavior might not be as noteworthy.
- Combining Color and Alpha: By observing both the intensity of color and the level of transparency, you get a richer understanding. For example:
- A light, opaque box could suggest a strong, significant deviation from the mean, potentially signaling an overbought or oversold scenario.
- A dark, transparent box might indicate a weak, insignificant deviation, suggesting the price is behaving typically and is close to its average.

Bollinger Bands Modified (Stormer)This strategy is based and shown by trader and investor Alexandre Wolwacz "Stormer".
Overview
The strategy uses two indicators Bollinger Bands and EMA (optional for EMA).
Calculates Bollinger Bands, EMA, highest high, and lowest low values based on the input parameters, evaluating the conditions to determine potential long and short entry signals.
The conditions include checks for crossovers and crossunders of the price with the upper and lower Bollinger Bands, as well as the position of the price relative to the EMA.
The script also incorporates the option to add an inside bar pattern check for additional information.
Entry Position
Long Position:
Price cross over the superior band of bollinger bands.
The EMA is used to add support for trend analysis, it is an optional input, when used, it checks if price is above EMA.
Short Position:
Price cross under the inferior band of bollinger bands.
The EMA is used to add support for trend analysis, it is an optional input, when used, it checks if price is under EMA.
Risk Management
Stop Loss:
The stop loss is calculated based on the input highest high (for short position) and lowest low (for long position).
It gets the length based on the input from the last candles to set which is the highest high and which is the lowest low.
Take Profit:
According to the author, the profit target should be at least 1:1.6 the risk, so to have the strategy mathematically positive.
The profit target is configured input, can be increased or decreased.
It calculates the take profit based on the price of the stop loss with the profit target input.
