EMA 200 Monitor - Bybit CoinsEMA 200 Monitor - Bybit Coins
📊 OVERVIEW
The EMA 200 Monitor - Bybit Coins is an advanced indicator that automatically monitors 30 of the top cryptocurrencies traded on Bybit, alerting you when they are close to the 200-period Exponential Moving Average on the 4-hour timeframe.
This indicator was developed especially for traders who use the EMA 200 as a key support/resistance level in their swing trading and position trading strategies.
🎯 WHAT IT'S FOR
Multi-Asset Monitoring: Simultaneous monitoring of 30 cryptocurrencies without having to switch between charts
Opportunity Identification: Detects when coins are approaching the 200 EMA, a crucial technical level
Automated Alerts: Real-time notifications when a coin reaches the configured proximity
Time Efficiency: Eliminates the need to manually check chart collections
⚙️ HOW IT WORKS
Main Functionality
The indicator uses the request.security() function to fetch price data and calculate the 200 EMA of each monitored asset. With each new bar, the script:
Calculates the distance between the current price and the 200 EMA for each coin
Identifies proximity based on the configured percentage (default: 2%)
Displays results in a table organized on the chart
Generates automatic alerts when proximity is detected
Monitored Coins
Major : BTC, ETH, BNB, ADA, XRP, SOL, DOT, DOGE, AVAX
DeFi : UNI, LINK, ATOM, ICP, NEAR, OP, ARB, INJ
Memecoins : SHIB, PEPE, WIF, BONK, FLOKI
Emerging : SUI, TON, APT, POL (ex-MATIC)
📋 AVAILABLE SETTINGS
Adjustable Parameters
EMA Length (Default: 200): Exponential Moving Average Period
Proximity Percentage (Default: 2%): Distance in percentage to consider "close"
Show Table (Default: Active): Show/hide results table
Table Position: Position of the table on the chart (9 options available)
Color System
🔴 Red: Distance ≤ 1% (very close)
🟠 Orange: Distance ≤ 1.5% (close)
🟡 Yellow: Distance ≤ 2% (approaching)
🚀 HOW TO USE
Initial Configuration
Add the indicator to the 4-hour timeframe chart
Set the parameters according to your strategy
Position the table where there is no graphic preference
Setting Alerts
Click "Create Alert" in TradingView
Select the "EMA 200 Monitor" indicator
Set the notification frequency and method
Activate the alert to receive automatic notifications
Results Interpretation
The table shows:
Coin: Asset name (e.g. BTC, ETH)
Price: Current currency quote
EMA 200: Current value of the moving average
Distance: Percentage of proximity to the core code
💡 STRATEGIES TO USE
Reversal Trading
Entry: When price touches or approaches the EMA 200
Stop: Below/above the EMA with a safety margin
Target: Previous resistance/support levels
Breakout Trading
Monitoring: Watch for currencies consolidating near the EMA 200
Entry: When the media is finally broken
Confirmation: Volume and close above/below the EMA
Swing Trading
Identification: Use the monitor to detect setups in formation
Timing: Wait for the EMA 200 to approach for detailed analysis
Management: Use the EMA as a reference for stops dynamics
⚠️ IMPORTANT CONSIDERATIONS
Technical Limitations
Request Bybit data: Access to exchange symbols required
Specific timeframe: Optimized for 4-hour analysis
Minimum delay: Data updated with each new bar
Usage Recommendations
Combine with technical analysis: Use together with other indicators
Confirm the configuration: Check the graphic patterns before trading
Manage risk: Always use stop loss and adequate position sizing
Backtesting: Test your strategy before applying with real capital
Disclaimer
This indicator is a technical analysis tool and does not constitute investment advice. Always do your own analysis and manage detailed information about the risks of your operations.
🔧 TECHNICAL INFORMATION
Pine Script version: v6
Type: Indicator (overlay=true)
Compatibility: All TradingView plans
Resources used: request.security(), arrays, tables
Performance: Optimized for multiple simultaneous queries
📈 COMPETITIVE ADVANTAGES
✅ Simultaneous monitoring of 30 major assets ✅ Clear visual interface with intuitive core system ✅ Customizable alerts for different details ✅ Optimized code for maximum performance ✅ Flexible configuration adaptable to different strategies ✅ Real-time update without the need for manual refresh
Developed for traders who value efficiency and accuracy in identifying market opportunities based on the EMA 20
在腳本中搜尋"情绪指数板块+约200只股票+选股规则"

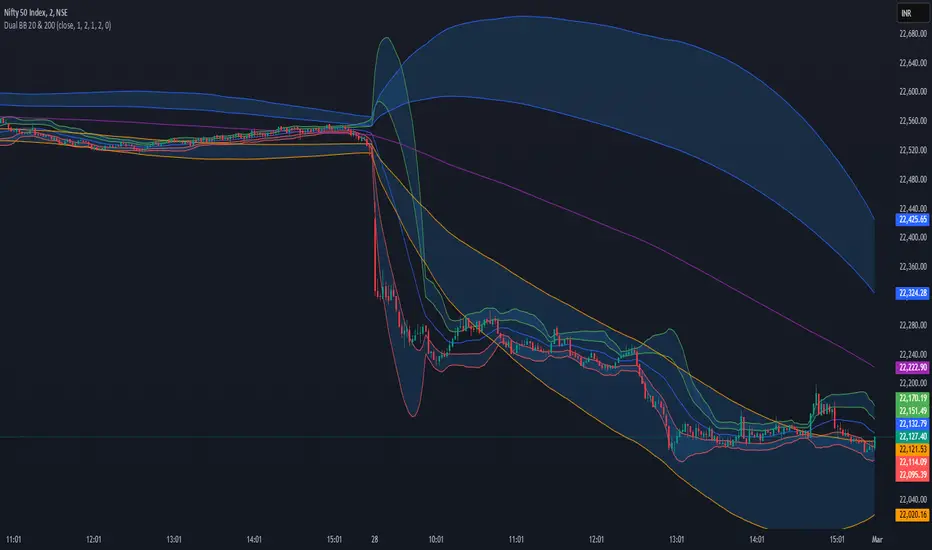
Dual Bollinger Bands (20 & 200)Dual Bollinger Bands (20 & 200) - Enhanced Trading Strategy
Overview
The Dual Bollinger Bands (20 & 200) indicator is an enhanced version of the Double Bollinger Bands by Alixnet. This advanced tool integrates two sets of Bollinger Bands with 20-period (short-term) and 200-period (long-term) moving averages, helping traders identify market trends, volatility, and potential trade setups more effectively.
Key Features
✅ Two Bollinger Band Sets – Short-term (20-period) and Long-term (200-period).
✅ Enable/Disable Each BB – Customize visibility for better analysis.
✅ Multiple Standard Deviations – Identify different levels of volatility.
✅ Background Fill for Clarity – Highlights volatility zones.
How to Use This Indicator Effectively
1. Understanding the Two Bollinger Bands
BB1 (20-Period): Measures short-term price movements and volatility.
BB2 (200-Period): Acts as a long-term trend filter to determine the dominant trend.
2. Trade Entries & Exits
Bullish Trade Setup (Long Entry)
🔹 Price Above 200 MA Basis Line (BB2) – Confirms an uptrend.
🔹 Price Pulls Back to the Lower Band of BB1 (20 MA) – Ideal buy opportunity.
🔹 Confirmation: If price bounces off the lower BB1 band and moves back toward the midline or upper band, enter a long position.
🔹 Exit: When price touches or exceeds the upper BB1 band.
Bearish Trade Setup (Short Entry)
🔹 Price Below 200 MA Basis Line (BB2) – Confirms a downtrend.
🔹 Price Pulls Back to the Upper Band of BB1 (20 MA) – Ideal short opportunity.
🔹 Confirmation: If price gets rejected at the upper BB1 band and moves downward, enter a short position.
🔹 Exit: When price reaches or drops below the lower BB1 band.
3. Avoiding Sideways Markets
❌ Avoid trading when price stays between the two bands of BB1 without breaking out.
❌ Flat 200 MA Line (BB2 Basis) indicates a ranging market – best to wait for a breakout.
✅ Wait for Price to Cross the 200 MA Basis Line to confirm trend direction before entering trades.
4. Catching Trending Moves
✅ Strong Trend Confirmation: When price stays above or below the 20-period BB bands and also above/below the 200-period MA.
✅ Trend Continuation: If price consolidates near the upper or lower bands without breaking opposite levels.
✅ Breakout Confirmation: Look for a candle close outside BB1 bands with momentum to confirm strong moves.
Final Thoughts
The Dual Bollinger Bands (20 & 200) indicator is a powerful tool for both short-term traders and long-term investors. By combining the short-term volatility of the 20-period BB with the long-term trend of the 200-period BB, traders can make more informed trading decisions, filter out noise, and capture high-probability trade setups.
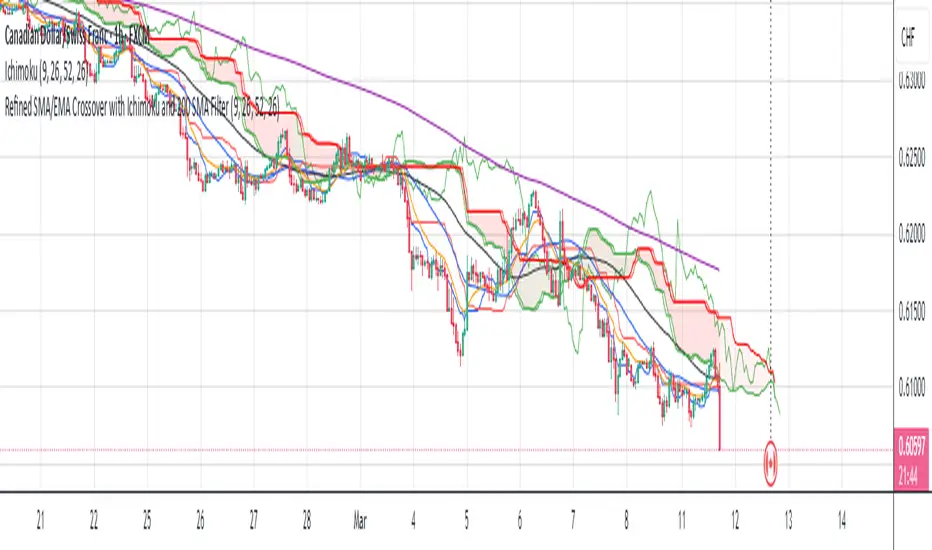
Refined SMA/EMA Crossover with Ichimoku and 200 SMA FilterYour **Refined SMA/EMA Crossover with Ichimoku and 200 SMA Filter** strategy is a multi-faceted technical trading strategy that combines several key technical indicators to refine entry and exit points for trades. Here's a breakdown of the components and how they work together:
### 1. **SMA/EMA Crossover**
- **Simple Moving Average (SMA) & Exponential Moving Average (EMA) Crossover**:
- The core idea behind the crossover strategy is to use the relationship between two moving averages to generate buy or sell signals.
- **SMA** (Simple Moving Average) gives an average of past prices over a set period.
- **EMA** (Exponential Moving Average) places more weight on recent prices, making it more responsive to price movements.
- A **bullish crossover** occurs when a shorter period moving average (such as a 50-period EMA) crosses above a longer period moving average (such as a 200-period SMA), signaling a potential buy.
- A **bearish crossover** occurs when a shorter period moving average crosses below the longer period moving average, signaling a potential sell.
### 2. **Ichimoku Cloud**
- The **Ichimoku Cloud** is a versatile indicator that provides insight into trend direction, support and resistance levels, and momentum.
- **Cloud (Kumo)**: The space between the Senkou Span A and Senkou Span B lines. It helps identify whether the market is in an uptrend, downtrend, or consolidation.
- **Tenkan-sen** (Conversion Line) and **Kijun-sen** (Base Line): These lines are used for additional confirmation of trend direction.
- **Chikou Span**: A lagging line that is used to confirm the trend.
- The general trading rules based on the Ichimoku Cloud are:
- **Bullish Signal**: When the price is above the cloud and the Tenkan-sen crosses above the Kijun-sen.
- **Bearish Signal**: When the price is below the cloud and the Tenkan-sen crosses below the Kijun-sen.
### 3. **200 SMA Filter**
- The **200 SMA Filter** serves as a long-term trend filter.
- When the price is **above the 200 SMA**, it signals a long-term bullish trend, and you only look for buying opportunities.
- When the price is **below the 200 SMA**, it signals a long-term bearish trend, and you only look for selling opportunities.
- This filter helps to avoid counter-trend trades, aligning your positions with the broader market trend.
### **How the Strategy Works Together**
- **Trade Setup (Long Position)**
1. The **200 SMA Filter** must confirm an **uptrend** by ensuring that the price is above the 200 SMA.
2. A **bullish crossover** (e.g., the 50 EMA crossing above the 200 SMA) occurs.
3. **Ichimoku Cloud** confirms a bullish trend, with the price above the cloud and the Tenkan-sen crossing above the Kijun-sen.
4. You enter a **long trade** with this confluence of signals.
- **Trade Setup (Short Position)**
1. The **200 SMA Filter** must confirm a **downtrend** by ensuring the price is below the 200 SMA.
2. A **bearish crossover** (e.g., the 50 EMA crossing below the 200 SMA) occurs.
3. **Ichimoku Cloud** confirms a bearish trend, with the price below the cloud and the Tenkan-sen crossing below the Kijun-sen.
4. You enter a **short trade** with this confluence of signals.
### **Exit Strategy**
- Exits can be determined based on any of the following:
- **SMA/EMA crossover reversal**: Exit when the shorter-term moving average crosses back below the longer-term moving average for a long position or crosses above for a short position.
- **Ichimoku Cloud reversal**: If the price breaks through the cloud or the Tenkan-sen and Kijun-sen lines cross in the opposite direction.
- **Profit target or stop loss**: Setting predefined profit targets or using a trailing stop to lock in profits as the trade moves in your favor.
Summary of the Strategy
This strategy is designed to identify strong trends and avoid false signals by combining:
SMA/EMA crossovers for immediate market direction signals.
Ichimoku Cloud for confirming the strength and trend direction.
A 200
SMA filter to ensure trades align with the long-term trend.
By using these multiple indicators together, the strategy aims to refine entry and exit points, minimize risk, and increase the likelihood of successful trades.
EMA 50 + 200 Trend Signal TableEMA 50 + 200 Trend Signal Table (ETT)
This indicator provides a multi-timeframe trend signal table based on the 50-period and 200-period Exponential Moving Averages (EMAs). It visually plots the EMA 50 and EMA 200 on the chart, along with a customizable, compact table that indicates the trend direction across multiple timeframes. This tool is useful for traders looking to quickly identify market trends and momentum on various timeframes.
How It Works
- EMA Trend Analysis: The script compares the EMA 50 and EMA 200 values to determine the trend. When EMA 50 is above EMA 200, the trend is considered Bullish; if EMA 50 is below EMA 200, the trend is Bearish. If EMA 200 data is unavailable (e.g., on very short timeframes), the trend status will display as Neutral.
- Multi-Timeframe Trend Signals: The table displays the trend signals across five user-defined timeframes, updating in real time. Each timeframe row shows either Bullish, Bearish, or Neutral, with colors customizable to your preference.
Features
- EMA 50 and EMA 200 Visualization: Plots EMA 50 and EMA 200 lines directly on the chart. Users can customize the color and line thickness for each EMA to fit their charting style.
- Trend Signal Table: A table positioned on the chart (with options for positioning in the corners) shows the trend direction for the selected timeframes.
Bullish Trend: Highlighted in green (default) with 50% opacity.
Bearish Trend: Highlighted in red (default) with 50% opacity.
Neutral Trend: Highlighted in gray (default) with 50% opacity.
- Customizable Table Appearance: Allows users to select the position of the table (top-right, top-left, bottom-right, or bottom-left) and choose between compact sizes (Extra Small, Small, Normal).
- Adjustable Colors: Users can specify custom colors for each trend status (Bullish, Bearish, Neutral) as well as for the text and table border colors.
Inputs and Customizations
- Timeframes: Choose up to five different timeframes for trend analysis.
- EMA Colors and Line Widths: Customize the color and line width of EMA 50 and EMA 200 plotted on the chart.
- Table Settings: Control the position, size, and color options of the trend signal table for improved visibility and integration with your chart layout.
Use Case This indicator is ideal for traders who employ a multi-timeframe approach to confirm trends and filter entries. By monitoring the relative positions of EMA 50 and EMA 200 across various timeframes, traders can get a quick snapshot of trend strength and direction, aiding in informed trading decisions.

LRS-Strategy: 200-EMA Buffer & Long/Short Signals LRS-Strategy: 200-EMA Buffer & Long/Short Signals
This indicator is designed to help traders implement the Leveraged Return Strategy (LRS) using the 200-day Exponential Moving Average (EMA) as a key trend-following signal. The indicator offers clear long and short signals by analyzing the price movements relative to the 200-day EMA, enhanced by customizable buffer zones for increased precision.
Key Features:
200-Day EMA: The main trend indicator. When the price is above the 200-day EMA, the market is considered in an uptrend, and when it is below, it indicates a downtrend.
Customizable Buffer Zones: Users can define a percentage buffer around the 200-day EMA (default is 3%). The upper and lower buffer zones help filter out noise and prevent premature signals.
Precise Long/Short Signals:
Long Signal: Triggered when the price moves from below the lower buffer zone, crosses the 200-day EMA, and then breaks above the upper buffer zone.
Short Signal: Triggered when the price moves from above the upper buffer zone, crosses the 200-day EMA, and then breaks below the lower buffer zone.
Alternating Signals: Ensures that a new signal (long or short) is only generated after the opposite signal has been triggered, preventing multiple signals of the same type without a reversal.
Clear Visual Aids: The indicator displays the 200-day EMA and buffer zones on the chart, along with buy (long) and sell (short) signals. This makes it easy to track trends and time entries/exits.
How to Use:
Long Entry: Look for the price to move below the lower buffer, cross the 200-day EMA from below, and then break out of the upper buffer to confirm a long signal.
Short Entry: Look for the price to move above the upper buffer, cross below the 200-day EMA, and then break below the lower buffer to confirm a short signal.
This indicator is perfect for traders who prefer a structured, trend-following approach, using clear rules to minimize noise and identify meaningful long or short opportunities.

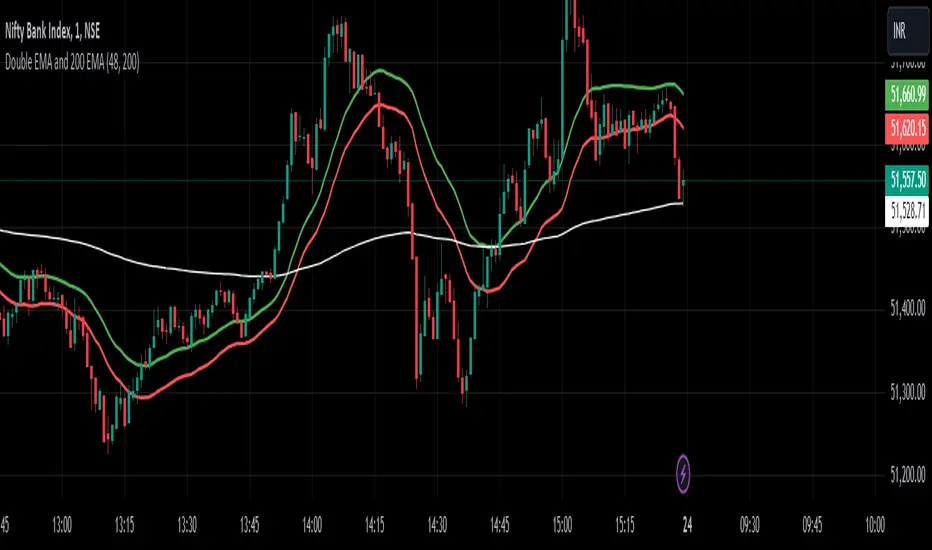
Jikdi Double EMA and 200 EMA Double EMA and 200 EMA Indicator
Overview:
The Double EMA and 200 EMA indicator combines two exponential moving averages (EMA) to provide insights into short-term and longer-term trends in a financial instrument's price movements.
Components:
Double EMA:
Calculation: The Double EMA is derived by applying the EMA formula twice to a given price series. First, an EMA is calculated based on a specified length (parameter). Then, a second EMA is computed on the first EMA result, resulting in a smoother moving average that reacts more quickly to recent price changes compared to a single EMA.
Purpose: The Double EMA helps traders identify short-term trends by smoothing out price fluctuations, making it easier to spot potential entry and exit points based on momentum shifts.
200 EMA:
Calculation: The 200 EMA is calculated by applying the EMA formula to the closing prices of the financial instrument over a longer period, typically 200 periods.
Purpose: The 200 EMA is widely used by traders and analysts to assess the long-term trend direction of an asset. It acts as a key support or resistance level and is considered significant in determining the overall market sentiment and potential reversals.
Usage:
Short-term Trading: Traders use the Double EMA to identify short-term trends and trade opportunities. When the Double EMA crosses above the price, it may signal a bullish trend, while a cross below the price could indicate a bearish trend.
Long-term Analysis: The 200 EMA serves as a reference for long-term trend analysis. Prices trading above the 200 EMA suggest a bullish bias, while trading below it indicates a bearish sentiment.
Interpretation:
Crossovers: Crosses between the Double EMA and the 200 EMA or crosses of the Double EMA with the price can be potential signals for entry or exit positions, depending on the trading strategy employed.
Trend Confirmation: Traders often look for confluence between short-term (Double EMA) and long-term (200 EMA) trends to confirm the strength of a trend or to identify potential reversals.
Conclusion:
The Double EMA and 200 EMA indicator provides a comprehensive view of both short-term momentum and longer-term trend direction. By combining these moving averages, traders can make informed decisions based on the dynamics of price movements and trend confirmations.
Color Change EMA 200 (4H)200 Color Change EMA (4H Locked)
Overview
This indicator displays a 200-period Exponential Moving Average (EMA) that is locked to the 4-hour timeframe, regardless of what chart timeframe you're currently viewing. The EMA line changes color dynamically based on price action to provide clear visual trend signals.
Key Features
• Multi-Timeframe Capability : Always shows the 4H 200 EMA on any chart timeframe
• Dynamic Color Coding :
- Green: Price is above the 200 EMA (bullish condition)
- Red: Price is below the 200 EMA (bearish condition)
• Clean Visual Design : Bold 2-pixel line width for clear visibility
• Real-time Updates : Colors change instantly as price crosses above or below the EMA
How to Use
1. Add the indicator to any timeframe chart
2. The 4H 200 EMA will appear as a smooth line
3. Watch for color changes:
- When the line turns green, it indicates price strength above the key moving average
- When the line turns red, it suggests price weakness below the moving average
4. Use for trend identification, support/resistance levels, and entry/exit timing
Best Practices
• Combine with other technical analysis tools for confirmation
• Use the color changes as alerts for potential trend shifts
• Consider the 200 EMA as a major support/resistance level
• Works well for swing trading and position sizing decisions
Settings
• Length : Default 200 periods (customizable)
• Source : Default closing price (customizable)
Perfect for traders who want to keep the important 4H 200 EMA visible across all timeframes with instant visual trend feedback.

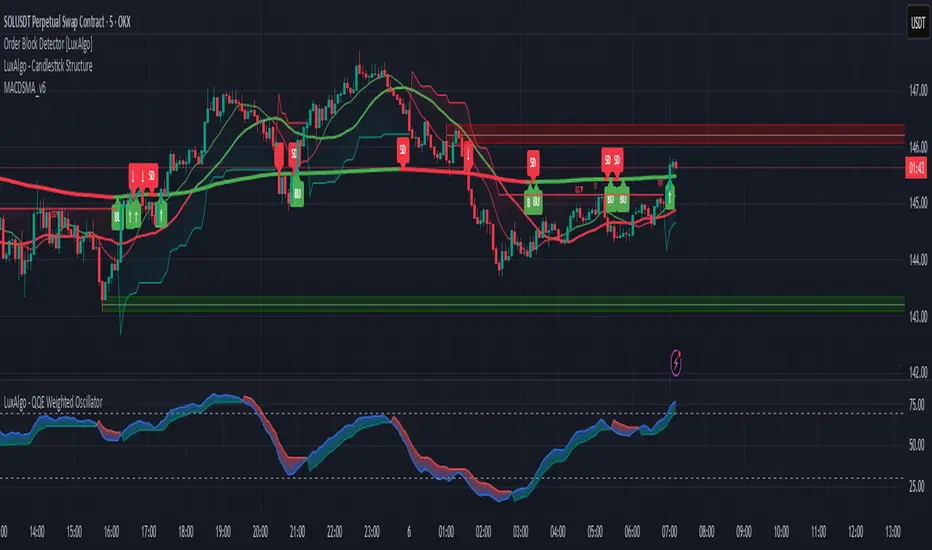
MACD + SMA 200 Indicator v6🔹 Overview
This advanced indicator combines MACD components with a 200-period SMA to identify high-probability trend directions. It provides:
✅ Multi-timeframe trend analysis (Fast, Slow, and Very Slow MAs)
✅ Visual alerts when the 200 SMA changes direction (bullish/bearish)
✅ Customizable display options (toggle MAs on/off individually)
✅ Clean, professional visuals with color-coded trend confirmation
Perfect for swing traders and investors who want to align with the dominant trend while avoiding false signals.
📊 Key Features
1. Triple Moving Average System
Fast MA (12-period) – Short-term momentum
Slow MA (26-period) – Medium-term trend
Very Slow MA (200-period) – Long-term trend filter (bullish/bearish market)
2. Smart Trend Detection
200 SMA Color Shift: Automatically changes color when trend reverses (green = bullish, red = bearish).
Visual Labels ("BU" / "SD"): Marks where the 200 SMA confirms a new trend direction.
3. Fully Customizable
Toggle each MA on/off (reduce clutter if needed).
Enable/disable colors for cleaner charts.
Adjustable lengths for all moving averages.
4. Built-in Alerts
🔔 "Very Slow MA Turned Green" – Signals potential bullish reversal.
🔔 "Very Slow MA Turned Red" – Signals potential bearish reversal.
🎯 How to Use This Indicator
📈 Bullish Confirmation (Long Setup)
✔ Price above 200 SMA (Very Slow MA turns green)
✔ Fast MA (12) > Slow MA (26) (MACD momentum supports uptrend)
✔ "BU" label appears (confirms trend shift)
📉 Bearish Confirmation (Short Setup)
✔ Price below 200 SMA (Very Slow MA turns red)
✔ Fast MA (12) < Slow MA (26) (MACD momentum supports downtrend)
✔ "SD" label appears (confirms trend shift)
⚙️ Settings & Customization
MA Visibility: Turn individual MAs on/off.
Colors: Disable if you prefer a minimal chart.
Alerts: Enable to get notifications when the 200 SMA changes trend.
📌 Why This Indicator?
Avoid false signals by combining MACD with the 200 SMA.
Clear visual cues make trend identification effortless.
Works on all timeframes (best on 1H, 4H, Daily for swing trades).
🔗 Try it now and trade with the trend! 🚀
📥 Get the Indicator
👉 Click "Add to Chart" and customize it to your trading style!
💬 Feedback? Let me know in the comments how it works for you!
Multi-Timeframe 200 SMA OverlayMulti Timeframe 200 SMAs
Indicator Displays and labels on anytime frame:
2 minute 200 SMA
5 minute 200 SMA
10 minute 200 SMA
15 minute 200 SMA
1 Hour 200 SMA
4 Hour 200 SMA
1 Day 200 SMA
IB & Hammer at SMA(20,50|200)IB & Hammer at SMA (20, 50, 200) Breakout/Breakdown Indicator
Overview:
The IB (Inside Bar) & Hammer at SMA Breakout/Breakdown Indicator is designed to identify breakout and breakdown opportunities using Inside Bars (IB) in combination with Simple Moving Averages (SMA 20, 50, 200) as key trend filters. This indicator is useful for traders looking to catch momentum moves after consolidation phases, confirming the trend direction with moving averages.
Indicator Logic:
Inside Bar (IB) Detection:
An Inside Bar is a candlestick that is completely within the range of the previous candle (i.e., lower high and higher low).
Inside Bars indicate consolidation, suggesting a potential breakout.
SMA Trend Confirmation:
The script uses three moving averages (SMA 20, 50, 200) to determine the trend direction.
Bullish trend: Price is above the 50 & 200 SMAs.
Bearish trend: Price is below the 50 & 200 SMAs.
The 20 SMA is used as a dynamic short-term momentum filter.
Breakout & Breakdown Conditions:
Breakout: When price breaks above the Inside Bar’s high, and the trend is bullish (above key SMAs).
Breakdown: When price breaks below the Inside Bar’s low, and the trend is bearish (below key SMAs).
Alerts can be set to notify traders of potential trade opportunities.
Features:
✅ Identifies Inside Bars (consolidation zones).
✅ Uses SMA (20, 50, 200) for trend confirmation.
✅ Breakout/Breakdown signals based on Inside Bar structure.
✅ Customizable Moving Averages & Alerts.
✅ Visual markers for easy trade identification.
How to Use:
Confirm Trend Direction:
If the price is above SMA 50 & 200, look for breakout trades.
If the price is below SMA 50 & 200, look for breakdown trades.
Watch for Inside Bars:
The script highlights Inside Bars with a specific color (configurable).
These bars indicate a low-volatility phase, preparing for a breakout.
Trade on Breakout/Breakdown:
Breakout: Enter long when the price breaks above the Inside Bar’s high (bullish trend).
Breakdown: Enter short when the price breaks below the Inside Bar’s low (bearish trend).

20/50 SMA Cross 200 SMAThis Pine Script code is designed to identify and visualize crossovers of two shorter-term Simple Moving Averages (SMAs), a 20-period SMA and a 50-period SMA, with a longer-term 200-period SMA on a price chart. It also includes alerts for these crossover events. Here's a breakdown:
**Purpose:**
The core idea behind this script is to detect potential trend changes. Crossovers of shorter-term moving averages over a longer-term moving average are often interpreted as bullish signals, while crossovers below are considered bearish.
**Key Components:**
1. **Moving Average Calculation:**
* `sma20 = ta.sma(close, 20)`: Calculates the 20-period SMA of the closing price.
* `sma50 = ta.sma(close, 50)`: Calculates the 50-period SMA of the closing price.
* `sma200 = ta.sma(close, 200)`: Calculates the 200-period SMA of the closing price.
2. **Crossover Detection:**
* `crossUp20 = ta.crossover(sma20, sma200)`: Returns `true` when the 20-period SMA crosses above the 200-period SMA.
* `crossDown20 = ta.crossunder(sma20, sma200)`: Returns `true` when the 20-period SMA crosses below the 200-period SMA.
* Similar logic applies for `crossUp50` and `crossDown50` with the 50-period SMA.
3. **Recent Crossover Tracking (Crucial Improvement):**
* `lookback = 7`: Defines a lookback period of 7 bars.
* `var bool hasCrossedUp20 = false`, etc.: Declares `var` (persistent) boolean variables to track if a crossover has occurred *within* the last 7 bars. This is the most important correction from previous versions.
* The logic using `ta.barssince()` is the key:
* If a crossover happens (`crossUp20` is true), the corresponding `hasCrossedUp20` is set to `true`.
* If no crossover happens on the current bar, it checks if a crossover happened within the last 7 bars using `ta.barssince(crossUp20) <= lookback`. If so, it keeps `hasCrossedUp20` as `true`. After 7 bars, it becomes `false`.
4. **Plotting Crossovers:**
* `plotshape(...)`: Plots circles on the chart to visually mark the crossovers.
* Green circles below the bars for bullish crossovers (20 and 50).
* Red circles above the bars for bearish crossovers (20 and 50).
* Different shades of green/red (green/lime, red/maroon) distinguish between 20 and 50 SMA crossovers.
5. **Plotting Moving Averages (Optional but Helpful):**
* `plot(sma20, color=color.blue, linewidth=1)`: Plots the 20-period SMA in blue.
* Similar logic for the 50-period SMA (orange) and 200-period SMA (gray).
6. **Alerts:**
* `alertcondition(...)`: Triggers alerts when crossovers occur. This is essential for real-time trading signals.
**How it Works (in Simple Terms):**
The script continuously calculates the 20, 50, and 200 SMAs. It then monitors for instances where the 20 or 50 SMA crosses the 200 SMA. When such a crossover happens, a colored circle is plotted on the chart, and an alert is triggered. The key improvement is that it remembers if a crossover occurred in the last 7 bars and continues to display the circle during that period.
**Use Case:**
Traders use this type of indicator to identify potential entry and exit points in the market. A bullish crossover (shorter SMA crossing above the longer SMA) might be a signal to buy, while a bearish crossover might be a signal to sell.
**Key Improvements over Previous Versions:**
* **Correct Lookback Implementation:** The use of `ta.barssince()` and `var` variables is the correct and efficient way to check for crossovers within a lookback period. This fixes the major flaw in earlier versions.
* **Clear Visualizations:** The use of `plotshape` with distinct colors makes it easy to distinguish between 20 and 50 SMA crossovers.
* **Alerts:** The inclusion of alerts makes the script much more practical for real-time trading.
This improved version provides a robust and useful tool for identifying and tracking SMA crossovers.
Multi-Timeframe Trend Following with 200 EMA Filter - Longs OnlyOverview
This strategy is designed to trade long positions based on multiple timeframe Exponential Moving Averages (EMAs) and a 200 EMA filter. The strategy ensures that trades are only entered in strong uptrends and aims to capitalize on sustained upward movements while minimizing risk with a defined stop-loss and take-profit mechanism.
Key Components
Initial Capital and Position Sizing
Initial Capital: $1000.
Lot Size: 1 unit per trade.
Inputs
Fast EMA Length (fast_length): The period for the fast EMA.
Slow EMA Length (slow_length): The period for the slow EMA.
200 EMA Length (filter_length_200): Set to 200 periods for the primary trend filter.
Stop Loss Percentage (stop_loss_perc): Set to 1% of the entry price.
Take Profit Percentage (take_profit_perc): Set to 3% of the entry price.
Timeframes and EMAs
EMAs are calculated for the following timeframes using the request.security function:
5-minute: Short-term trend detection.
15-minute: Intermediate-term trend detection.
30-minute: Long-term trend detection.
The strategy also calculates a 200-period EMA on the 5-minute timeframe to serve as a primary trend filter.
Trend Calculation
The strategy determines the trend for each timeframe by comparing the fast and slow EMAs:
If the fast EMA is above the slow EMA, the trend is considered positive (1).
If the fast EMA is below the slow EMA, the trend is considered negative (-1).
Combined Trend Signal
The combined trend signal is derived by summing the individual trends from the 5-minute, 15-minute, and 30-minute timeframes.
A combined trend value of 3 indicates a strong uptrend across all timeframes.
Any combined trend value less than 3 indicates a weakening or negative trend.
Entry and Exit Conditions
Entry Condition:
A long position is entered if:
The combined trend signal is 3 (indicating a strong uptrend across all timeframes).
The current close price is above the 200 EMA on the 5-minute timeframe.
Exit Condition:
The long position is exited if:
The combined trend signal is less than 3 (indicating a weakening trend).
The current close price falls below the 200 EMA on the 5-minute timeframe.
Stop Loss and Take Profit
Stop Loss: Set at 1% below the entry price.
Take Profit: Set at 3% above the entry price.
These levels are automatically set when entering a trade using the strategy.entry function with stop and limit parameters.
Plotting
The strategy plots the fast and slow EMAs for the 5-minute timeframe and the 200 EMA for visual reference on the chart:
Fast EMA (5-min): Plotted in blue.
Slow EMA (5-min): Plotted in red.
200 EMA (5-min): Plotted in green.

FUMO 200 MagnetWhat it does
FUMO Magnet measures how far price has stretched away from its long-term “magnet” — a blended EMA/SMA moving average (200 by default).
It plots a logarithmic deviation (optionally normalized) as an oscillator around zero.
Above 0** → price is above the magnet (stretched up)
Below 0** → price is below the magnet (stretched down)
Guide levels** highlight potential overbought/oversold zones
---
Why log deviation?
Log returns make extremes comparable across cycles and compress exponential trends — especially useful for BTC and other crypto assets.
Normalization modes further adjust the scale, keeping the oscillator readable on any chart.
---
Inputs
**Base**
* Source (default: Close)
* Base Length (default: 200 EMA/SMA)
* EMA vs SMA weight (%) — 0% = pure SMA, 100% = pure EMA, 50% = blended
* EMA smoothing of deviation — acts as a noise filter
**Normalization**
* None (Log Deviation) — raw log stretch in % terms
* Z-score — deviation in standard deviations (σ)
* Robust Z (MAD) — deviation vs median absolute deviation, resistant to outliers
* Tanh squash — smooth nonlinear squash of extremes for compact scale
* Normalization window (for Z / MAD)
* Tanh scale (lower = stronger squash)
* Clamp after normalization — hard cap at ±X
**Levels**
* Guide levels (Upper / Lower) — visual thresholds (default ±12)
* Zero line toggle
---
### How to read it
* **Trend bias**: sustained time above 0 = uptrend, below 0 = downtrend
* **Stretch / mean reversion**: the farther from 0, the higher the reversion risk
* **Cross-checks**: combine with structure (HH/HL, LH/LL), volume, or momentum (RSI, MACD)
---
### Recommended settings by timeframe
**Long-term (1D / 1W)**
* Normalization: None (Log Deviation)
* Base Length: 200
* EMA vs SMA weight: 50% (adjust 35–65% for faster/slower magnet)
* Deviation smoothing: 20 (10–30 range)
* Guide levels: ±12 to ±20
* Use case: cycle extremes, portfolio rebalancing, trim/add logic
**Swing (4H – 1D)**
* Normalization: Z-score
* Window: 200 (100–250)
* Smoothing: 14–20
* Guide levels: ±2σ to ±3σ
* Use case: stretched conditions across regimes; ±3σ is rare, often mean-reverts
**Intraday / Active swing (1H – 4H)**
* Normalization: Robust Z (MAD)
* Window: 200 (150 for faster response)
* Smoothing: 10–16
* Guide levels: ±3 to ±4 (robust units)
* Use case: handles spikes better than σ, fewer false overbought/oversold signals
**Scalping / Universal readability (15m – 1H)**
* Normalization: Tanh squash
* Tanh scale: 6–10 (start with 8)
* Smoothing: 8–12
* Guide levels: ±8 to ±12
* Use case: compact panel across assets and timeframes; not % or σ, but visually consistent
---
### Optional
* Clamp: enable ±20 (or ±25) for strict bounded range (useful for public charts)
---
### Quick setups
**BTC Daily (“cycle view”)**
* Normalization: None
* Blend: 50%
* Smooth: 20
* Levels: ±12–15
**BTC 4H (“swing”)**
* Normalization: Z-score
* Window: 200
* Smooth: 16
* Levels: ±2.5σ to ±3σ
**Alts 1H (“volatile”)**
* Normalization: Robust Z (MAD)
* Window: 200
* Smooth: 12
* Levels: ±3.5 to ±4.5
**Mixed assets 15m (“compact panel”)**
* Normalization: Tanh squash
* Scale: 8
* Smooth: 10
* Levels: ±8–12
* Clamp: ±20

Multi-Timeframe 200 SMAs (2m, 5m, 10m, 1H, 1D)Intraday 200 SMA Multi-Timeframe Overlay
This indicator displays the 200-period Simple Moving Averages (SMA) from the 2-minute, 5-minute, 10-minute, 1-hour, and 1-day timeframes on any chart — providing powerful multi-timeframe context for intraday trading.
Each moving average is color-coded and labeled for quick reference, helping traders identify dynamic support and resistance levels across key timeframes without needing to switch charts. Designed specifically for day traders, this tool enhances situational awareness and assists in aligning trades with broader trend direction.
Features:
2-minute 200 SMA (Yellow)
5-minute 200 SMA (Light Orange)
10-minute 200 SMA (Dark Orange)
1-hour 200 SMA (Red)
1-day 200 SMA (Purple)
Displayed on any intraday chart
Clean line styles with optional labels for timeframe reference
Perfect for scalpers and intraday swing traders who rely on higher timeframe moving averages for confluence and trade validation.
CHN BUY SELL with EMA 200Overview
This indicator combines RSI 7 momentum signals with EMA 200 trend filtering to generate high-probability BUY and SELL entry points. It uses colored candles to highlight key market conditions and displays clear trading signals with built-in cooldown periods to prevent signal spam.
Key Features
Colored Candles: Visual momentum indicators based on RSI 7 levels
Trend Filtering: EMA 200 confirms overall market direction
Signal Cooldown: Prevents over-trading with adjustable waiting periods
Clean Interface: Simple BUY/SELL labels without clutter
How It Works
Candle Coloring System
Yellow Candles: Appear when RSI 7 ≥ 70 (overbought momentum)
Purple Candles: Appear when RSI 7 ≤ 30 (oversold momentum)
Normal Candles: All other market conditions
Trading Signals
BUY Signal: Triggered when closing price > EMA 200 AND yellow candle appears
SELL Signal: Triggered when closing price < EMA 200 AND purple candle appears
Signal Cooldown
After a BUY or SELL signal appears, the same signal type is suppressed for a specified number of candles (default: 5) to prevent excessive signals in ranging markets.
Settings
RSI 7 Length: Period for RSI calculation (default: 7)
RSI 7 Overbought: Threshold for yellow candles (default: 70)
RSI 7 Oversold: Threshold for purple candles (default: 30)
EMA Length: Period for trend filter (default: 200)
Signal Cooldown: Candles to wait between same signal type (default: 5)
How to Use
Apply the indicator to your chart
Look for yellow or purple colored candles
For LONG entries: Wait for yellow candle above EMA 200, then enter BUY when signal appears
For SHORT entries: Wait for purple candle below EMA 200, then enter SELL when signal appears
Use appropriate risk management and position sizing
Best Practices
Works best on timeframes M15 and higher
Suitable for Forex, Gold, Crypto, and Stock markets
Consider market volatility when setting stop-loss and take-profit levels
Use in conjunction with proper risk management strategies
Technical Details
Overlay: True (plots directly on price chart)
Calculation: Based on RSI momentum and EMA trend analysis
Signal Logic: Combines momentum exhaustion with trend direction
Visual Feedback: Colored candles provide immediate market condition awareness

Price vs 200 EMA IndicatorPurpose :
The Price vs. 200 MA (EMA) Indicator measures the deviation of the current price from its 200-period Exponential Moving Average (EMA). Instead of merely plotting the raw difference, the indicator calculates a standardized difference (similar to a z-score), which quantifies the deviation in terms of standard deviations over time. This helps traders understand how extreme the price is relative to its long-term average and its typical volatility.
Use Cases :
Trend Analysis:
Traders can use the standardized difference to assess how extreme the current price is relative to its long-term trend (200 EMA) while normalizing for volatility.
When the z-score approaches extreme levels (e.g., above 2 or below -2), it may indicate that the asset is overextended in either direction.
Mean Reversion Strategy:
Since the indicator identifies when the price deviates far from the 200 EMA (in terms of standard deviations), traders can use it to time mean-reversion trades, buying when the price is below -2 (oversold) and selling when it’s above +2 (overbought).
Trend Continuation or Exhaustion:
If the price continues to stay above +2 for extended periods, it could indicate a strong trend, whereas a reversion toward the EMA after reaching +2 or -2 could signal trend exhaustion or reversal.
Summary :
The Price vs. 200 MA (EMA) Indicator calculates the standardized difference (z-score) between the price and its 200-period EMA, giving traders a normalized measure of how far the price is from its long-term average, relative to typical price volatility. The color-coded plot provides a clear visual representation of potential overbought/oversold conditions and highlights when the price has deviated significantly from the 200 EMA in either direction.
EMA 5/10/21 SMA 50/100/200The Script is mixture of both EMAs and SMAs. EMA 5/10/21 are powerful indicators for short term providing more weightage to the recent prices. SMA 50/100/200 provide the long term view.
5 Day EMA: This is a sign of strong momentum. It tracks the trend in the short term time frame. This is support in the strongest up trends. This line can only be used in low volatility trends with strong momentum. A break back above this line is a sign for me that an uptrend may be resuming. I primarily use it as an end of day trailing stop. It is rare that this line does not break intraday, even in the strongest trending markets.
• 10 day EMA: The 10 day EMA is a great moving average to use to keep you on the right side of the major market trend. It is usually the first line to be lost before any real trouble begins. It can be used as a standalone signal in some stocks and markets that tend to trend strongly in one direction for long periods.
• 21 day EMA: This is the intermediate term moving average. It is generally the last line of support in a volatile uptrend. To me, it is the inevitable reversion to the mean in a market when it finally pulls back after an extended trend.
• 50 day SMA: This is the line that strong leading stocks typically pull back to. This is usually the support level for strong uptrends. It is normal for uptrending markets to pull back to this line and find support. Most bull markets and uptrends will pull back to this level. It is generally a great “Buy the dip” level.
• 100 day SMA: This is the line that provides the support between the 50 day and the 200 day. If it does not hold as support, there is a high probability that the 200 day SMA is the next stop. This is the deeper pullback level in bull markets and uptrends. It usually presents a great risk/reward ratio in bull markets.
• 200 day SMA: Bulls like to buy dips when markets are trading above the 200 day moving average, while bears sell rallies short below it. Bears usually win below this line, as the 200 day becomes longer term resistance, and bulls buy pullbacks to the 200 day as long as the price stays above it. This line is one of the biggest signals in the market telling you which side to be on. Bull above, Bear below. Bad things happen to stocks and markets when this line is lost.

EMA 200 Price Deviation AlertsThis script is written in Pine Script v5 and is designed to monitor the difference between the current price and its 200-period Exponential Moving Average (EMA). Here’s a quick summary:
200 EMA Calculation: It calculates the 200-period EMA of the closing prices.
Threshold Input: Users can set a threshold (default is 65) that determines when an alert should be triggered.
Price Difference Calculation: The script computes the absolute difference between the current price and the 200 EMA.
Alert Condition: If the price deviates from the 200 EMA by more than the specified threshold, an alert condition is activated.
Visual Aids: The 200 EMA is plotted on the chart for reference, and directional arrows are drawn:
A sell arrow appears above the bar when the price is above the EMA.
A buy arrow appears below the bar when the price is below the EMA.
This setup helps traders visually and programmatically identify significant price movements relative to a key moving average.

Multi-Timeframe 200 EMAMulti-Timeframe 200 EMA Indicator
Description:
This indicator plots the 200-period Exponential Moving Average (EMA) from multiple timeframes on a single chart. It allows traders to visualize key trend levels across different timeframes, helping with confluence, trend identification, and potential trade setups.
Key Features:
Multi-Timeframe EMAs: Displays the 200 EMA from the 2m, 5m, 15m, 30m, 1hr, and 4hr timeframes, regardless of the chart's current timeframe.
Dynamic Labeling: Each EMA is labeled with its respective timeframe (e.g., "2m", "1hr", "4hr") and the labels update in real-time, staying on the current EMA value.
Auto-Updating Labels: The labels move with the EMAs as new candles form, ensuring a clean and informative display. Old labels automatically disappear to prevent clutter.
Color-Coded EMAs: Each EMA has a unique color, making it easy to differentiate between timeframes.
How to Use This Indicator in Trading:
Trend Confirmation: If price stays above the higher timeframe 200 EMA (e.g., 1hr, 4hr), it suggests an uptrend; below it suggests a downtrend.
Support & Resistance Zones: The 200 EMA from larger timeframes often acts as strong dynamic support or resistance.
Multi-Timeframe Confluence: If multiple EMAs are aligned in the same direction, it strengthens the trend bias.
Reversal or Breakout Signals: When price crosses above or below a higher timeframe EMA, it could indicate a potential trend change or breakout opportunity.
Best Used For:
🔹 Scalpers & Day Traders: Helps identify intraday trends and key levels across multiple timeframes.
🔹 Swing Traders: Useful for aligning trade setups with higher timeframe trends.
🔹 Trend Followers: Provides confirmation of long-term trends using the 200 EMA.

EMA Crossover Strategy with 50 & 200 EMAs - Faisal AnwarThis indicator uses 50 and 200-day Exponential Moving Averages (EMAs) to identify significant trend directions and potential trading opportunities through golden crossovers and death crosses. It highlights the role of EMAs as dynamic support in uptrends and downtrends, enhancing trend-following strategies.
Detailed Explanation:
EMAs Used:
The strategy utilizes two key EMAs — the 50-day EMA and the 200-day EMA. The 50-day EMA is often seen as a medium-term trend indicator, while the 200-day EMA is regarded as a benchmark for the long-term market trend.
Golden Crossover:
This occurs when the 50-day EMA crosses above the 200-day EMA, traditionally considered a bullish signal indicating potential long positions.
Death Cross:
This event is marked by the 50-day EMA crossing below the 200-day EMA, typically viewed as a bearish signal suggesting potential short positions.
Trend Support Identification:
The script also identifies when the price is above the 50-day EMA during an uptrend (indicating ongoing support) and when the price is above the 200-day EMA during a downtrend, suggesting the EMA is acting as resistance turning into support.
Visual Tools:
The indicator plots these EMAs on the chart with distinct colors for easy differentiation and uses background color changes to visually indicate when these EMAs act as support. Buy and sell signals are clearly marked with shapes and text directly on the chart for actionable insights.
Usage Tips:
Trading Decisions:
This indicator is best used in markets with clear trends, where EMAs can effectively identify shifts in momentum and serve as reliable support or resistance levels.
Complementary Tools:
Consider combining this EMA strategy with other technical analysis tools like RSI or MACD for confirmation of signals to enhance the reliability of the trading signals.
Ideal for:
Traders looking for a visual tool to assist in identifying trend directions and optimal points for entering or exiting trades based on established technical analysis principles.
Chandelier Exit Strategy with 200 EMA FilterStrategy Name and Purpose
Chandelier Exit Strategy with 200EMA Filter
This strategy uses the Chandelier Exit indicator in combination with a 200-period Exponential Moving Average (EMA) to generate trend-based trading signals. The main purpose of this strategy is to help traders identify high-probability entry points by leveraging the Chandelier Exit for stop loss levels and the EMA for trend confirmation. This strategy aims to provide clear rules for entries and exits, improving overall trading discipline and performance.
Originality and Usefulness
This script integrates two powerful indicators to create a cohesive and effective trading strategy:
Chandelier Exit : This indicator is based on the Average True Range (ATR) and identifies potential stop loss levels. The Chandelier Exit helps manage risk by setting stop loss levels at a distance from the highest high or lowest low over a specified period, multiplied by the ATR. This ensures that the stop loss adapts to market volatility.
200-period Exponential Moving Average (EMA) : The EMA acts as a trend filter. By ensuring trades are only taken in the direction of the overall trend, the strategy improves the probability of success. For long entries, the close price must be above the 200 EMA, indicating a bullish trend. For short entries, the close price must be below the 200 EMA, indicating a bearish trend.
Combining these indicators adds layers of confirmation and risk management, enhancing the strategy's effectiveness. The Chandelier Exit provides dynamic stop loss levels based on market volatility, while the EMA ensures trades align with the prevailing trend.
Entry Conditions
Long Entry
A buy signal is generated by the Chandelier Exit.
The close price is above the 200 EMA, indicating a strong bullish trend.
Short Entry
A sell signal is generated by the Chandelier Exit.
The close price is below the 200 EMA, indicating a strong bearish trend.
Exit Conditions
For long positions: The position is closed when a sell signal is generated by the Chandelier Exit.
For short positions: The position is closed when a buy signal is generated by the Chandelier Exit.
Risk Management
Account Size: 1,000,00 yen
Commission and Slippage: 17 pips commission and 1 pip slippage per trade
Risk per Trade: 10% of account equity
Stop Loss: For long trades, the stop loss is placed slightly below the candle that generated the buy signal. For short trades, the stop loss is placed slightly above the candle that generated the sell signal. The stop loss levels are dynamically adjusted based on the ATR.
Settings Options
ATR Period: Set the period for calculating the ATR to determine the Chandelier Exit levels.
ATR Multiplier: Set the multiplier for ATR to define the distance of stop loss levels from the highest high or lowest low.
Use Close Price for Extremums: Choose whether to use the close price for calculating the extremums.
EMA Period: Set the period for the EMA to adjust the trend filter sensitivity.
Show Buy/Sell Labels: Choose whether to display buy and sell labels on the chart for visual confirmation.
Highlight State: Choose whether to highlight the bullish or bearish state on the chart.
Sufficient Sample Size
The strategy has been backtested with a sufficient sample size to evaluate its performance accurately. This ensures that the strategy's results are statistically significant and reliable.
Notes
This strategy is based on historical data and does not guarantee future results.
Thoroughly backtest and validate results before using in live trading.
Market volatility and other external factors can affect performance and may not yield expected results.
Acknowledgment
This strategy uses the Chandelier Exit indicator. Special thanks to the original contributors for their work on the Chandelier Exit concept.
Clean Chart Explanation
The script is published with a clean chart to ensure that its output is readily identifiable and easy to understand. No other scripts are included on the chart, and any drawings or images used are specifically to illustrate how the script works.

DojiCandle body size RSI-SMMA filter MTF
DojiCandle body size RSI-SMMA filter MTF
Hi. I was inspired by a public script written by @ahmedirshad419, .
I thank him for his idea and hard work.
His script is the combination of RSI and Engulfing Pattern.
//------------------------------------------------------------
I decided to tweak it a bit with Open IA.
I have changed:
1) candle pattern to DojiCandle Pattern;
2) I added the ability for the user to change the size of the candlestick body;
3) Added SMMA 200;
4) Changed the colour of SMMA 200 depending on price direction;
5) Added a change in the colour of candlesticks, depending on the colour of the SMMA 200;
6) Added buy and sell signals with indicator name, ticker and close price;
7) Added ability to use indicator on multi time frame.
How it works
1. when RSI > 70 > SMMA 200 and form the bullish DojiCandle Pattern. It gives sell signal
2. when RSI < 30 < SMMA 200 and form the bearish DojiCandle Pattern. It gives buy signal
settings:
basic setting for RSI, SMMA 200 has been enabled in the script to set the levels accordingly to your trades
Enjoy

Blockchain Fundamentals: 200 Week MA Heatmap [CR]Blockchain Fundamentals: 200 Week MA Heatmap
This is released as a thank you to all my followers who pushed me over the 600 follower mark on twitter. Thanks to all you Kingz and Queenz out there who made it happen. <3
Indicator Overview
In each of its major market cycles, Bitcoin's price historically bottoms out around the 200 week moving average.
This indicator uses a color heatmap based on the % increases of that 200 week moving average. Depending on the rolling cumulative 4 week percent delta of the 200 week moving average, a color is assigned to the price chart. This method clearly highlights the market cycles of bitcoin and can be extremely helpful to use in your forecasts.
How It Can Be Used
The long term Bitcoin investor can monitor the monthly color changes. Historically, when we see orange and red dots assigned to the price chart, this has been a good time to sell Bitcoin as the market overheats. Periods where the price dots are purple and close to the 200 week MA have historically been good times to buy.
Bitcoin Price Prediction Using This Tool
If you are looking to predict the price of Bitcoin or forecast where it may go in the future, the 200WMA heatmap can be a useful tool as it shows on a historical basis whether the current price is overextending (red dots) and may need to cool down. It can also show when Bitcoin price may be good value on a historical basis. This can be when the dots on the chart are purple or blue.
Over more than ten years, $BTC has spent very little time below the 200 week moving average which is also worth noting when thinking about price predictions for Bitcoin or a Bitcoin price forecast.
Notes
1.) If you do not want to view the legend do the following: Indicator options > Style tab > Uncheck "Tables"
2.) I use my custom function to get around the limited historical data for bitcoin. You can check out the explanation of it here:
