MACD DEMA by ToffMACD DEMA by Toff
converted to version 5
Changed Histogram formatting
Changed MACD plot to indicate macd direction change
//@version=5
//by ToFFF converted to version 5, changed histogram formating changed macd plot to show macd direction changed with lighter color
indicator('MACD DEMA', timeframe = "", timeframe_gaps=true)
sma = input(12,title='DEMA Short')
lma = input(26,title='DEMA Long')
tsp = input(9,title='Signal')
lines = input(true,title="Lines")
col_grow_above = input(#26A69A, "Above Grow", group="Histogram", inline="Above")
col_fall_above = input(#B2DFDB, "Fall", group="Histogram", inline="Above")
col_grow_below = input(#FFCDD2, "Below Grow", group="Histogram", inline="Below")
col_fall_below = input(#FF5252, "Fall", group="Histogram", inline="Below")
col_macd = input(#2962FF, "MACD Line ", group="Color Settings", inline="MACD")
col_signal = input(#FF6D00, "Signal Line ", group="Color Settings", inline="Signal")
col_macd_i = #0000FF
col_macd_d = #66FFFF
slowa = ta.ema(close,lma)
slowb = ta.ema(slowa,lma)
DEMAslow = ((2 * slowa) - slowb)
fasta = ta.ema(close,sma)
fastb = ta.ema(fasta,sma)
DEMAfast = ((2 * fasta) - fastb)
MACD = (DEMAfast - DEMAslow)
signala = ta.ema(MACD, tsp)
signalb = ta.ema(signala, tsp)
signal = ((2 * signala) - signalb)
hist = (MACD - signal)
//swap1 = MACDZeroLag>0?green:red
plot(hist,style=plot.style_columns, color=(hist>=0 ? (hist < hist ? col_grow_above : col_fall_above) : (hist < hist ? col_grow_below : col_fall_below)),title='HIST')
p1 = plot(lines?MACD:na,style = plot.style_line, color=(MACD < MACD) ? col_macd_i : col_macd_d , linewidth =3,title='MACD')
p2 = plot(lines?signal:na, color=col_signal, linewidth =2,title='Signal')
hline(0)
在腳本中搜尋"手机同花顺macd指标超出框架"

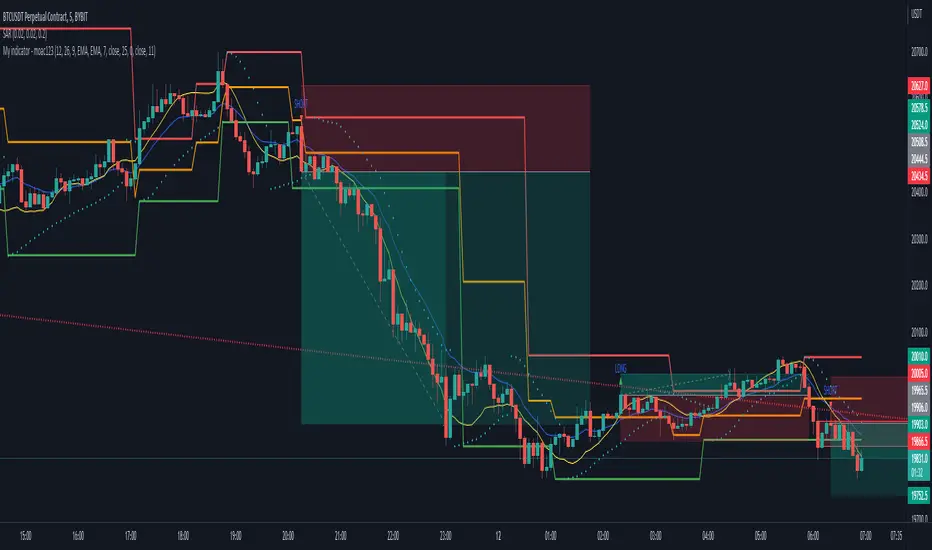
MACD S/R signal indicatorI've based the script on my MACDs/r indicator.
I think it works better on higher timeframes, this is just an experiment, please feel free to modify it.
I have been testing it with parabolic SARS to know when to exit the trades.
Exit condition: if I'm in a log position and the price is below the last bearish parabolic SARS dot I exit the trade and the opposite for shorts
DISCLAIMER: Is just an experiment and I haven't test it with real money, be careful
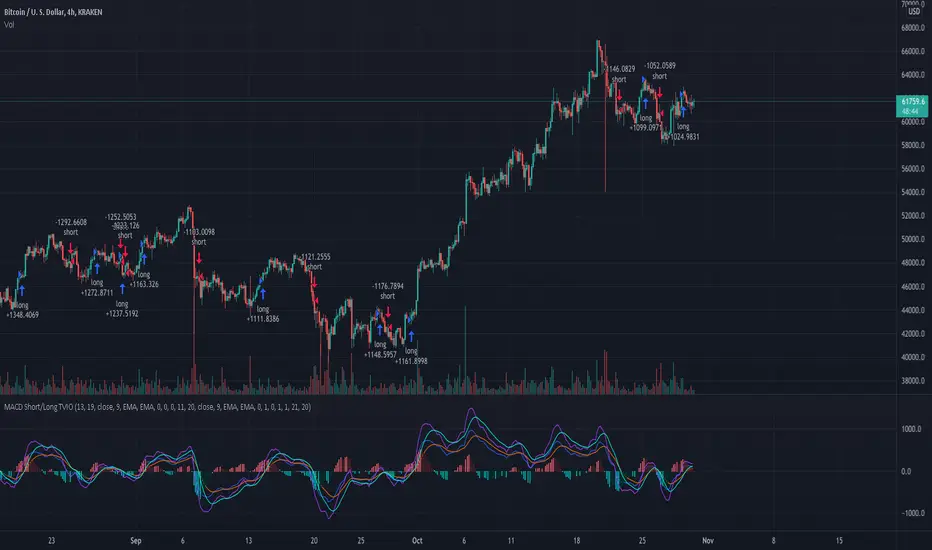
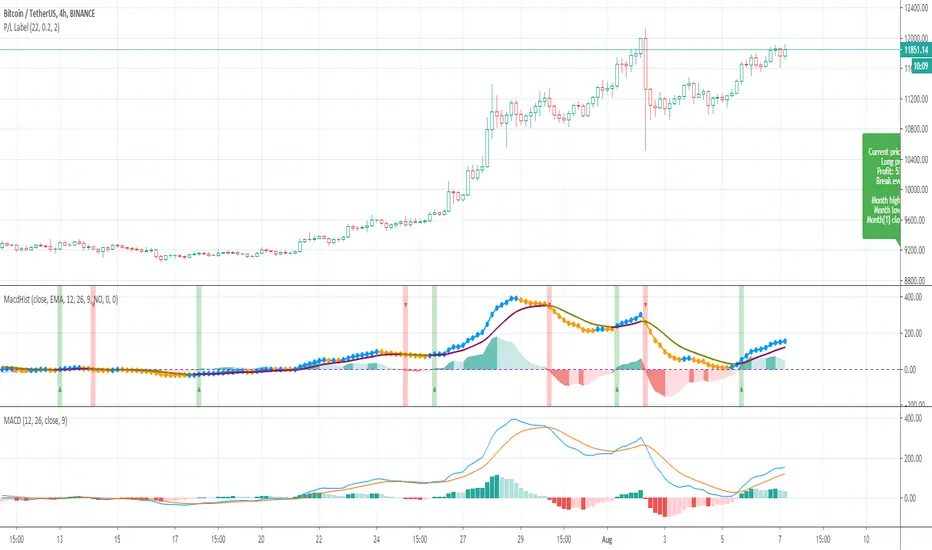
MacD Short and/or Long with Bi-Directional TP and SL This tool allows you to test any variable value for MacD and Signal for going Long or Short with each market direction having customizable values for stop loss and take profit.
For example, sometimes the MacD and Signal values are better with different lengths between Short and Long. You can use this tool to see them overlaid and determine the best settings for going one direction or the other.
This script was preset for use with XBTUSD on the 4 hour time frame. Another example with this in mind, is take profits and stop losses might not work in the Long market direction but going Short does! Without this tool that would be hard to see since typically stop loss and take profit is applied to both directions. I found with this tool that a 20% take profit seems to be a good sweet spot for going short with this strategy.
You can customize which MacD histogram you see by going to the style section and turning off the Short or Long parameters so you can see only 1 histogram at a time if you wish.
If you have any questions, please PM me.
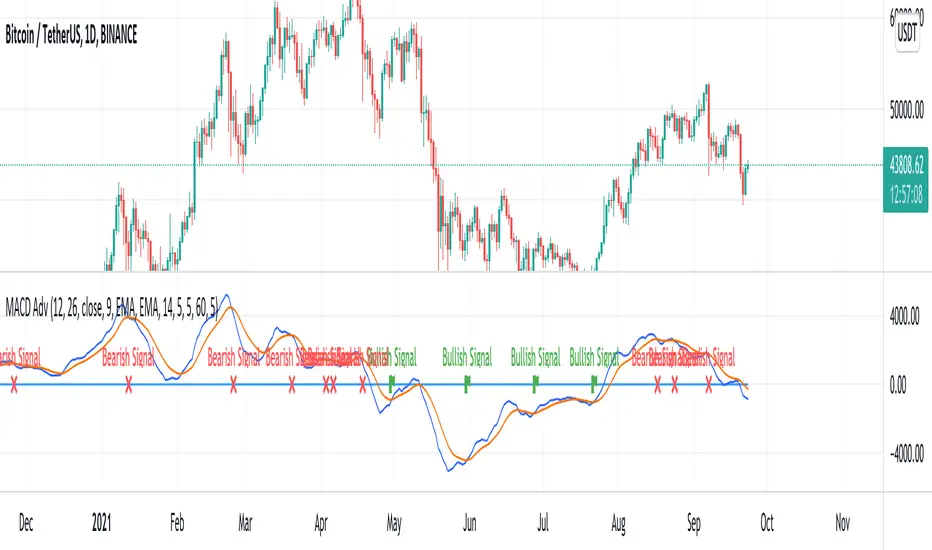
MACD AdvancedHello traders!
As you know, MACD is one of the oldest and the most popular indicators for trading. It seems to be a «Hello world indicator» of most technical analysis beginners. It’s easy to interpret and rather useful for many styles of trading. There are many arguments about its accuracy but in my opinion, this indicator can show very good results. However, you should squeeze every drop of its opportunities and we'll help you with it. We invented this script to make the lives of both professionals and freshmen easier.
Our new indicator uses all the opportunities that MACD gives. It takes into consideration divergencies, crossovers, the MACD, and signal line location. It seems to be rather difficult to take into consideration all MACD signals when you don’t use algorithmic trading, but it’ll be trivial using our script. We have integrated some innovations that’ll make traders’ staff easier. As you know, the crossover is considered to be a false signal in conjunction with hidden divergence which predicts another movement. Thus, we catch all types of divergencies and if it’s hidden of another «value» we skip it. However, if there's a crossover with bullish divergence or cross under with bearish, the signal seems to be strong and accurate. In this case, divergence is playing for us and makes the point of entrance more trustable. Our script takes into consideration this case and the innovative divergence chaser doesn’t give any mistakes. Moreover, if crossover takes place above zero line and crosses under bellow it, these signals are considered to be false too. It’s a trivial task comparing with the previous, thus it’s extremely simple for our script. We called it MACD Advanced cause it uses all the power of MACD with the power of invasive divergence chasers. The usage of it is trivial. Just add it to the chart, tune the parameters like MACD and tune the divergence chaser and get very accurate signals. We decided not to draw the bars to make signals more visible. It seems to be very nice!
I hope guys you'll enjoy it and it'll become a part of your trading staff.
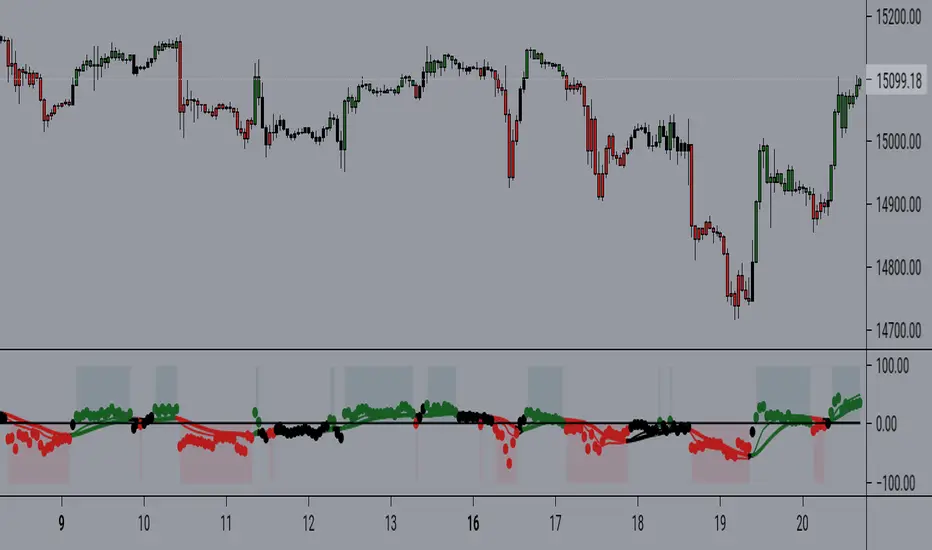
MACD-RSI With @LuckyNickVAMACD & RSi Confluence. Great for those who are looking for RSI & macd signals. Highlights volatility & structure points for entering & exiting the market. You have to understand market volatility to understand this concept. So please research more on those subjects before using. But The RSI is the relative strength index it helps you understand the increase in interest in price great for trend trading along with the momentum based indicator. Macd Developed by Gerald Appel, the Moving Average Convergence-Divergence, or MACD, is an oscillator that measures price momentum. The indicator also measures the strength, direction and duration of a trend. Forex traders can use the MACD to confirm an entry price or exit point.
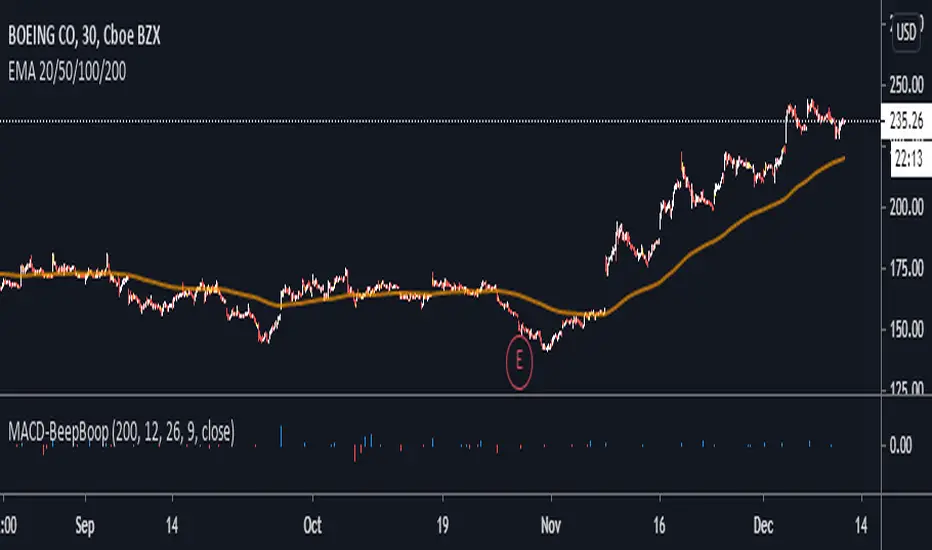
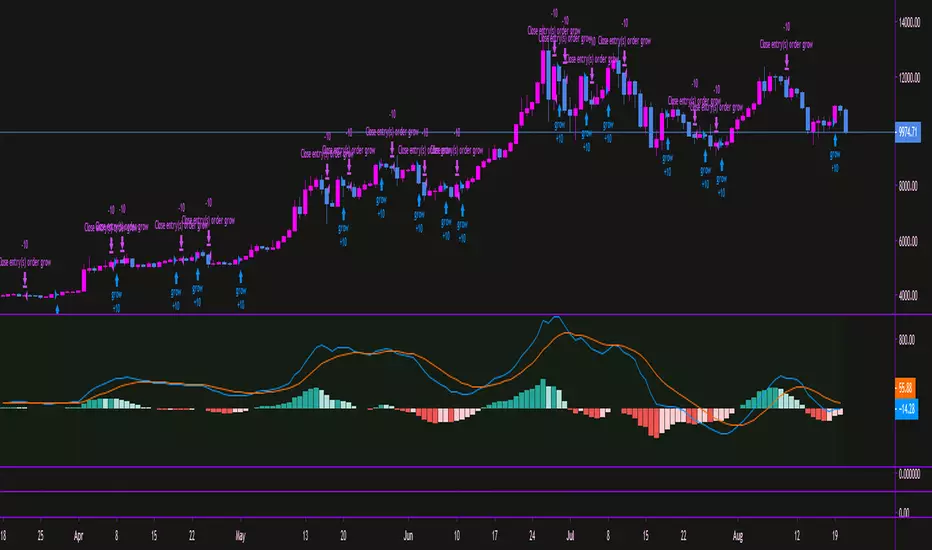
MACD BeepBoop Indicator
The indicator flags long or blue when the macd histogram value > 0 and above the ema and short or red when the macd histogram value < 0 and below the ema
I have added confirmations in the form of eliminating all bars on the histogram unless they meet the long / short entry conditions two bars in a row
You can customize the length of the ema that determines the long/short entry conditions in the settings
I have also added a yellow highlight to the bar in the chart that you would enter on. You would enter at the open of the bar following the signal bar
Stop Loss would be placed at the nearest pivot point or ATR of your choice
Note - republishing this after taking out original links
MACD Strategy with trailing ATR stopThis is a trend based strategy that uses EMA and SMA intersection for determining the direction of the trend and MACD for the entry signal. At the same time, the strategy uses ATR, which is working as a trailing stop.
The strategy entry will work when the Trend ribbon will turn green and MACD line will crossover the signal line. This strategy also takes into account the pyramiding and allows to enter the second time if the signal will repeat itself.
There are 3 exit points. The first 10% of the position will be closed when the price will increase by 1%. The second portion of 50% will be closed when the price reaches 5% Take profit target. The remaining 40 % of the position will wait for the exit signal which will occur when the price closes below the ATR line.
The strategy is using a fixed amount in dollars, each time the entry occurs the strategy will enter with 100$ in the order.
The strategy can be applied to other crypto assets. However, they will require input changes.
Best of luck with your trading.

MACD Crossover Trend IndicatorThis is a very simple " the trend is your friend " indicator - if you are consistent!
How this indicator works:
This indicator detects MACD Crossovers based on the current trend. It checks wether the current close price is above or below the 200 EMA and therefore decides whether we are in an up- or down trend.
UP-TREND: If the price is above the EMA200, the MACD is below 0 and crosses up the signal line, then this is a BUY signal!
DOWN-TREND: If the price is below the EMA200, MACD is above 0 and crosses down the signal line, then this is a SELL signal!
You can also add an alert, that keeps you informed, once one of these scenario happens for a certain pair!
With this indicator you will never enter against the trend.
Have fun! :)

MACD Remastered [CHE]MACD Remastered — Robust MACD with confirmed pivot-based divergence, optional signal bands, and ready-to-use alerts.
Summary
This indicator augments classic MACD with a robust, confirmed pivot-based divergence engine and an optional signal channel using Bollinger Bands. Divergence signals are only produced after a pivot is confirmed, which reduces noise from transient swings. A line-of-sight clearance check filters cases where the MACD histogram path contradicts the divergence, further cutting false flags. Histogram coloring clarifies momentum changes, while optional triangles project the same signals onto the main chart for quick context.
Motivation: Why this design?
Standard MACD divergence tools tend to fire early in volatile phases and flip during consolidation. The core idea here is to delay decision points until a pivot is confirmed and to validate the path between pivots. This addresses fake flips and improves signal credibility at the cost of some latency. Optional bands around the Signal line add context about compression and expansion without altering MACD’s core behavior.
What’s different vs. standard approaches?
Reference baseline: Classical MACD (fast and slow moving averages, Signal line, histogram) with simple divergence checks.
Architecture differences:
Confirmed pivot logic with left and right bars.
Line-of-sight clearance test across the histogram path between pivots.
Optional Signal-line Bollinger Bands with configurable length and width.
Composite “Any Divergence” alert plus separate regular and hidden alerts.
Optional main-chart triangles using forced overlay for at-a-glance context.
Practical effect: Fewer early or contradictory divergence signals, clearer momentum context via histogram colors and a visible Signal channel during compression and expansion.
How it works (technical)
The MACD line derives from a fast and a slow moving average on a chosen source. The Signal line smooths the MACD line using a selected moving average type and length. The histogram is the difference between MACD and Signal and is colored by direction and acceleration.
Divergence uses confirmed pivots: a pivot forms only after a set number of bars on the right side, so the event is locked in. The engine retrieves the last two relevant pivots and checks price movement versus the MACD histogram movement to classify regular or hidden divergence. A line-of-sight clearance routine traverses the histogram path between the two pivots and rejects the signal if the path invalidates the directional relationship. When enabled, Bollinger Bands are plotted around the Signal line; width scales with standard deviation. Programmatic alerts fire only on confirmed bars. No higher-timeframe requests are used.
Parameter Guide
Oscillator MA Type — Sets fast and slow MA family for MACD. Default: EMA. Tip: EMA is more responsive; SMA is steadier.
Fast Length — Fast MA period. Default: 12. Trade-off: Shorter is quicker but noisier.
Slow Length — Slow MA period. Default: 26. Trade-off: Longer reduces noise but adds lag.
Source — Price input. Default: Close. Tip: Use a stable source for consistency.
Signal MA Type — Moving average family for Signal. Default: EMA.
Signal Length — Smoothing of MACD into Signal. Default: 9. Trade-off: Longer smooths more, reacts slower.
Calculate Divergence — Enables divergence engine. Default: True.
Enable Bollinger Bands on Signal — Adds bands around Signal. Default: False.
BB Length — Sampling window for bands. Default: 20. Active: Only when bands are enabled.
BB StdDev — Band width in standard deviations. Default: 2.0. Bounds: between about zero point zero zero one and fifty.
Pivot Left / Pivot Right — Bars to the left and right that define a confirmed pivot. Default: five and five. Trade-off: Larger values mean stronger but slower pivots.
Min / Max Bars Between Pivots — Valid window between two pivots. Default: five and sixty. Tip: Increase minimum to reduce micro-divergences.
Detect Hidden — Include hidden divergence. Default: True.
Draw Lines — Draw connector lines on the MACD pane. Default: True.
Alerts: Enable / Regular / Hidden / Frequency / Prefix — Control alert emission, categories, cadence, and label. Defaults: Enabled, both categories on, once per bar close, prefix “MACD RM”.
Reading & Interpretation
Histogram: Columns above zero reflect positive momentum; below zero reflect negative momentum. Color shifts indicate momentum increasing or decreasing within each side.
MACD and Signal: Crosses and distance indicate momentum shifts and strength. When bands are enabled, touches and departures hint at compression and expansion around the Signal.
Divergence: Solid green lines and labels indicate regular bullish; solid red indicate regular bearish. Dashed teal and dashed orange denote hidden bullish and hidden bearish. Triangles on the main chart mirror these events for quicker visibility.
Practical Workflows & Combinations
Trend following: Use histogram color transitions with a structure filter such as higher highs and higher lows for long bias, or lower highs and lower lows for short bias. Divergence against the prevailing structure suggests caution or partial exits.
Exits and risk: In a long, regular bearish divergence near resistance can justify scaling out or tightening stops. Hidden divergence in the trend direction can support continuation but should not replace risk controls.
Multi-asset / Multi-timeframe: Works across liquid futures, forex, indices, and large-cap equities. Start with defaults on four-hour and daily; shorten lengths on intraday only when liquidity is strong.
Behavior, Constraints & Performance
Repaint and confirmation: Signals are anchored only after the right-side pivot bars complete; alerts trigger on confirmed bars. This intentionally adds latency to reduce noise.
No higher-timeframe requests: No `security` calls are used; repaint risk is primarily tied to live bars before confirmation.
Resources: Declared `max_bars_back` is five hundred. The divergence path check iterates between pivots, bounded by the maximum bars parameter. Line objects may accumulate; limits are set for lines and labels.
Known limits: Latency at sharp turns, potential misses during fast single-bar reversals, and sensitivity to extremely choppy sessions if minimum gap between pivots is set too low.
Sensible Defaults & Quick Tunin g
Starting point: EMA, twelve and twenty-six with Signal nine; pivots five and five; minimum five, maximum sixty; alerts on close; bands off.
Too many flips: Increase Signal length, raise pivot counts, and increase minimum bars between pivots. Consider disabling hidden divergence.
Too sluggish: Reduce pivot counts, lower Signal length, and enable bands to visualize early compression.
Cluttered chart: Keep lines off and rely on labels and main-chart triangles. Use the alert prefix to route events cleanly.
What this indicator is—and isn’t
This is a visualization and signal layer for MACD with confirmed, path-checked divergence and optional Signal bands. It is not a trading system, not predictive, and not a position management framework. Use it together with structure analysis, liquidity context, and explicit risk controls.
Disclaimer
The content provided, including all code and materials, is strictly for educational and informational purposes only. It is not intended as, and should not be interpreted as, financial advice, a recommendation to buy or sell any financial instrument, or an offer of any financial product or service. All strategies, tools, and examples discussed are provided for illustrative purposes to demonstrate coding techniques and the functionality of Pine Script within a trading context.
Any results from strategies or tools provided are hypothetical, and past performance is not indicative of future results. Trading and investing involve high risk, including the potential loss of principal, and may not be suitable for all individuals. Before making any trading decisions, please consult with a qualified financial professional to understand the risks involved.
By using this script, you acknowledge and agree that any trading decisions are made solely at your discretion and risk.
Do not use this indicator on Heikin-Ashi, Renko, Kagi, Point-and-Figure, or Range charts, as these chart types can produce unrealistic results for signal markers and alerts.
Best regards and happy trading
Chervolino

MACD Josh MACD Study — Visual Crossover Tags
Overview:
This script displays MACD signals in a clear, visual way by showing:
Histogram = EMA(Fast) − EMA(Slow)
Signal = EMA(Histogram, Signal Length)
It adds labels and arrows to help you see crossover events between the Histogram and the Signal line more easily.
⚠️ Disclaimer: This tool is for educational and research purposes only. It is not financial advice or an investment recommendation. Past performance does not guarantee future results. Users should make their own decisions and manage risk responsibly.
Features
Central Zero Line with Signal and Histogram plots
Optional labels/arrows to highlight Histogram–Signal crossovers
Alerts for crossover and crossunder events, integrated with TradingView’s alert system
Standard adjustable inputs: Fast EMA, Slow EMA, Signal EMA
How to Interpret (for study only)
When the Histogram crosses above the Signal, a visual label/arrow marks a positive MACD event
When the Histogram crosses below the Signal, a visual label/arrow marks a negative MACD event
The “BUY/SELL” labels are visual study tags only — they do not represent trade instructions or recommendations
Responsible Usage Tips
Test across multiple timeframes and different assets
Combine with higher-timeframe trend, support/resistance, or volume for confirmation
Use alerts with caution, and always test in a demo environment first
Technical Notes
The script does not use future data and does not repaint signals once bars are closed
Results depend on market conditions and may vary across assets and timeframes
License & Credits
Written in Pine Script® v5 for TradingView
The indicator name shown on chart is for labeling purposes only and carries no implication of advice or solicitation

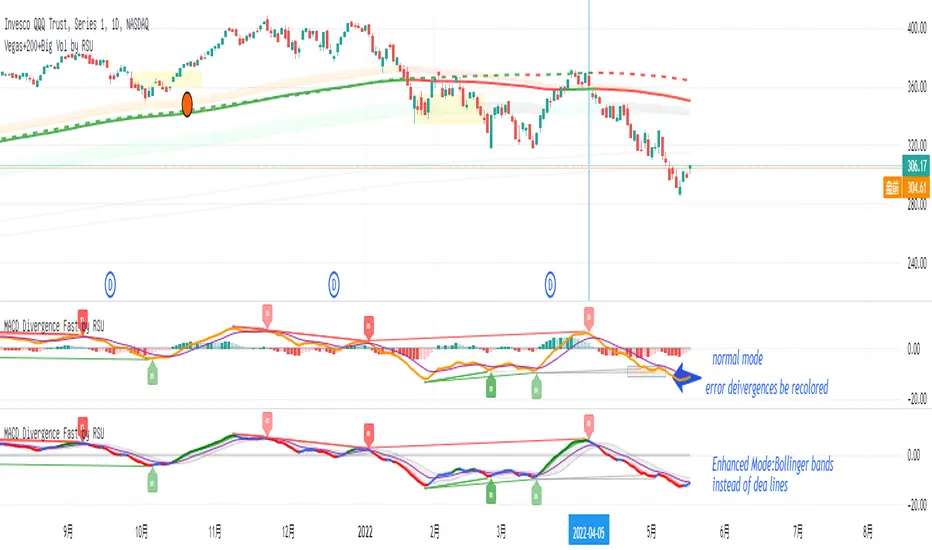
MACD Divergence Fast by RSUAdvantages:
1. When MACD-diff line(orange color) is at a high point, once it falls by 1 k line, it will detect the divergence from the previous high point. This can quickly find the divergence that has taken effect and help you quickly capture the trend before a sharp decline or rise.
2. This indicator detects the previous high and the previous low of 5, 10, 20, 40, 60 lengths at the same time, instead of only detecting a fixed length, so that more divergences can be found.
Notice:
Because it is a quick divergence detection, it is recommended to confirm that the divergence takes effect after the current k is completely closed first. I have identified this state in the indicator as "k not end".
Disadvantages and Risks:
Since it is a quick discovery, there will be error identification. Error divergences will recolor to grey.
Suggestion:
Use “RSI Divergence Fast by RSU” at the same time, because RSI divergence usually occurs before macd, if the position diverges at the same time, the probability of success will increase.
Please do not:
Don't go short in the uptrend, don't go long in the downtrend.
Top divergences that occur because of a strong uptrend are usually only temporary pullbacks. Bottom divergences in persistent declines are also temporary rallies. Do not attempt to trade such low-return trades.
It is recommended to use the divergence indicator when the stock price has made a new high and retraced, and once again made a new high, because this often leads to the end of the trend.
Divergence how to use:
1. After the previous K line was completely closed, a bottom divergence was found.
2. Open an long order at the beginning of the second bar, or as close to the bottom as possible (because the stop loss will be smaller).
3. Break the stop loss price below the previous low where the divergence occurred, which already means that the divergence is wrong.
MACD Histogram BacktestTesting the trades signaled by the daily MACD histogram to see how they would have performed, compared to regular MACD Crosses. I'm going to take the 'List of trades' and analyse it seperately as some of the profit percentages seem a little off in the tradingview calculation, though it could just be my bad math!
Hi CryptoLove :) Hope this helps your investigation RE:
www.youtube.com
MACD - EURUSD - 1min Long OnlyMACD strategy with a specified level the MACD and signal line must be under. Once the two lines cross under the specified level, a long entry is executed. When the MACD line crosses over the historian, the close entry will be executed. This strategy is designed around the high probability of a reversal in an under-bought trend.

MACD-V Volatility Normalized MomentumFull Credit to Alex Spiroglou, DipTA(ATAA), CFTe, and author of the MACD-V.
papers.ssrn.com
Alex recently received the CMT Dow Award for his work to improve on the classic MACD indicator. The MACD-V tackles some obvious challenges with the classic MACD indicator, which is normally an unbounded indicator and inconsistent between different symbols and markets.
"Our goal is to improve an existing tool (MACD), so that - by eliminating its shortcomings - we will be creating a unique type of hybrid 'boundless oscillator', that opens the doors for several pattern recognition opportunities which would not be definable using the classic MACD."
When the oversold/overbought range of 150 and -150 was determined, Alex tested where 95% of the data fell within the bands using the S&P price history as reference. Users are encouraged to find ranges relevant to the securities/instruments they are analyzing.
Enjoy!

MACD of Aggregated Buy/Sell Pressure - InFinitoModified & Updated script from MARKET VOLUME by Ricardo M Arjona @XeL_Arjona that Includes Aggregated Volume
Aggregation code originally from Crypt0rus
***The indicator can be used for any coin/symbol to aggregate volume , but it has to be set up manually***
***The indicator can be used with specific symbol data only by disabling the aggregation option, which allows for it to be used on any symbol***
- Calculated based on Aggregated Volume instead of by symbol volume . Using aggregated data makes it more accurate and allows to compare volume flow between different kinds of markets (Spot, Futures , Perpetuals, Futures+Perpetuals and All Volume ).
- As well, in order to make the data as accurate as possible, the data from each exchange aggregated is normalized to report always in terms of 1 BTC . In case this indicator is used for another symbol, the calculations can be adjusted manually to make it always report data in terms of 1 contract/coin.
Buy to Sell Convergence / Divergence by @XeL_Arjona:
"It's a simple adaptation of the popular "Price Percentage Oscillator" or MACD but taking Buying Pressure against Selling Pressure Averages, so given a Positive oscillator reading (>0) represents Bullish dominant Trend and a Negative reading (<0) a Bearish dominant Trend. Histogram is the diff between RAW Volume Pressures Convergence/Divergence minus Normalized ones (Signal) which helps as a confirmatory."
Things to look for:
- Divergences: This indicator can very useful to spot tops and bottoms through divergences

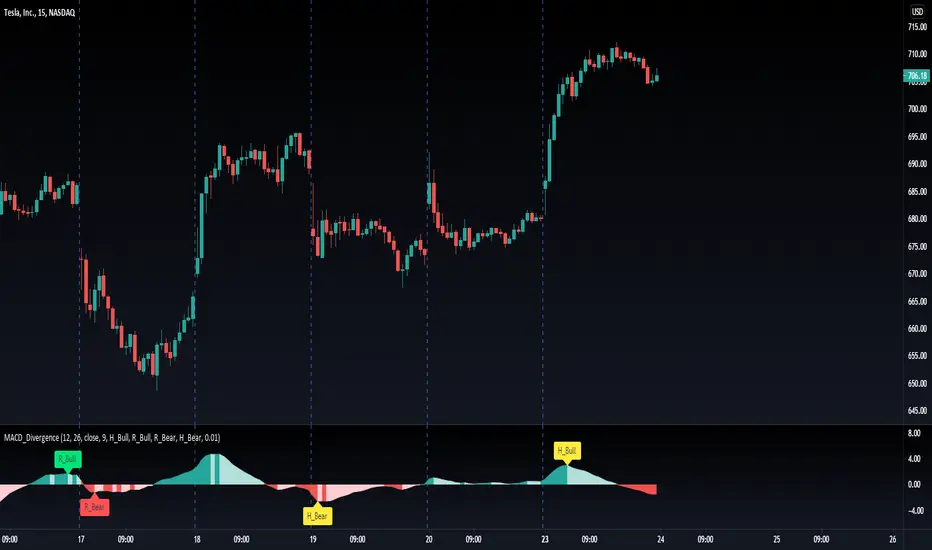
MACD Divergence H/RHere's a fun script we been working on, let us know what you add!
Short-Forms Used
histogram(hist)--> value of macd Histogram
Low-Price--------> Candle's Low Price
High-Price-------> Candle's High Price
---------------------------------------------------------------------------------------------------------------------------------------------------------------------------------
-Regular_bulls =====> Lowest(red hist) in Previous red hists is > Lowest(red hist) in Current red hists
and Lowest(Low-price) in Previous red hists is < Lowest(Low-price) in Current red hists
and Lowest(red hist) in Previous red hists is < -Histograms Minimum Value Required
and Lowest(red hist) in Current red hists is < -Histograms Minimum Value Required
---------------------------------------------------------------------------------------------------------------------------------------------------------------------------------
-Hidden_bulls =====> Lowest(red hist) in Previous red hists is < Lowest(red hist) in Current red hists
and Lowest(Low-price) in Previous red hists is > Lowest(Low-price) in Current red hists
and Lowest(red hist) in Previous red hists is < -Histograms Minimum Value Required
and Lowest(red hist) in Current red hists is < -Histograms Minimum Value Required
-------------------------------------------------------------------------------------------------------------------------------------------------------------------------------
-Regular_Bears =====> Highest(Green hist) in Previous Green hists is < Highest(Green hist) in Current Green hists
and Highest(High-price) in Previous Green hists is > Highest(High-price) in Current Green hists
and Highest(Green hist) in Previous Green hists is > Histograms Minimum Value Required
and Highest(Green hist) in Current Green hists is > Histograms Minimum Value Required
--------------------------------------------------------------------------------------------------------------------------------------------------------------------------------
-Hidden_Bears =====> Highest(Green hist) in Previous Green hists is > Highest(Green hist) in Current Green hists
and Highest(High-price) in Previous Green hists is < Highest(High-price) in Current Green hists
and Highest(Green hist) in Previous Green hists is > Histograms Minimum Value Required
and Highest(Green hist) in Current Green hists is > Histograms Minimum Value Required
Please drop a like and comment :)
-Angel Algo
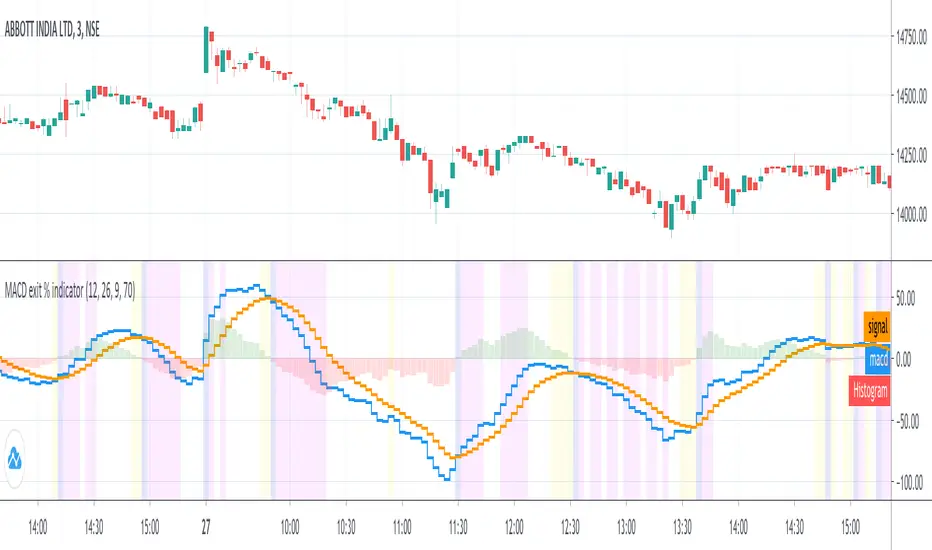
MACD exit % indicatorIntroduction
An exit indicator for MACD, good for triggering order exit via MACD.
It works by considering and the .
Then, it just exits when the % change in these values surpasses a threshold.
Indicators
blue line - MACD
orange line - Signal
green/red columns - Histogram
aqua background - Last Histogram Flip
fuchsia background - Max abs(Histogram) value after last flip
orange Background - Exit region
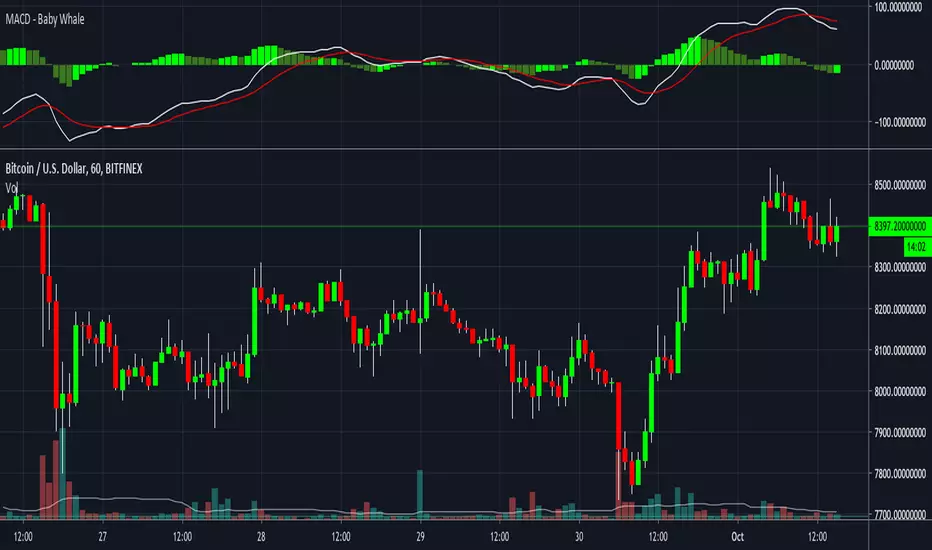
MACD - Baby WhaleI spiced the standard MACD indicator up a bit to make it more visible.
When using the MACD:
1. Never go short when the MACD lines are in the negative.
2. Never go long when the MACD lines are in the positive.
3. Always wait for an uptick / downtick on the histogram before you start your trade.
The MACD Histogram can also show you Divergence.
When the price goes up but the Histogram can't make new highs, it might be a good time to think about shorting.
If you want access, just send a message please.
Much love from Baby Whale!!
🙏❤️🐳
MACD HistogramShort MACD histogram to deal with crypto trade.
Added ability to simulate a test price too.
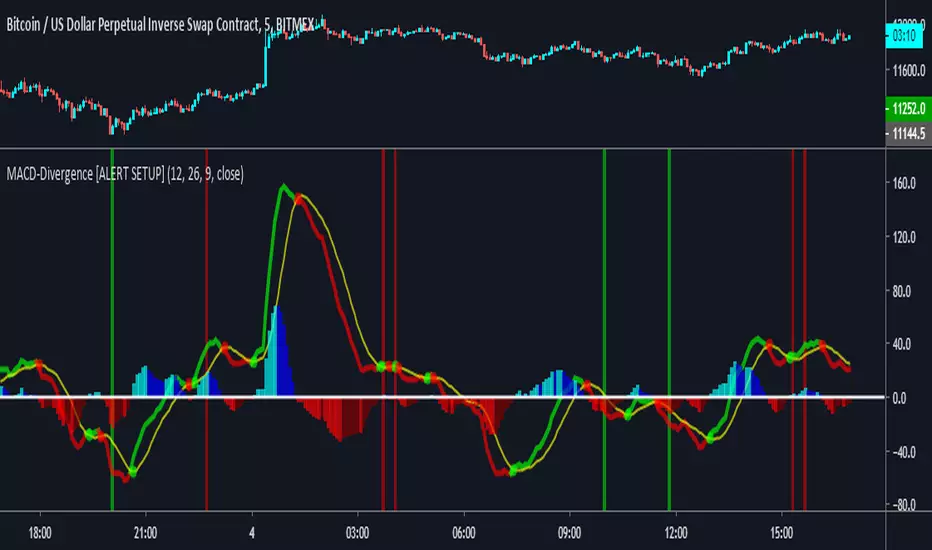
MACD Divergence [ALERTSETUP]A request I thought would be useful to code.
Very simple script that allows to create alerts on MACD divergences, based on @wanliyu script.
I also removed the security function to avoid repainting.
Red background is bearish divergence and green background is bullish divergence.
Enjoy !

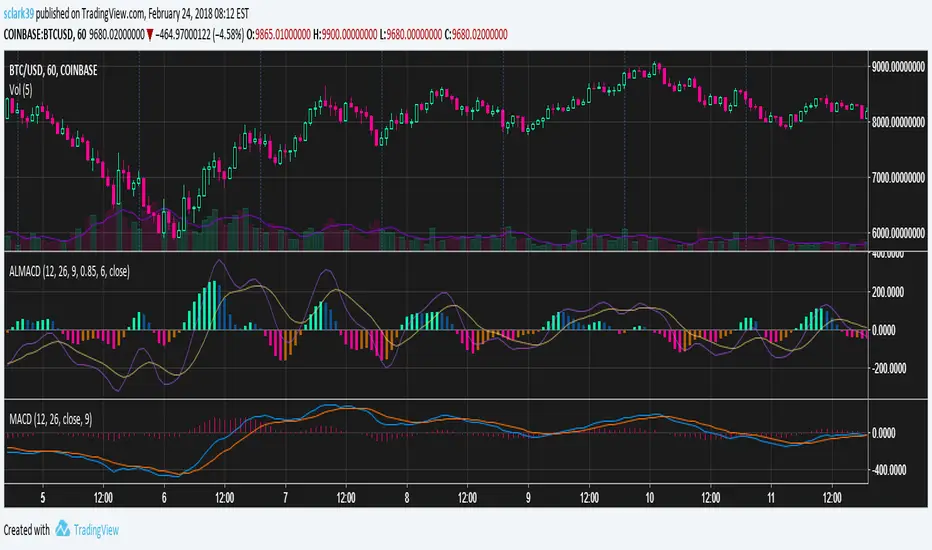
Arnaud Legoux MACD (ALMA, 4 Color, Color-blind Friendly)MACD built out of two Arnaud Legoux Moving Average lines of different periods. The signal line is still an EMA of the MACD line, just like with the normal MACD.
Colors are picked to be friendly with partial colorblindness, and can be modified in the indicator settings.
MACDAS by KIVANCfr3762 with Plots and AlertsMACDAS script by KIVANCfr3762, i added Plots and Alerts
original script
