MktCumTickThis script is a market sentiment indicator that calculates the cumulative TICK (Trade Imbalance Sentiment) for four major markets: NYSE (New York Stock Exchange), NASDAQ (National Association of Securities Dealers Automated Quotations), Dow Jones, and AMEX (American Stock Exchange).
Here's a breakdown of the script:
1. Market data requests: The script requests data for the four markets, including:
- TICK (Trade Imbalance Sentiment) data
- HLC3 (High, Low, Close) data
- ADVN (Advancing issues), DECL (Declining issues), and UNCH (Unchanged issues) data
2. Cumulative TICK calculation: The script calculates the cumulative TICK for each market by dividing the TICK data by the maximum TICK value for each market.
3. Plotting: The script plots the cumulative TICK values for each market as separate lines on the chart.
4. Background color: The script changes the background color of the chart based on the cumulative TICK values. If all four markets have decreasing cumulative TICK values, the background color turns red. If all four markets have increasing cumulative TICK values, the background color turns green.
The purpose of this indicator is to provide a visual representation of market sentiment across multiple markets. By analyzing the cumulative TICK values, traders can gain insights into market trends and make more informed trading decisions.
Some possible uses of this indicator include:
- Identifying market trends and sentiment
- Confirming trade entries and exits
- Monitoring market conditions and adjusting trading strategies accordingly
在腳本中搜尋"文华财经tick价格"

High/Low Location Frequency [LuxAlgo]The High/Low Location Frequency tool provides users with probabilities of tops and bottoms at user-defined periods, along with advanced filters that offer deep and objective market information about the likelihood of a top or bottom in the market.
🔶 USAGE
There are four different time periods that traders can select for analysis of probabilities:
HOUR OF DAY: Probability of occurrence of top and bottom prices for each hour of the day
DAY OF WEEK: Probability of occurrence of top and bottom prices for each day of the week
DAY OF MONTH: Probability of occurrence of top and bottom prices for each day of the month
MONTH OF YEAR: Probability of occurrence of top and bottom prices for each month
The data is displayed as a dashboard, which users can position according to their preferences. The dashboard includes useful information in the header, such as the number of periods and the date from which the data is gathered. Additionally, users can enable active filters to customize their view. The probabilities are displayed in one, two, or three columns, depending on the number of elements.
🔹 Advanced Filters
Advanced Filters allow traders to exclude specific data from the results. They can choose to use none or all filters simultaneously, inputting a list of numbers separated by spaces or commas. However, it is not possible to use both separators on the same filter.
The tool is equipped with five advanced filters:
HOURS OF DAY: The permitted range is from 0 to 23.
DAYS OF WEEK: The permitted range is from 1 to 7.
DAYS OF MONTH: The permitted range is from 1 to 31.
MONTHS: The permitted range is from 1 to 12.
YEARS: The permitted range is from 1000 to 2999.
It should be noted that the DAYS OF WEEK advanced filter has been designed for use with tickers that trade every day, such as those trading in the crypto market. In such cases, the numbers displayed will range from 1 (Sunday) to 7 (Saturday). Conversely, for tickers that do not trade over the weekend, the numbers will range from 1 (Monday) to 5 (Friday).
To illustrate the application of this filter, we will exclude results for Mondays and Tuesdays, the first five days of each month, January and February, and the years 2020, 2021, and 2022. Let us review the results:
DAYS OF WEEK: `2,3` or `2 3` (for crypto) or `1,2` or `1 2` (for the rest)
DAYS OF MONTH: `1,2,3,4,5` or `1 2 3 4 5`
MONTHS: `1,2` or `1 2`
YEARS: `2020,2021,2022` or `2020 2021 2022`
🔹 High Probability Lines
The tool enables traders to identify the next period with the highest probability of a top (red) and/or bottom (green) on the chart, marked with two horizontal lines indicating the location of these periods.
🔹 Top/Bottom Labels and Periods Highlight
The tool is capable of indicating on the chart the upper and lower limits of each selected period, as well as the commencement of each new period, thus providing traders with a convenient reference point.
🔶 SETTINGS
Period: Select how many bars (hours, days, or months) will be used to gather data from, max value as default.
Execution Window: Select how many bars (hours, days, or months) will be used to gather data from
🔹 Advanced Filters
Hours of day: Filter which hours of the day are excluded from the data, it accepts a list of hours from 0 to 23 separated by commas or spaces, users can not mix commas or spaces as a separator, must choose one
Days of week: Filter which days of the week are excluded from the data, it accepts a list of days from 1 to 5 for tickers not trading weekends, or from 1 to 7 for tickers trading all week, users can choose between commas or spaces as a separator, but can not mix them on the same filter.
Days of month: Filter which days of the month are excluded from the data, it accepts a list of days from 1 to 31, users can choose between commas or spaces as separator, but can not mix them on the same filter.
Months: Filter months to exclude from data. Accepts months from 1 to 12. Choose one separator: comma or space.
Years: Filter years to exclude from data. Accepts years from 1000 to 2999. Choose one separator: comma or space.
🔹 Dashboard
Dashboard Location: Select both the vertical and horizontal parameters for the desired location of the dashboard.
Dashboard Size: Select size for dashboard.
🔹 Style
High Probability Top Line: Enable/disable `High Probability Top` vertical line and choose color
High Probability Bottom Line: Enable/disable `High Probability Bottom` vertical line and choose color
Top Label: Enable/disable period top labels, choose color and size.
Bottom Label: Enable/disable period bottom labels, choose color and size.
Highlight Period Changes: Enable/disable vertical highlight at start of period

ICT Master Suite [Trading IQ]Hello Traders!
We’re excited to introduce the ICT Master Suite by TradingIQ, a new tool designed to bring together several ICT concepts and strategies in one place.
The Purpose Behind the ICT Master Suite
There are a few challenges traders often face when using ICT-related indicators:
Many available indicators focus on one or two ICT methods, which can limit traders who apply a broader range of ICT related techniques on their charts.
There aren't many indicators for ICT strategy models, and we couldn't find ICT indicators that allow for testing the strategy models and setting alerts.
Many ICT related concepts exist in the public domain as indicators, not strategies! This makes it difficult to verify that the ICT concept has some utility in the market you're trading and if it's worth trading - it's difficult to know if it's working!
Some users might not have enough chart space to apply numerous ICT related indicators, which can be restrictive for those wanting to use multiple ICT techniques simultaneously.
The ICT Master Suite is designed to offer a comprehensive option for traders who want to apply a variety of ICT methods. By combining several ICT techniques and strategy models into one indicator, it helps users maximize their chart space while accessing multiple tools in a single slot.
Additionally, the ICT Master Suite was developed as a strategy . This means users can backtest various ICT strategy models - including deep backtesting. A primary goal of this indicator is to let traders decide for themselves what markets to trade ICT concepts in and give them the capability to figure out if the strategy models are worth trading!
What Makes the ICT Master Suite Different
There are many ICT-related indicators available on TradingView, each offering valuable insights. What the ICT Master Suite aims to do is bring together a wider selection of these techniques into one tool. This includes both key ICT methods and strategy models, allowing traders to test and activate strategies all within one indicator.
Features
The ICT Master Suite offers:
Multiple ICT strategy models, including the 2022 Strategy Model and Unicorn Model, which can be built, tested, and used for live trading.
Calculation and display of key price areas like Breaker Blocks, Rejection Blocks, Order Blocks, Fair Value Gaps, Equal Levels, and more.
The ability to set alerts based on these ICT strategies and key price areas.
A comprehensive, yet practical, all-inclusive ICT indicator for traders.
Customizable Timeframe - Calculate ICT concepts on off-chart timeframes
Unicorn Strategy Model
2022 Strategy Model
Liquidity Raid Strategy Model
OTE (Optimal Trade Entry) Strategy Model
Silver Bullet Strategy Model
Order blocks
Breaker blocks
Rejection blocks
FVG
Strong highs and lows
Displacements
Liquidity sweeps
Power of 3
ICT Macros
HTF previous bar high and low
Break of Structure indications
Market Structure Shift indications
Equal highs and lows
Swings highs and swing lows
Fibonacci TPs and SLs
Swing level TPs and SLs
Previous day high and low TPs and SLs
And much more! An ongoing project!
How To Use
Many traders will already be familiar with the ICT related concepts listed above, and will find using the ICT Master Suite quite intuitive!
Despite this, let's go over the features of the tool in-depth and how to use the tool!
The image above shows the ICT Master Suite with almost all techniques activated.
ICT 2022 Strategy Model
The ICT Master suite provides the ability to test, set alerts for, and live trade the ICT 2022 Strategy Model.
The image above shows an example of a long position being entered following a complete setup for the 2022 ICT model.
A liquidity sweep occurs prior to an upside breakout. During the upside breakout the model looks for the FVG that is nearest 50% of the setup range. A limit order is placed at this FVG for entry.
The target entry percentage for the range is customizable in the settings. For instance, you can select to enter at an FVG nearest 33% of the range, 20%, 66%, etc.
The profit target for the model generally uses the highest high of the range (100%) for longs and the lowest low of the range (100%) for shorts. Stop losses are generally set at 0% of the range.
The image above shows the short model in action!
Whether you decide to follow the 2022 model diligently or not, you can still set alerts when the entry condition is met.
ICT Unicorn Model
The image above shows an example of a long position being entered following a complete setup for the ICT Unicorn model.
A lower swing low followed by a higher swing high precedes the overlap of an FVG and breaker block formed during the sequence.
During the upside breakout the model looks for an FVG and breaker block that formed during the sequence and overlap each other. A limit order is placed at the nearest overlap point to current price.
The profit target for this example trade is set at the swing high and the stop loss at the swing low. However, both the profit target and stop loss for this model are configurable in the settings.
For Longs, the selectable profit targets are:
Swing High
Fib -0.5
Fib -1
Fib -2
For Longs, the selectable stop losses are:
Swing Low
Bottom of FVG or breaker block
The image above shows the short version of the Unicorn Model in action!
For Shorts, the selectable profit targets are:
Swing Low
Fib -0.5
Fib -1
Fib -2
For Shorts, the selectable stop losses are:
Swing High
Top of FVG or breaker block
The image above shows the profit target and stop loss options in the settings for the Unicorn Model.
Optimal Trade Entry (OTE) Model
The image above shows an example of a long position being entered following a complete setup for the OTE model.
Price retraces either 0.62, 0.705, or 0.79 of an upside move and a trade is entered.
The profit target for this example trade is set at the -0.5 fib level. This is also adjustable in the settings.
For Longs, the selectable profit targets are:
Swing High
Fib -0.5
Fib -1
Fib -2
The image above shows the short version of the OTE Model in action!
For Shorts, the selectable profit targets are:
Swing Low
Fib -0.5
Fib -1
Fib -2
Liquidity Raid Model
The image above shows an example of a long position being entered following a complete setup for the Liquidity Raid Modell.
The user must define the session in the settings (for this example it is 13:30-16:00 NY time).
During the session, the indicator will calculate the session high and session low. Following a “raid” of either the session high or session low (after the session has completed) the script will look for an entry at a recently formed breaker block.
If the session high is raided the script will look for short entries at a bearish breaker block. If the session low is raided the script will look for long entries at a bullish breaker block.
For Longs, the profit target options are:
Swing high
User inputted Lib level
For Longs, the stop loss options are:
Swing low
User inputted Lib level
Breaker block bottom
The image above shows the short version of the Liquidity Raid Model in action!
For Shorts, the profit target options are:
Swing Low
User inputted Lib level
For Shorts, the stop loss options are:
Swing High
User inputted Lib level
Breaker block top
Silver Bullet Model
The image above shows an example of a long position being entered following a complete setup for the Silver Bullet Modell.
During the session, the indicator will determine the higher timeframe bias. If the higher timeframe bias is bullish the strategy will look to enter long at an FVG that forms during the session. If the higher timeframe bias is bearish the indicator will look to enter short at an FVG that forms during the session.
For Longs, the profit target options are:
Nearest Swing High Above Entry
Previous Day High
For Longs, the stop loss options are:
Nearest Swing Low
Previous Day Low
The image above shows the short version of the Silver Bullet Model in action!
For Shorts, the profit target options are:
Nearest Swing Low Below Entry
Previous Day Low
For Shorts, the stop loss options are:
Nearest Swing High
Previous Day High
Order blocks
The image above shows indicator identifying and labeling order blocks.
The color of the order blocks, and how many should be shown, are configurable in the settings!
Breaker Blocks
The image above shows indicator identifying and labeling order blocks.
The color of the breaker blocks, and how many should be shown, are configurable in the settings!
Rejection Blocks
The image above shows indicator identifying and labeling rejection blocks.
The color of the rejection blocks, and how many should be shown, are configurable in the settings!
Fair Value Gaps
The image above shows indicator identifying and labeling fair value gaps.
The color of the fair value gaps, and how many should be shown, are configurable in the settings!
Additionally, you can select to only show fair values gaps that form after a liquidity sweep. Doing so reduces "noisy" FVGs and focuses on identifying FVGs that form after a significant trading event.
The image above shows the feature enabled. A fair value gap that occurred after a liquidity sweep is shown.
Market Structure
The image above shows the ICT Master Suite calculating market structure shots and break of structures!
The color of MSS and BoS, and whether they should be displayed, are configurable in the settings.
Displacements
The images above show indicator identifying and labeling displacements.
The color of the displacements, and how many should be shown, are configurable in the settings!
Equal Price Points
The image above shows the indicator identifying and labeling equal highs and equal lows.
The color of the equal levels, and how many should be shown, are configurable in the settings!
Previous Custom TF High/Low
The image above shows the ICT Master Suite calculating the high and low price for a user-defined timeframe. In this case the previous day’s high and low are calculated.
To illustrate the customizable timeframe function, the image above shows the indicator calculating the previous 4 hour high and low.
Liquidity Sweeps
The image above shows the indicator identifying a liquidity sweep prior to an upside breakout.
The image above shows the indicator identifying a liquidity sweep prior to a downside breakout.
The color and aggressiveness of liquidity sweep identification are adjustable in the settings!
Power Of Three
The image above shows the indicator calculating Po3 for two user-defined higher timeframes!
Macros
The image above shows the ICT Master Suite identifying the ICT macros!
ICT Macros are only displayable on the 5 minute timeframe or less.
Strategy Performance Table
In addition to a full-fledged TradingView backtest for any of the ICT strategy models the indicator offers, a quick-and-easy strategy table exists for the indicator!
The image above shows the strategy performance table in action.
Keep in mind that, because the ICT Master Suite is a strategy script, you can perform fully automatic backtests, deep backtests, easily add commission and portfolio balance and look at pertinent metrics for the ICT strategies you are testing!
Lite Mode
Traders who want the cleanest chart possible can toggle on “Lite Mode”!
In Lite Mode, any neon or “glow” like effects are removed and key levels are marked as strict border boxes. You can also select to remove box borders if that’s what you prefer!
Settings Used For Backtest
For the displayed backtest, a starting balance of $1000 USD was used. A commission of 0.02%, slippage of 2 ticks, a verify price for limit orders of 2 ticks, and 5% of capital investment per order.
A commission of 0.02% was used due to the backtested asset being a perpetual future contract for a crypto currency. The highest commission (lowest-tier VIP) for maker orders on many exchanges is 0.02%. All entered positions take place as maker orders and so do profit target exits. Stop orders exist as stop-market orders.
A slippage of 2 ticks was used to simulate more realistic stop-market orders. A verify limit order settings of 2 ticks was also used. Even though BTCUSDT.P on Binance is liquid, we just want the backtest to be on the safe side. Additionally, the backtest traded 100+ trades over the period. The higher the sample size the better; however, this example test can serve as a starting point for traders interested in ICT concepts.
Community Assistance And Feedback
Given the complexity and idiosyncratic applications of ICT concepts amongst its proponents, the ICT Master Suite’s built-in strategies and level identification methods might not align with everyone's interpretation.
That said, the best we can do is precisely define ICT strategy rules and concepts to a repeatable process, test, and apply them! Whether or not an ICT strategy is trading precisely how you would trade it, seeing the model in action, taking trades, and with performance statistics is immensely helpful in assessing predictive utility.
If you think we missed something, you notice a bug, have an idea for strategy model improvement, please let us know! The ICT Master Suite is an ongoing project that will, ideally, be shaped by the community.
A big thank you to the @PineCoders for their Time Library!
Thank you!

Risk Contract Table by Soothing TradesDescription:
Risk Contract Table by Soothing Trades
This script provides an intuitive table that displays the calculated risk in dollars for various contract sizes based on the size of the last closed candle.
It is designed to help traders quickly assess their risk exposure based on the most recent price movement.
Key Features:
Automatic and Manual Tick Value Calculation: Automatically fetches the tick value for your instrument.
You can also override it with a manual input using a convenient checkbox.
Customizable Contract Sizes: Easily input your preferred contract sizes.
The script dynamically adjusts the table headers and risk calculations based on your inputs.
Real-Time Updates:
The table updates with each new candle close, ensuring that your risk calculations are always based on the latest candle size.
User-Friendly Display: The table is displayed directly on your chart with customizable colors for both text and background, making it easy to match your chart’s theme.
How to Use:
Tick Value: By default, the script uses the automatic tick value.
To manually set the tick value, check the "Use Manual Tick Value" box and enter your desired value.
Contract Sizes: You can input the number of contracts for each category (5ct, 10ct, 15ct, 17ct). The script calculates and displays the risk for each contract size based on the tick movement of the last closed candle only.
Real-Time Calculations: Risk calculations are updated only after the candle is closed, so there are no misleading values during live market activity.
Customization Options:
Manual Tick Value Override: Use a custom tick value by enabling the "Use Manual Tick Value" option.
Custom Contract Sizes: Input your desired contract sizes, and the table headers and risk calculations will update accordingly.
Color Customization: Customize the text and background colors to fit your chart’s aesthetic.
How It Works:
The script calculates the tick movement from the last closed candle and multiplies it by the specified tick value and the number of contracts.
You can choose to use the default automatic tick value or manually input your own.
A table appears on the chart showing the risk for different contract sizes based solely on the size of the last candle, providing a quick snapshot of potential exposure from the most recent price movement.
This script is ideal for traders who want to keep a quick and accurate overview of their potential risk exposure based on the size of the most recent price action.
Whether you are scalping, day trading, or holding positions overnight, this tool by Soothing Trades will help you stay informed and make better trading decisions.
Happy Trading!
- use at own risk, for education and test purpose only.
Developed by Soothing Trades

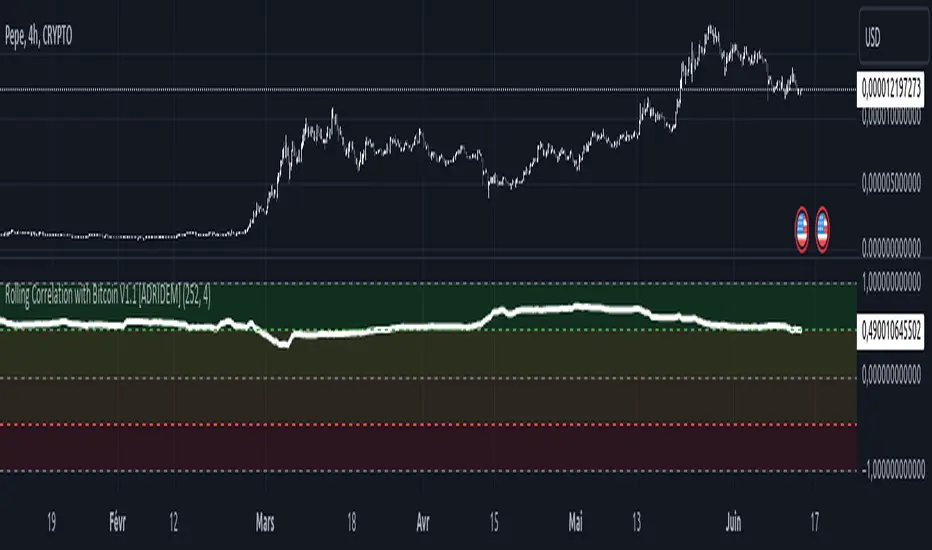
Rolling Correlation with Bitcoin V1.1 [ADRIDEM]Overview
The Rolling Correlation with Bitcoin script is designed to offer a comprehensive view of the correlation between the selected ticker and Bitcoin. This script helps investors understand the relationship between the performance of the current ticker and Bitcoin over a rolling period, providing insights into their interconnected behavior. Below is a detailed presentation of the script and its unique features.
Unique Features of the New Script
Bitcoin Comparison : Allows users to compare the correlation of the current ticker with Bitcoin, providing an analysis of their relationship.
Customizable Rolling Window : Enables users to set the length for the rolling window, adapting to different market conditions and timeframes. The default value is 252 bars, which approximates one year of trading days, but it can be adjusted as needed.
Smoothing Option : Includes an option to apply a smoothing simple moving average (SMA) to the correlation coefficient, helping to reduce noise and highlight trends. The smoothing length is customizable, with a default value of 4 bars.
Visual Indicators : Plots the smoothed correlation coefficient between the current ticker and Bitcoin, with distinct colors for easy interpretation. Additionally, horizontal lines help identify key levels of correlation.
Dynamic Background Color : Adds dynamic background colors to highlight areas of strong positive and negative correlations, enhancing visual clarity.
Originality and Usefulness
This script uniquely combines the analysis of rolling correlation for a current ticker with Bitcoin, providing a comparative view of their relationship. The inclusion of a customizable rolling window and smoothing option enhances its adaptability and usefulness in various market conditions.
Signal Description
The script includes several features that highlight potential insights into the correlation between the assets:
Rolling Correlation with Bitcoin : Plotted as a red line, this represents the smoothed rolling correlation coefficient between the current ticker and Bitcoin.
Horizontal Lines and Background Color : Lines at -0.5, 0, and 0.5 help to quickly identify regions of strong negative, weak, and strong positive correlations.
These features assist in identifying the strength and direction of the relationship between the current ticker and Bitcoin.
Detailed Description
Input Variables
Length for Rolling Window (`length`) : Defines the range for calculating the rolling correlation coefficient. Default is 252.
Smoothing Length (`smoothing_length`) : The number of periods for the smoothing SMA. Default is 4.
Bitcoin Ticker (`bitcoin_ticker`) : The ticker symbol for Bitcoin. Default is "BINANCE:BTCUSDT".
Functionality
Correlation Calculation : The script calculates the daily returns for both Bitcoin and the current ticker and computes their rolling correlation coefficient.
```pine
bitcoin_close = request.security(bitcoin_ticker, timeframe.period, close)
bitcoin_dailyReturn = ta.change(bitcoin_close) / bitcoin_close
current_dailyReturn = ta.change(close) / close
rolling_correlation = ta.correlation(current_dailyReturn, bitcoin_dailyReturn, length)
```
Smoothing : A simple moving average is applied to the rolling correlation coefficient to smooth the data.
```pine
smoothed_correlation = ta.sma(rolling_correlation, smoothing_length)
```
Plotting : The script plots the smoothed rolling correlation coefficient and includes horizontal lines for key levels.
```pine
plot(smoothed_correlation, title="Rolling Correlation with Bitcoin", color=color.rgb(255, 82, 82, 50), linewidth=2)
h_neg1 = hline(-1, "-1 Line", color=color.gray)
h_neg05 = hline(-0.5, "-0.5 Line", color=color.red)
h0 = hline(0, "Zero Line", color=color.gray)
h_pos05 = hline(0.5, "0.5 Line", color=color.green)
h1 = hline(1, "1 Line", color=color.gray)
fill(h_neg1, h_neg05, color=color.rgb(255, 0, 0, 90), title="Strong Negative Correlation Background")
fill(h_neg05, h0, color=color.rgb(255, 165, 0, 90), title="Weak Negative Correlation Background")
fill(h0, h_pos05, color=color.rgb(255, 255, 0, 90), title="Weak Positive Correlation Background")
fill(h_pos05, h1, color=color.rgb(0, 255, 0, 90), title="Strong Positive Correlation Background")
```
How to Use
Configuring Inputs : Adjust the rolling window length and smoothing length as needed. Ensure the Bitcoin ticker is set to the desired asset for comparison.
Interpreting the Indicator : Use the plotted correlation coefficient and horizontal lines to assess the strength and direction of the relationship between the current ticker and Bitcoin.
Signal Confirmation : Look for periods of strong positive or negative correlation to identify potential co-movements or divergences. The background colors help to highlight these key levels.
This script provides a detailed comparative view of the correlation between the current ticker and Bitcoin, aiding in more informed decision-making by highlighting the strength and direction of their relationship.
HT: Functions LibLibrary "Functions"
is_date_equal(date1, date2, time_zone)
Parameters:
date1 (int)
date2 (int)
time_zone (string)
is_date_equal(date1, date2_str, time_zone)
Parameters:
date1 (int)
date2_str (string)
time_zone (string)
is_date_between(date_, start_year, start_month, end_year, end_month, time_zone_)
Parameters:
date_ (int)
start_year (int)
start_month (int)
end_year (int)
end_month (int)
time_zone_ (string)
is_time_equal(time1, time2_str, time_zone)
Parameters:
time1 (int)
time2_str (string)
time_zone (string)
is_time_equal(time1, time2, time_zone)
Parameters:
time1 (int)
time2 (int)
time_zone (string)
is_time_between(time_, start_hour, start_minute, end_hour, end_minute, time_zone_)
Parameters:
time_ (int)
start_hour (int)
start_minute (int)
end_hour (int)
end_minute (int)
time_zone_ (string)
is_time_between(time_, start_time, end_time, time_zone_)
Parameters:
time_ (int)
start_time (string)
end_time (string)
time_zone_ (string)
is_close(value, level, ticks)
Parameters:
value (float)
level (float)
ticks (int)
is_inrange(value, lb, hb)
Parameters:
value (float)
lb (float)
hb (float)
is_above(value, level, ticks)
Parameters:
value (float)
level (float)
ticks (int)
is_below(value, level, ticks)
Parameters:
value (float)
level (float)
ticks (int)

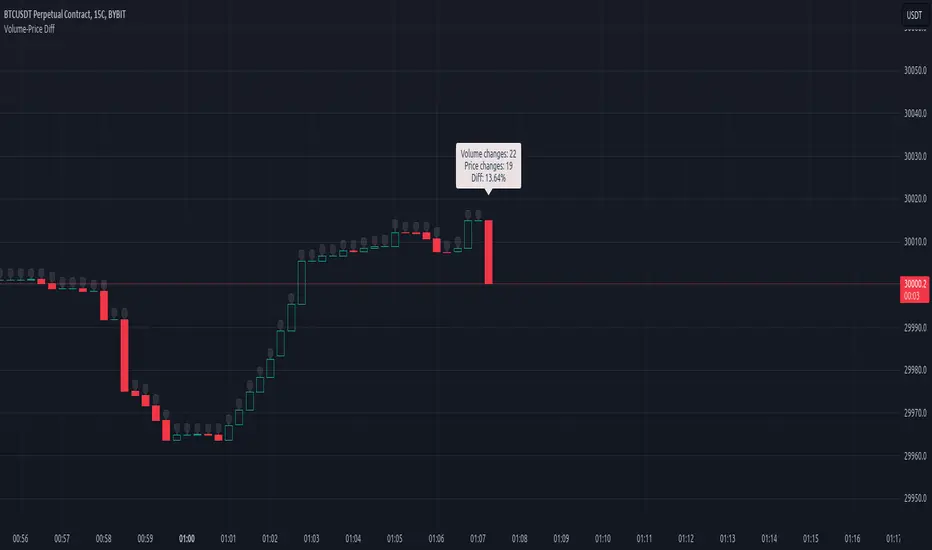
Volume-Price DiffScript is designed to analize volatility in real-time.
Once added to chart, script starting to collect 2 things:
Ticks count (tc)
Price changing ticks count (pctc)
The pctc/tc ratio may be interpret as a volatility measure.
Label above real-time bar shows:
Ticks count
Price changing ticks count
Ratio between (2) and (1) in percents
Using this indicator trader may detect volatility spikes.
More the "Diff" - less the volatility and vice versa.
[TTI] NDR 63-Day QQQ-QQEW ROC% SpreadWelcome to the NDR 63-Day QQQ-QQEW ROC% Spread script! This script is a powerful tool that calculates and visualizes the 63-day Rate of Change (ROC%) spread between the QQQ and QQEW tickers. This script is based on the research conducted by Ned Davis Research (NDR), a renowned name in the field of investment strategy.
⚙️ Key Features:
👉Rate of Change Calculation: The script calculates the 63-day Rate of Change (ROC%) for both QQQ and QQEW tickers. The ROC% is a momentum oscillator that measures the percentage price change over a given time period.
👉Spread Calculation: The script calculates the spread between the ROC% of QQQ and QQEW. This spread can be used to identify potential trading opportunities.
👉Visual Representation: The script plots the spread on the chart, providing a visual representation of the ROC% spread. This can help traders to easily identify trends and patterns.
👉Warning Lines: The script includes warning lines at +600 and -600 levels. These lines can be used as potential thresholds for trading decisions.
Usage:
To use this script, simply add it to your TradingView chart. The script will automatically calculate the ROC% for QQQ and QQEW and plot the spread on the chart. You can use this information to inform your trading decisions.
🚨 Disclaimer:
This script is provided for educational purposes only and is not intended as investment advice. Trading involves risk and is not suitable for all investors. Please consult with a financial advisor before making any investment decisions.
🎖️ Credits:
This script is based on the research conducted by Ned Davis Research (NDR). All credit for the underlying methodology and concept goes to NDR.

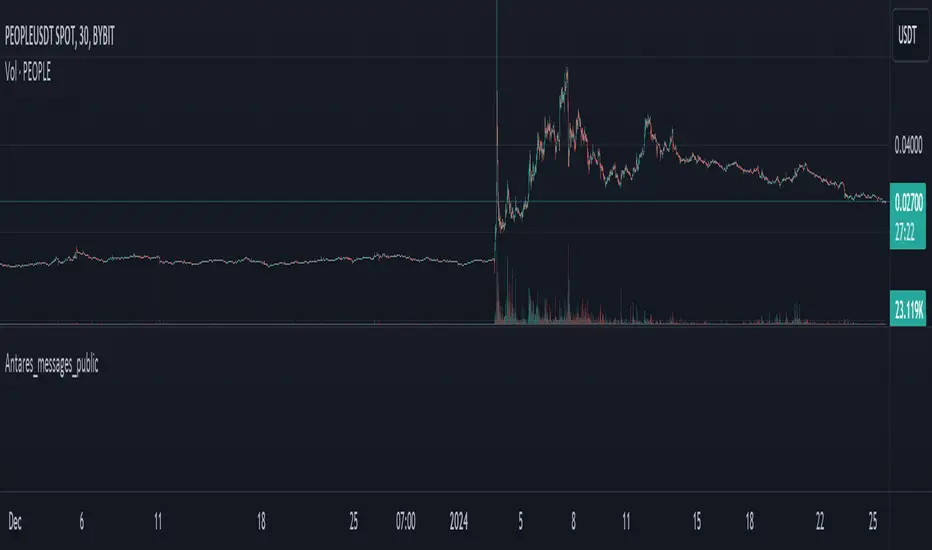
Antares_messages_publicLibrary "Antares_messages_public"
This library add messages for yours strategy for use in Antares trading system for binance and bybit exchanges.
Данная библиотека позволяет формировать сообщения в алертах стратегий для Antares в более упрощенном для пользователя режиме, включая всплывающие подсказки и т.д.
set_leverage(token, market, ticker_id, leverage)
Set leverage for ticker on specified market.
Parameters:
token (string) : (integer or 0) token for trade in system, if = 0 then token part mess is empty. Токен, При значениb = 0 не включается в формирование строки алерта.
market (string) : (string) Spot 'binance' , 'bybit' . Futures ('binancefru','binancefro','bybitfu', 'bybitfi'). Строковая переменная названия биржи.
ticker_id (string) : (string) ticker in market ('btcusdt', 'ethusdt' etc...). Строковая переменная названия тикера (пары).
leverage (float) : (float) leverage level. Устанавливаемое плечо.
Returns: 'Set leverage message'.
pause(time_pause)
Set pause in message. '::' -left and '::' -right included.
Parameters:
time_pause (int)
LongLimit(token, market, ticker_id, type_qty, quantity, price, orderId, leverageforqty)
Buy order with limit price and quantity.
Лимитный ордер на покупку(в лонг).
Parameters:
token (string) : (integer or 0) token for trade in system, if = 0 then token part mess is empty. Токен, При значениb = 0 не включается в формирование строки алерта.
market (string) : (string) Spot 'binance' , 'bybit' . Futures ('binancefru','binancefro','bybitfu', 'bybitfi'). Строковая переменная названия биржи.
ticker_id (string) : (string) ticker in market ('btcusdt', 'ethusdt' etc...). Строковая переменная названия тикера (пары).
type_qty (string) : (string) type of quantity: 1. 'qty' or '' or na - standart (in coins), 2. 'quqty'- in assets (usdt,btc,etc..), 3.open% - open position(futures) or buy (spot) in % of base 4. close% - close in % of position (futures) or sell (spot) coins in % for current quantity
quantity (float) : (float) orders size, see at 'type_qty'. Размер ордера, базы или % в соответствии с 'type_qty'
price (float) : (float) price for limit order. Цена по которой должен быть установлен лимитный ордер.
orderId (string) : (string) if use order id you may change or cancel your order after or set it ''. Используйте OrderId если хотите изменить или отменить ордер в будущем.
leverageforqty (bool) : (bool) use leverage in qty. Использовать плечо при расчете количества или нет.
Returns: 'Limit Buy order'. Лимитный ордер на покупку (лонг).
LongMarket(token, market, ticker_id, type_qty, quantity, leverageforqty)
Market Buy order with quantity.
Рыночный ордер на покупку (в лонг).
Parameters:
token (string) : (integer or 0) token for trade in system, if = 0 then token part mess is empty. Токен, При значениb = 0 не включается в формирование строки алерта.
market (string) : (string) Spot 'binance' , 'bybit' . Futures ('binancefru','binancefro','bybitfu', 'bybitfi'). Строковая переменная названия биржи.
ticker_id (string) : (string) ticker in market ('btcusdt', 'ethusdt' etc...). Строковая переменная названия тикера (пары).
type_qty (string) : (string) type of quantity: 1. 'qty' or '' or na - standart (in coins), 2. 'quqty'- in assets (usdt,btc,etc..), 3.open% - open position(futures) or buy (spot) in % of base 4. close% - close in % of position (futures) or sell (spot) coins in % for current quantity
quantity (float) : (float) orders size, see at 'type_qty'. Размер ордера, базы или % в соответствии с 'type_qty'
leverageforqty (int) : (bool) use leverage in qty. Использовать плечо при расчете количества или нет.
Returns: 'Market Buy order'. Маркетный ордер на покупку (лонг).
ShortLimit(token, market, ticker_id, type_qty, quantity, price, leverageforqty, orderId)
Sell order with limit price and quantity.
Лимитный ордер на продажу(в шорт).
Parameters:
token (string) : (integer or 0) token for trade in system, if = 0 then token part mess is empty. Токен, При значениb = 0 не включается в формирование строки алерта.
market (string) : (string) Spot 'binance' , 'bybit' . Futures ('binancefru','binancefro','bybitfu', 'bybitfi'). Строковая переменная названия биржи.
ticker_id (string) : (string) ticker in market ('btcusdt', 'ethusdt' etc...). Строковая переменная названия тикера (пары).
type_qty (string) : (string) type of quantity: 1. 'qty' or '' or na - standart (in coins), 2. 'quqty'- in assets (usdt,btc,etc..), 3.open% - open position(futures) or buy (spot) in % of base 4. close% - close in % of position (futures) or sell (spot) coins in % for current quantity
quantity (float) : (float) orders size, see at 'type_qty'. Размер ордера, базы или % в соответствии с 'type_qty'
price (float) : (float) price for limit order. Цена по которой должен быть установлен лимитный ордер.
leverageforqty (bool) : (bool) use leverage in qty. Использовать плечо при расчете количества или нет.
orderId (string) : (string) if use order id you may change or cancel your order after or set it ''. Используйте OrderId если хотите изменить или отменить ордер в будущем.
Returns: 'Limit Sell order'. Лимитный ордер на продажу (шорт).
ShortMarket(token, market, ticker_id, type_qty, quantity, leverageforqty)
Sell by market price and quantity.
Рыночный ордер на продажу(в шорт).
Parameters:
token (string) : (integer or 0) token for trade in system, if = 0 then token part mess is empty. Токен, При значениb = 0 не включается в формирование строки алерта.
market (string) : (string) Spot 'binance' , 'bybit' . Futures ('binancefru','binancefro','bybitfu', 'bybitfi'). Строковая переменная названия биржи.
ticker_id (string) : (string) ticker in market ('btcusdt', 'ethusdt' etc...). Строковая переменная названия тикера (пары).
type_qty (string) : (string) type of quantity: 1. 'qty' or '' or na - standart (in coins), 2. 'quqty'- in assets (usdt,btc,etc..), 3.open% - open position(futures) or buy (spot) in % of base 4. close% - close in % of position (futures) or sell (spot) coins in % for current quantity
quantity (float) : (float) orders size, see at 'type_qty'. Размер ордера, базы или % в соответствии с 'type_qty'
leverageforqty (int) : (bool) use leverage in qty. Использовать плечо при расчете количества или нет.
Returns: 'Market Sell order'. Маркетный ордер на продажу (шорт).
Cancel_by_ticker(token, market, ticker_id)
Cancel all orders for market and ticker in setups. Отменяет все ордера на заданной бирже и заданном токене(паре).
Parameters:
token (string)
market (string) : (string) Spot 'binance' , 'bybit' . Futures ('binancefru','binancefro','bybitfu', 'bybitfi'). Строковая переменная названия биржи.
ticker_id (string) : (string) ticker in market ('btcusdt', 'ethusdt' etc...). Строковая переменная названия тикера (пары).
Returns: 'Cancel all orders'. Отмена всех ордеров на заданной бирже и заданном токене(паре).
Cancel_by_id(token, market, ticker_id, orderId)
Cancel order by Id for market and ticker in setups. Отменяет ордер по Id на заданной бирже и заданном токене(паре).
Parameters:
token (string)
market (string) : (string) Spot 'binance' , 'bybit' . Futures ('binancefru','binancefro','bybitfu', 'bybitfi'). Строковая переменная названия биржи.
ticker_id (string) : (string) ticker in market ('btcusdt', 'ethusdt' etc...). Строковая переменная названия тикера (пары).
orderId (string)
Returns: 'Cancel order'. Отмена ордера по Id на заданной бирже и заданном токене(паре).
Close_positions(token, market, ticker_id)
Close all positions for market and ticker in setups. Закрывает все позиции на заданной бирже и заданном токене(паре).
Parameters:
token (string)
market (string) : (string) Spot 'binance' , 'bybit' . Futures ('binancefru','binancefro','bybitfu', 'bybitfi'). Строковая переменная названия биржи.
ticker_id (string) : (string) ticker in market ('btcusdt', 'ethusdt' etc...). Строковая переменная названия тикера (пары).
Returns: 'Close positions'
CloseLongLimit(token, market, ticker_id, type_qty, quantity, price, orderId, leverageforqty)
Close limit order for long position. (futures)
Лимитный ордер на продажу(в шорт) для закрытия лонговой позиции(reduceonly).
Parameters:
token (string) : (integer or 0) token for trade in system, if = 0 then token part mess is empty. Токен, При значениb = 0 не включается в формирование строки алерта.
market (string) : (string) Spot 'binance' , 'bybit' . Futures ('binancefru','binancefro','bybitfu', 'bybitfi'). Строковая переменная названия биржи.
ticker_id (string) : (string) ticker in market ('btcusdt', 'ethusdt' etc...). Строковая переменная названия тикера (пары).
type_qty (string) : (string) type of quantity: 1. 'qty' or '' or na - standart (in coins), 2. 'quqty'- in assets (usdt,btc,etc..), 3.open% - open position(futures) or buy (spot) in % of base 4. close% - close in % of position (futures) or sell (spot) coins in % for current quantity
quantity (float) : (float) orders size, see at 'type_qty'. Размер ордера, базы или % в соответствии с 'type_qty'
price (float) : (float) price for limit order. Цена по которой должен быть установлен лимитный ордер.
orderId (string) : (string) if use order id you may change or cancel your order after or set it ''. Используйте OrderId если хотите изменить или отменить ордер в будущем.
leverageforqty (bool) : (bool) use leverage in qty. Использовать плечо при расчете количества или нет.
Returns: 'Limit Sell order reduce only (close long position)'. Лимитный ордер на продажу для снижения текущего лонга(в шорт не входит).
CloseLongMarket(token, market, ticker_id, type_qty, quantity, leverageforqty)
Close market order for long position.
Рыночный ордер на продажу(в шорт) для закрытия лонговой позиции(reduceonly).
Parameters:
token (string) : (integer or 0) token for trade in system, if = 0 then token part mess is empty. Токен, При значениb = 0 не включается в формирование строки алерта.
market (string) : (string) Spot 'binance' , 'bybit' . Futures ('binancefru','binancefro','bybitfu', 'bybitfi'). Строковая переменная названия биржи.
ticker_id (string) : (string) ticker in market ('btcusdt', 'ethusdt' etc...). Строковая переменная названия тикера (пары).
type_qty (string) : (string) type of quantity: 1. 'qty' or '' or na - standart (in coins), 2. 'quqty'- in assets (usdt,btc,etc..), 3.open% - open position(futures) or buy (spot) in % of base 4. close% - close in % of position (futures) or sell (spot) coins in % for current quantity
quantity (float) : (float) orders size, see at 'type_qty'. Размер ордера, базы или % в соответствии с 'type_qty'
leverageforqty (bool) : (bool) use leverage in qty. Использовать плечо при расчете количества или нет.
Returns: 'Market Sell order reduce only (close long position)'. Ордер на снижение/закрытие текущего лонга(в шорт не входит) по рыночной цене.
CloseShortLimit(token, market, ticker_id, type_qty, quantity, price, orderId, leverageforqty)
Close limit order for short position.
Лимитный ордер на покупку(в лонг) для закрытия шортовой позиции(reduceonly).
Parameters:
token (string) : (integer or 0) token for trade in system, if = 0 then token part mess is empty. Токен, При значениb = 0 не включается в формирование строки алерта.
market (string) : (string) Spot 'binance' , 'bybit' . Futures ('binancefru','binancefro','bybitfu', 'bybitfi'). Строковая переменная названия биржи.
ticker_id (string) : (string) ticker in market ('btcusdt', 'ethusdt' etc...). Строковая переменная названия тикера (пары).
type_qty (string) : (string) type of quantity: 1. 'qty' or '' or na - standart (in coins), 2. 'quqty'- in assets (usdt,btc,etc..), 3.open% - open position(futures) or buy (spot) in % of base 4. close% - close in % of position (futures) or sell (spot) coins in % for current quantity
quantity (float) : (float) orders size, see at 'type_qty'. Размер ордера, базы или % в соответствии с 'type_qty'
price (float) : (float) price for limit order. Цена по которой должен быть установлен лимитный ордер.
orderId (string) : (string) if use order id you may change or cancel your order after or set it ''. Используйте OrderId если хотите изменить или отменить ордер в будущем.
leverageforqty (bool) : (bool) use leverage in qty. Использовать плечо при расчете количества или нет.
Returns: 'Limit Buy order reduce only (close short position)' . Лимитный ордер на покупку (лонг) для сокращения/закрытия текущего шорта.
CloseShortMarket(token, market, ticker_id, type_qty, quantity, leverageforqty)
Set Close limit order for long position.
Рыночный ордер на покупку(в лонг) для сокращения/закрытия шортовой позиции(reduceonly).
Parameters:
token (string) : (integer or 0) token for trade in system, if = 0 then token part mess is empty. Токен, При значениb = 0 не включается в формирование строки алерта.
market (string) : (string) Spot 'binance' , 'bybit' . Futures ('binancefru','binancefro','bybitfu', 'bybitfi'). Строковая переменная названия биржи.
ticker_id (string) : (string) ticker in market ('btcusdt', 'ethusdt' etc...). Строковая переменная названия тикера (пары).
type_qty (string) : (string) type of quantity: 1. 'qty' or '' or na - standart (in coins), 2. 'quqty'- in assets (usdt,btc,etc..), 3.open% - open position(futures) or buy (spot) in % of base 4. close% - close in % of position (futures) or sell (spot) coins in % for current quantity
quantity (float) : (float) orders size, see at 'type_qty'. Размер ордера, базы или % в соответствии с 'type_qty'
leverageforqty (bool) : (bool) use leverage in qty. Использовать плечо при расчете количества или нет.
Returns: 'Market Buy order reduce only (close short position)'. Маркетного ордера на покупку (лонг) для сокращения/закрытия текущего шорта.
cancel_all_close(token, market, ticker_id)
Parameters:
token (string)
market (string)
ticker_id (string)
limit_tpsl_bybitfu(token, ticker_id, order_id, side, type_qty, quantity, price, tp_price, sl_price, leverageforqty)
Set multi order for Bybit : limit + takeprofit + stoploss
Выставление тройного ордера на Bybit лимитка со стоплоссом и тейкпрофитом
Parameters:
token (string) : (integer or 0) token for trade in system, if = 0 then token part mess is empty. Токен, При значениb = 0 не включается в формирование строки алерта.
ticker_id (string) : (string) ticker in market ('btcusdt', 'ethusdt' etc...). Строковая переменная названия тикера (пары).
order_id (string)
side (bool) : (bool) "buy side" if true or "sell side" if false. true для лонга, false для шорта.
type_qty (string) : (string) type of quantity: 1. 'qty' or '' or na - standart (in coins), 2. 'quqty'- in assets (usdt,btc,etc..), 3.open% - open position(futures) or buy (spot) in % of base 4. close% - close in % of position (futures) or sell (spot) coins in % for current quantity
quantity (float) : (float) orders size, see at 'type_qty'. Размер ордера, базы или % в соответствии с 'type_qty'
price (float) : (float) price for limit order by 'side'. Цена лимитного ордера
tp_price (float) : (float) price for take profit order.
sl_price (float) : (float) price for stoploss order
leverageforqty (bool) : (bool) use leverage in qty. Использовать плечо при расчете количества или нет.
Returns: Set multi order for Bybit : limit + takeprofit + stoploss.
replace_limit_tpsl_bybitfu(token, ticker_id, order_id, side, type_qty, quantity, price, tp_price, sl_price, leverageforqty)
Change multi order for Bybit : limit + takeprofit + stoploss
Изменение тройного ордера на Bybit лимитка со стоплоссом и тейкпрофитом
Parameters:
token (string) : (integer or 0) token for trade in system, if = 0 then token part mess is empty. Токен, При значениb = 0 не включается в формирование строки алерта.
ticker_id (string) : (string) ticker in market ('btcusdt', 'ethusdt' etc...). Строковая переменная названия тикера (пары).
order_id (string)
side (bool) : (bool) "buy side" if true or "sell side" if false. true для лонга, false для шорта.
type_qty (string) : (string) type of quantity: 1. 'qty' or '' or na - standart (in coins), 2. 'quqty'- in assets (usdt,btc,etc..), 3.open% - open position(futures) or buy (spot) in % of base 4. close% - close in % of position (futures) or sell (spot) coins in % for current quantity
quantity (float) : (float) orders size, see at 'type_qty'. Размер ордера, базы или % в соответствии с 'type_qty'
price (float) : (float) price for limit order by 'side'. Цена лимитного ордера
tp_price (float) : (float) price for take profit order.
sl_price (float) : (float) price for stoploss order
leverageforqty (bool) : (bool) use leverage in qty. Использовать плечо при расчете количества или нет.
Returns: Set multi order for Bybit : limit + takeprofit + stoploss.
long_stop(token, market, ticker_id, type_qty, quantity, l_stop, leverageforqty)
Stop market order for long position
Рыночный стоп-ордер на продажу для закрытия лонговой позиции.
Parameters:
token (string)
market (string) : (string) 'binance' , 'binancefru' etc.. Строковая переменная названия биржи.
ticker_id (string) : (string) ticker in market ('btcusdt', 'ethusdt' etc...). Строковая переменная названия тикера (пары).
type_qty (string) : (string) type of quantity: 1. 'qty' or '' or na - standart (in coins), 2. 'quqty'- in assets (usdt,btc,etc..), 3.open% - open position(futures) or buy (spot) in % of base 4. close% - close in % of position (futures) or sell (spot) coins in % for current quantity
quantity (float) : (float) orders size. Размер ордера.
l_stop (float) : (float) price for activation stop order. Цена активации стоп-ордера.
leverageforqty (bool) : (bool) use leverage in qty. Использовать плечо при расчете количества или нет.
Returns: 'Stop Market Sell order (close long position)'. Маркетный стоп-ордер на снижения/закрытия текущего лонга.
short_stop(token, market, ticker_id, type_qty, quantity, s_stop, leverageforqty)
Stop market order for short position
Рыночный стоп-ордер на покупку(в лонг) для закрытия шорт позиции.
Parameters:
token (string)
market (string) : (string) 'binance' , 'binancefru' etc.. Строковая переменная названия биржи.
ticker_id (string) : (string) ticker in market ('btcusdt', 'ethusdt' etc...). Строковая переменная названия тикера (пары).
type_qty (string) : (string) type of quantity: 1. 'qty' or '' or na - standart (in coins), 2. 'quqty'- in assets (usdt,btc,etc..), 3.open% - open position(futures) or buy (spot) in % of base 4. close% - close in % of position (futures) or sell (spot) coins in % for current quantity
quantity (float) : (float) orders size. Размер ордера.
s_stop (float) : (float) price for activation stop order. Цена активации стоп-ордера.
leverageforqty (bool) : (bool) use leverage in qty. Использовать плечо при расчете количества или нет.
Returns: 'Stop Market Buy order (close short position)'. Маркетный стоп-ордер на снижения/закрытия текущего шорта.
change_stop_l(token, market, ticker_id, type_qty, quantity, l_stop, leverageforqty)
Change Stop market order for long position
Изменяем стоп-ордер на продажу(в шорт) для закрытия лонг позиции.
Parameters:
token (string)
market (string) : (string) 'binance' , 'binancefru' etc.. Строковая переменная названия биржи.
ticker_id (string) : (string) ticker in market ('btcusdt', 'ethusdt' etc...). Строковая переменная названия тикера (пары).
type_qty (string) : (string) type of quantity: 1. 'qty' or '' or na - standart (in coins), 2. 'quqty'- in assets (usdt,btc,etc..), 3.open% - open position(futures) or buy (spot) in % of base 4. close% - close in % of position (futures) or sell (spot) coins in % for current quantity
quantity (float) : (float) orders size. Размер ордера.
l_stop (float) : (float) price for activation stop order. Цена активации стоп-ордера.
leverageforqty (bool) : (bool) use leverage in qty. Использовать плечо при расчете количества или нет.
Returns: 'Change Stop Market Buy order (close long position)'. Смещает цену активации Маркетного стоп-ордер на снижения/закрытия текущего лонга.
change_stop_s(token, market, ticker_id, type_qty, quantity, s_stop, leverageforqty)
Change Stop market order for short position
Смещает цену активации Рыночного стоп-ордера на покупку(в лонг) для закрытия шорт позиции.
Parameters:
token (string)
market (string) : (string) 'binance' , 'binancefru' etc.. Строковая переменная названия биржи.
ticker_id (string) : (string) ticker in market ('btcusdt', 'ethusdt' etc...). Строковая переменная названия тикера (пары).
type_qty (string)
quantity (float) : (float) orders size. Размер ордера.
s_stop (float) : (float) price for activation stop order. Цена активации стоп-ордера.
leverageforqty (bool) : (bool) use leverage in qty. Использовать плечо при расчете количества или нет.
Returns: 'Change Stop Market Buy order (close short position)'. Смещает цену активации Маркетного стоп-ордер на снижения/закрытия текущего шорта.
open_long_position(token, market, ticker_id, type_qty, quantity, l_stop, leverageforqty)
Cancel and close all orders and positions by ticker , then open Long position by market price with stop order
Отменяет все лимитки и закрывает все позы по тикеру, затем открывает лонг по маркету с выставлением стопа (переворот позиции, при необходимости).
Parameters:
token (string)
market (string) : (string) 'binance' , 'binancefru' etc.. Строковая переменная названия биржи.
ticker_id (string) : (string) ticker in market ('btcusdt', 'ethusdt' etc...). Строковая переменная названия тикера (пары).
type_qty (string) : (string) type of quantity: 1. 'qty' or '' or na - standart (in coins), 2. 'quqty'- in assets (usdt,btc,etc..), 3.open% - open position(futures) or buy (spot) in % of base 4. close% - close in % of position (futures) or sell (spot) coins in % for current quantity
quantity (float) : (float) orders size. Размер ордера.
l_stop (float) : (float). Price for activation stop loss. Цена активации стоп-лосса.
leverageforqty (int) : (bool) use leverage in qty. Использовать плечо при расчете количества или нет.
Returns: 'command_all_close + LongMarket + long_stop.
open_short_position(token, market, ticker_id, type_qty, quantity, s_stop, leverageforqty)
Cancel and close all orders and positions , then open Short position by market price with stop order
Отменяет все лимитки и закрывает все позы по тикеру, затем открывает шорт по маркету с выставлением стопа(переворот позиции, при необходимости).
Parameters:
token (string)
market (string) : (string) 'binance' , 'binancefru' etc.. Строковая переменная названия биржи.
ticker_id (string) : (string) ticker in market ('btcusdt', 'ethusdt' etc...). Строковая переменная названия тикера (пары).
type_qty (string) : (string) type of quantity: 1. 'qty' or '' or na - standart (in coins), 2. 'quqty'- in assets (usdt,btc,etc..), 3.open% - open position(futures) or buy (spot) in % of base 4. close% - close in % of position (futures) or sell (spot) coins in % for current quantity
quantity (float) : (float) orders size. Размер ордера.
s_stop (float) : (float). Price for activation stop loss. Цена активации стоп-лосса.
leverageforqty (int) : (bool) use leverage in qty. Использовать плечо при расчете количества или нет.
Returns: 'command_all_close + ShortMarket + short_stop'.
open_long_trade(token, market, ticker_id, type_qty, quantity, l_stop, qty_ex1, price_ex1, qty_ex2, price_ex2, qty_ex3, price_ex3, leverageforqty)
Cancell and close all orders and positions , then open Long position by market price with stop order and take 1 ,take 2, take 3
Отменяет все лимитки и закрывает все позы по тикеру, затем открывает лонг по маркету с выставлением стопа и 3 тейками (переворот позиции, при необходимости).
Parameters:
token (string)
market (string) : (string) 'binance' , 'binancefru' etc.. Строковая переменная названия биржи.
ticker_id (string) : (string) ticker in market ('btcusdt', 'ethusdt' etc...). Строковая переменная названия тикера (пары).
type_qty (string) : (string) type of quantity: 1. 'qty' or '' or na - standart (in coins), 2. 'quqty'- in assets (usdt,btc,etc..), 3.open% - open position(futures) or buy (spot) in % of base 4. close% - close in % of position (futures) or sell (spot) coins in % for current quantity
quantity (float) : (float) enter order size, see at type_qty. Размер ордера входа, согласно type_qty.
l_stop (float) : (float). Price for activation stop loss. Цена активации стоп-лосса.
qty_ex1 (float) : (float). Quantity for 1th take see at type_qty, if = 0 string for order dont set. Размер лимитного ордера для 1го тейка, согласно type_qty.. Если 0, то строка для этого тейка не формируется
price_ex1 (float) : (float). Price for 1th take , if = 0 string for order dont set. Цена лимитного ордера для 1го тейка. Если 0, то строка для этого тейка не формируется
qty_ex2 (float) : (float). Quantity for 2th take see at type_qty, if = 0 string for order dont set. Размер лимитного ордера для 2го тейка, согласно type_qty..Если 0, то строка для этого тейка не формируется
price_ex2 (float) : (float). Price for 2th take, if = 0 string for order dont set. Цена лимитного ордера для 2го тейка. Если 0, то строка для этого тейка не формируется
qty_ex3 (float) : (float). Quantity for 3th take see at type_qty, if = 0 string for order dont set. Размер лимитного ордера для 2го тейка, согласно type_qty..Если 0, то строка для этого тейка не формируется
price_ex3 (float) : (float). Price for 3th take, if = 0 string for order dont set. Цена лимитного ордера для 3го тейка. Если 0, то строка для этого тейка не формируется
leverageforqty (int)
Returns: 'cancel_all_close + LongMarket + long_stop + CloseLongLimit1 + CloseLongLimit2+CloseLongLimit3'.
open_short_trade(token, market, ticker_id, type_qty, quantity, s_stop, qty_ex1, price_ex1, qty_ex2, price_ex2, qty_ex3, price_ex3, leverageforqty)
Cancell and close all orders and positions , then open Short position by market price with stop order and take 1 and take 2
Отменяет все лимитки и закрывает все позы по тикеру, затем открывает шорт по маркету с выставлением стопа и 3 тейками (переворот позиции, при необходимости).
Parameters:
token (string)
market (string) : (string) 'binance' , 'binancefru' etc.. Строковая переменная названия биржи.
ticker_id (string) : (string) ticker in market ('btcusdt', 'ethusdt' etc...). Строковая переменная названия тикера (пары).
type_qty (string)
quantity (float)
s_stop (float) : (float). Price for activation stop loss. Цена активации стоп-лосса.
qty_ex1 (float) : (float). Quantity for 1th take see at type_qty, if = 0 string for order dont set. Размер лимитного ордера для 1го тейка, согласно type_qty.. Если 0, то строка для этого тейка не формируется
price_ex1 (float) : (float). Price for 1th take , if = 0 string for order dont set. Цена лимитного ордера для 1го тейка. Если 0, то строка для этого тейка не формируется
qty_ex2 (float) : (float). Quantity for 2th take see at type_qty, if = 0 string for order dont set. Размер лимитного ордера для 2го тейка, согласно type_qty..Если 0, то строка для этого тейка не формируется
price_ex2 (float) : (float). Price for 2th take, if = 0 string for order dont set. Цена лимитного ордера для 2го тейка. Если 0, то строка для этого тейка не формируется
qty_ex3 (float) : (float). Quantity for 3th take see at type_qty, if = 0 string for order dont set. Размер лимитного ордера для 2го тейка, согласно type_qty..Если 0, то строка для этого тейка не формируется
price_ex3 (float) : (float). Price for 3th take, if = 0 string for order dont set. Цена лимитного ордера для 3го тейка. Если 0, то строка для этого тейка не формируется
leverageforqty (int)
Returns: 'command_all_close + ShortMarket + short_stop + CloseShortLimit + CloseShortLimit(2)'.
Multi_LongLimit(token, market, ticker_id, type_qty, qty1, price1, qty2, price2, qty3, price3, qty4, price4, qty5, price5, qty6, price6, qty7, price7, qty8, price8, leverageforqty)
8 or less Buy orders with limit price and quantity.
До 8 Лимитных ордеров на покупку(в лонг).
Parameters:
token (string) : (integer or 0) token for trade in system, if = 0 then token part mess is empty. Токен, При значениb = 0 не включается в формирование строки алерта.
market (string) : (string) Spot 'binance' , 'bybit' . Futures ('binancefru','binancefro','bybitfu', 'bybitfi'). Строковая переменная названия биржи.
ticker_id (string) : (string) ticker in market ('btcusdt', 'ethusdt' etc...). Строковая переменная названия тикера (пары).
type_qty (string) : (string) type of quantity: 1. 'qty' or '' or na - standart (in coins), 2. 'quqty'- in assets (usdt,btc,etc..), 3.open% - open position(futures) or buy (spot) in % of base 4. close% - close in % of position (futures) or sell (spot) coins in % for current quantity
qty1 (float)
price1 (float)
qty2 (float)
price2 (float)
qty3 (float)
price3 (float)
qty4 (float)
price4 (float)
qty5 (float)
price5 (float)
qty6 (float)
price6 (float)
qty7 (float)
price7 (float)
qty8 (float)
price8 (float)
leverageforqty (bool) : (bool) use leverage in qty. Использовать плечо при расчете количества или нет.
Returns: 'Limit Buy order'. Лимитный ордер на покупку (лонг).
Aggregated VWAP by AncheAbout this indicator
Aggregated VWAP shows you a combined VWAP of different assets which you can choose inside the options panel.
This allows you to select the same asset from multiple exchanges and the indicator plots a VWAP based on all the prices of the selected tickers.
The above image shows you the VWAP of the current asset (red, thick line) and an Aggregated VWAP of BTCUSD from this exchange + 5 others (black line). This clearly shows a discrepancy between both values.
How to use
Open the options of the indicator, at the bottom you will find 5 input fields to select 5 tickers. This allows you to select your asset from different exchanges so that their value gets computed inside the value for the Aggregated VWAP.
Inside the "style" settings you can change colors, lines, etc.

Volume Profile Volume Delta OI Delta [Kioseff Trading]Hello!
This script serves to distinguish volume delta for any asset and open interest delta for Binance perpetual futures.
The image above provides further explanation of functionality and color correspondence.
The image above shows the indicator calculating volume at each tick level and displaying the metric.
The label color outline (neon effect) is configurable; the image above is absent the feature.
The image above shows Open Interest (OI) Delta calculated - similar to how the script calculates volume delta - for a Binance Perpetual Future pair.
This feature only works for Binance Futures pairs; the script will not load when trying to calculate OI Delta on other assets.
Additionally, a heatmap is displayable should you configure the indicator to calculate it.
The image above shows a heatmap using volume delta calculations.
The image above shows a heatmap using OI delta calculations.
Of course, these calculations - when absent requisite data - require some assumptions to better replicate calculations with access to requisite data.
The indicator assumes a 60/40 split when a tick level is traded at and only one metric - "buy volume" or "sell volume" is recorded. This means there shouldn't be any levels recorded where "buy volume" is greater than 0 and "sell volume" equals 0 and vice versa. While this assumption was performed arbitrarily, it may help better replicate volume delta and OI delta calculations seen on other charting platforms.
This option is configurable; you can select to have the script not assume a 60/40 split and instead record volume "as is" at the corresponding tick level.
The script also divides volume and open interest if a one-minute bar violates multiple tick levels. The volume or open interest generated on the one-minute bar will be divided by the number of tick levels it exceeds. The results are, subsequently, appended to the violated tick levels.
Further, the script can be set to recalculate after a user-defined time threshold is exceeded. You can also define the percentage or tick distance between levels.
Also, it'd be great if this indicator can nicely replicate volume delta indicators on other charting platforms. If you've any ideas on how price action can be used to better assume volume at the corresponding price area please let me know!
Thank you (:

TPO Letters [Kioseff Trading]Hello!
"TPO Letters" functions similarly to the script "Realtime TPO Profile"; however, TPO characters are appended to a developing bar. Simply, TPO characters display on the bar that formed them.
All colors are configurable.
The image above emphasizes functionality; TPO letters are colored on a gradient . Additionally, the value area range is shaded; characters that form within the range are gradient colored. Gray-colored characters extend beyond the value area.
The columned data displayed right of the TPO letters shows tick levels. Tick levels are shaded various colors, each color indicative of some occurrence.
Tick Levels
Red: Single Print
Yellow: POC
Lime Green: VAH or VAL
Lighter Green: Value Area Inclusive Level
Left of the TPO horizontal-axis, the aqua-colored line (blue-line inclusive) reflects the high-low range of the session; the blue-colored line reflects the initial-balance range (IBR).
You can select to color TPO letters within the IBR blue (any color).
Additionally, you can select to shade the IBR.
The image above shows auxiliary features.
Unfortunately, I'm unable to orient TPO letters at their intended tick levels using one label per bar, a contrasting feature of the "Realtime TPO Profile" script.
This means only 1000 TPO letters can be displayed simultaneously. If the number of TPO letters exceeds 1000, early-session and middle-session characters will begin to disappear. This isn't an issue for the "Realtime TPO Profile" script, as each tick level comprised one label, to which additional TPO characters were appended to the label as necessary and extended horizontally. Using this same method proved fallible for this indicator - vertical scaling is an issue. While I could append all letters formed for a bar to one label, the letters wouldn't superimpose atop their corresponding tick level (using "\n" didn't suffice).
Consequently, you'll have to, at times, rely on the label & box count oriented in the bottom-right table to see whether the number of labels & boxes transcends the upper threshold. You can hide this table at anytime (:
The image above exemplifies the "Fixed Range" portion of the indicator. A useful inclusion for the "Realtime TPO Profile" script however, while still useful for "TPO Letters", can only display 1000 TPO letters concurrently.
You can also reset the TPO profile at user-defined time intervals.
The indicator hosts an auto-calculate tick levels option; however, there will be times you'll need to manually adjust the tick levels to achieve digestible results (:
That's all! If the script would benefit from an excluded feature, or you notice an error, please let me know! Thank you (:
Shoutout to @kaigouthro for creating an exceptional library for gradient colors!! It was used in this script (:

AC- MY SCRIPT1My Ac- My Scrpt1 that the BUY and SELL signals (trend reversals) for many coins defined different tickers in Tradingview charts
Terminology explanation:
Confirmed Reversal: Oxford T reversal that happened in the last bar and cannot be repainted.
Potential Reversal: Oxford T reversal that might happen in the current bar but can also not happen depending upon the timeframe closing price.
Downtrend: Tickers that are currently in the sell zone
Uptrend: Tickers that are currently in the buy zone
List and show has also got a built in Oxford T indicator which users can confirm the reversals on graphs.
Screener explores the 40 tickers in current graph's time frame and also in desired parameters of the OTT indicator.
Also you can optimize the parameters manually with the built in STRATEGY version.
Built in Moving Average type defaultly set as VAR but users can choose from 8 different Moving Average types like:
SMA : Simple Moving Average
EMA : Exponential Movin Average
WMA : Weighted Moving Average
TMA : Triangular Moving Average
VAR : Variable Index Dynamic Moving Average aka VIDYA
WWMA : Welles Wilder's Moving Average
ZLEMA : Zero Lag Exponential Moving Average
TSF : True Strength Force
Tip: In sideways VAR would be a good choice
You can use OxforfT default alarms and Buy Sell signals like:
1-
BUY when Prices are above OxfordT
SELL when Prices are below OxfordT
2-
BUY when OxfordT support Line crosses over OoxfordT line.
SELL when OxfordT support Line crosses under OxfordT line.
3-
BUY when OxfordT line is Green and makes higher highs.
SELL when OxfordT line is Red and makes lower lows.
IMPORTANT: SCREENER ONLY EXPLORES AND SCREENS FOR THE 2nd SIGNAL TYPE:
BUY when OxfordT support Line crosses over OxfordT line.
SELL when OxfordT support Line crosses under OxfordT line.
Intrabar Price/Volume Change (experimental)This experimental script shows the intrabar progression of price/volume
It can only be used with live data, when you switch timeframe or ticker, it will start over again.
When you let the script run, you'll get insight of what is going on during the bar progression.
On each tick, when the price goes up, a green line will be drawn,
if it goes down, a red line is drawn. The higher the difference with previous price, the wider the line.
The same with volume (lighter, broader lines), only it will always be drawn in the same direction as price goes.
You can set the max width of the lines, when a spike is larger then previous lines, the rest will be adjusted, so the ratio stays the same
The center line (position can be changed) has 2 colors (only on second and minute timeframes) -> this makes it easy to see the bar progression, each change in color represents a new bar
Lines can be drawn on 2 sides, or at 1 side, also they can be reversed
Many thanks to @LonesomeTheBlue and @LucF for their inspiration, help and guidance!
Cheers!

Universal logarithmic growth curves, with support and resistanceLogarithmic regression is used to model data where growth or decay accelerates rapidly at first and then slows over time. This model is for the long term series data (such as 10 years time span).
The user can consider entering the market when the price below 25% or 5% confidence and consider take profit when the price goes above 75% or 95% confidence line.
This script is:
- Designed to be usable in all tickers. (not only for bitcoin now!)
- Logarithmic regression and shows support-resistance level
- Shape of lines are all linear adjustable
- Height difference of levels and zones are customizable
- Support and resistance levels are highlighted
Input panel:
- Steps of drawing: Won't change it unless there are display problems.
- Resistance, support, other level color: self-explanatory.
- Stdev multipliers: A constant variable to adjust regression boundaries.
- Fib level N: Base on the relative position of top line and base line. If you don't want all fib levels, you might set all fib levels = 0.5.
- Linear lift up: vertically lift up the whole set of lines. By linear multiplication.
- Curvature constant: It is the base value of the exponential transform before converting it back to the chart and plotting it. A bigger base value will make a more upward curvy line.
FAQ:
Q: How to use it?
A: Click "Fx" in your chart then search this script to get it into your chart. Then right click the price axis, then select "Logarithmic" scale to show the curves probably.
Q: Why release this script?
A: - This script is intended to to fix the current issues of bitcoins growth curve script, and to provide a better version of the logarithmic curve, which is not only for bitcoin , but for all kinds of tickers.
- In the public library there is a hardcoded logarithmic growth curve by @quantadelic . But unfortunately that curve was hardcoded by his manual inputs, which makes the curve stop updating its value since 2019 the date he publish that code. Many users of that script love using it but they realize it was stop updating, many users out there based on @quantadelic version of "bitcoin logarithmic growth curves" and they tried their best to update the coordinates with their own hardcode input values. Eventually, a lot of redundant hardcoded "Bitcoin growth curve" scripts was born in the public library. Which is not a good thing.
Q: What about looking at the regression result with a log scale price axis?
A: You can use this script that I published in a year ago. This script display the result in a log scale price axis.

DePriExchange weighted price for cryptocurrencies
DECENTRALIZED PRICE CHART FOR DECENTRALIZED WORLD
See non-manipulated , globally price action that comes from whole liquidity!
The main idea behind this script is that...
The value of each trading pair finally determined globally and the price displayed in exchanges is its own and not global! differences between exchanges, reduced to near zero gradually by market makers and arbitrages, so..
Every min tick price changes Must be backed by liquidity to be part of the global fluctuations
more liquidity gives it more credibility
more credibility give it more weight
..Against opposing movements.
This script can collect price of crypto pairs from 12 exchanges that listed on TV and have effective volume.
In the first step, summarizes the volume of all exchanges and creates the total volume
In the next step, divide each exchange volume to total volume to obtain relative weight of each exchange.
In the final step, multiply each exchange price to weight of itself and summarizes these numbers .. now, we have Exchange weighted price!
The results on high liquidity pairs like BTCUSDT, ETHUSDT, is not much differ then simple chart but when you apply it on lower liquidity, lower time frames of altcoins, you realize its benefits and usefulness. Altcoins chart in composite and simple mode is very differ, I hope you enjoy from TRUE CHART.
With this, also you can..
Filter and smooth candlestick chart with SMA or EMA
Plot a line chart of pair at your desired frame separate from the main chart for monitor important price levels
Get realtime report of whole volume of pair on included exchanges
Get realtime report of each exchange weight and share
Note.1:
some of pairs queted on more than one like BTCUSD, BTCUSDT, BTCUSDC and etc. In this pairs we choose the one that usually has more volume on that exchange.
Note.2:
At this time, supported queted currencies are BTC, ETH, USD, USDT, BUSD, USDC, USDK.
Note.3:
This script is relatively heavy! This is not cuz of bad coding.
Each bar compution contains at least one plot and some of security calls, so 10 to 15 seconds is normal load time.
Note.4:
You can combine this with your price action base scripts and use balanced OHLCV. The necessary explanations about this are available in the code.
Note.5:
You must only include exchanges that support your ticker, Otherwise you will receive an error.
I hope it comes useful to you.

Godmode 4.0.0 [Oscillator]First off, a huge thank you to the following people:
LEGION:
LazyBear: www.tradingview.com
xSilas: www.tradingview.com
Ni6HTH4awK: www.tradingview.com
sco77m4r7and:
SNOW_CITY: www.tradingview.com
oh92: www.tradingview.com
alexgrover: www.tradingview.com
cI8DH: www.tradingview.com
DonovanWall: www.tradingview.com
Since I've been on TradingView I've become somewhat enthralled by Godmode and the collective work that goes in to it, so I decided to publish my own iteration, building off the ideas already present. (This is a great way to get familiar with Pine by the way, just in case there are any beginners reading this)
Changes
The first change I made was to allow the user to select whatever tickerid they wanted as a benchmark. If trading XBTUSD on BitMEX for example, the indicator will react to exchange-specific activity, which means it will respond to all the little whipsaws, whipsaws that can be especially present on a futures exchange. By typing CRYPTOCAP:BTC or CRYPTOCAP:TOTAL we endeavor to remove noise. It can also signal earlier. Less noise and less lag. Another idea would be to choose a benchmark that has a strong inverse relationship with the asset you're trading: try CRYPTOCAP:USDT as the benchmark against BTC to see what I mean.
I also added the ability to smooth the plot, yet again removing noise but adding considerable lag.
The linear regression of the wave-trend is calculated in place of the EMA. This is plotted as columns with the midline (50) as the base. This is just calculating the slope of the wave-trend and can signal a weakening trend before a reversal takes place.
Using cI8DH's True RSI script () as inspiration, I added a function for calculating the True TSI in an attempt to remove any bullish bias. Funnily enough, when I tried to do the same with the RSI I had some problems. I'll try to resolve this in the coming weeks.
Made slight changes to the aesthetics. Tried to bring the two main plots alive by making their bold, opaque colors stand off the subtle tones in the background.
To Do List
1. I would like to sort out the issue with the True RSI.
2. When the plots are smoothed, there's an issue with the green 'Caution!' dots appearing in the lower half of the indicator.
3. I'd like to adjust the code so that if the 'Benchmark' box is empty, that it will automatically register the current tickerid as the 'Benchmark'.
If anyone has any suggestions on other fixes or how to apply the fixes mentioned by me, please don't hesitate to reach out to me here or through other media platforms.
Want to Learn?
If you'd like the opportunity to learn Pine but you have difficulty finding resources to guide you, take a look at this rudimentary list: docs.google.com
The list will be updated in the future as more people share the resources that have helped, or continue to help, them. Follow me on Twitter to keep up-to-date with the growing list of resources.
Suggestions or Questions?
Don't even kinda hesitate to forward them to me. My (metaphorical) door is always open.
BITMEX:XBTUSD
CRYPTOCAP:BTC
CRYPTOCAP:TOTAL
CRYPTOCAP:USDT.D

Simple Spread Simple spread between two tickers. Click format to set inputs for tickers. ex: "COINBASE:BTC:USD"

OHLC Volatility Estimators by @Xel_arjonaDISCLAIMER:
The Following indicator/code IS NOT intended to be a formal investment advice or recommendation by the author, nor should be construed as such. Users will be fully responsible by their use regarding their own trading vehicles/assets.
The embedded code and ideas within this work are FREELY AND PUBLICLY available on the Web for NON LUCRATIVE ACTIVITIES and must remain as is by Creative-Commons as TradingView's regulations. Any use, copy or re-use of this code should mention it's origin as it's authorship.
WARNING NOTICE!
THE INCLUDED FUNCTION MUST BE CONSIDERED AS DEBUGING CODE The models included in the function have been taken from openly sources on the web so they could have some errors as in the calculation scheme and/or in it's programatic scheme. Debugging are welcome.
WHAT'S THIS?
Here's a full collection of candle based (compressed tick) Volatility Estimators given as a function, openly available for free, it can print IMPLIED VOLATILITY by an external symbol ticker like INDEX:VIX.
Models included in the volatility calculation function:
CLOSE TO CLOSE: This is the classic estimator by rule, sometimes referred as HISTORICAL VOLATILITY and is the must common, accepted and widely used out there. Is based on traditional Standard Deviation method derived from the logarithm return of current close from yesterday's.
ELASTIC WEIGHTED MOVING AVERAGE: This estimator has been used by RiskMetriks®. It's calculation is based on an ElasticWeightedMovingAverage Standard Deviation method derived from the logarithm return of current close from yesterday's. It can be viewed or named as an EXPONENTIAL HISTORICAL VOLATILITY model.
PARKINSON'S: The Parkinson number, or High Low Range Volatility, developed by the physicist, Michael Parkinson, in 1980 aims to estimate the Volatility of returns for a random walk using the high and low in any particular period. IVolatility.com calculates daily Parkinson values. Prices are observed on a fixed time interval. n=10, 20, 30, 60, 90, 120, 150, 180 days.
ROGERS-SATCHELL: The Rogers-Satchell function is a volatility estimator that outperforms other estimators when the underlying follows a Geometric Brownian Motion (GBM) with a drift (historical data mean returns different from zero). As a result, it provides a better volatility estimation when the underlying is trending. However, this Rogers-Satchell estimator does not account for jumps in price (Gaps). It assumes no opening jump. The function uses the open, close, high, and low price series in its calculation and it has only one parameter, which is the period to use to estimate the volatility.
YANG-ZHANG: Yang and Zhang were the first to derive an historical volatility estimator that has a minimum estimation error, is independent of the drift, and independent of opening gaps. This estimator is maximally 14 times more efficient than the close-to-close estimator.
LOGARITHMIC GARMAN-KLASS: The former is a pinescript transcript of the model defined as in iVolatility . The metric used is a combination of the overnight, high/low and open/close range. Such a volatility metric is a more efficient measure of the degree of volatility during a given day. This metric is always positive.

920 Order Flow SATY ATR//@version=6
indicator("Order-Flow / Volume Signals (No L2)", overlay=true)
//======================
// Inputs
//======================
rvolLen = input.int(20, "Relative Volume Lookback", minval=5)
rvolMin = input.float(1.1, "Min Relative Volume (× avg)", step=0.1)
wrbLen = input.int(20, "Wide-Range Lookback", minval=5)
wrbMult = input.float(1, "Wide-Range Multiplier", step=0.1)
upperCloseQ = input.float(0.60, "Close near High (0-1)", minval=0.0, maxval=1.0)
lowerCloseQ = input.float(0.40, "Close near Low (0-1)", minval=0.0, maxval=1.0)
cdLen = input.int(25, "Rolling CumDelta Window", minval=5)
useVWAP = input.bool(true, "Use VWAP Bias Filter")
showSignals = input.bool(true, "Show Long/Short OF Triangles")
//======================
// Core helpers
//======================
rng = high - low
tr = ta.tr(true)
avgTR = ta.sma(tr, wrbLen)
wrb = rng > wrbMult * avgTR
// Relative Volume
volAvg = ta.sma(volume, rvolLen)
rvol = volAvg > 0 ? volume / volAvg : 0.0
// Close location in bar (0..1)
clo = rng > 0 ? (close - low) / rng : 0.5
// VWAP (session) + SMAs
vwap = ta.vwap(close)
sma9 = ta.sma(close, 9)
sma20 = ta.sma(close, 20)
sma200= ta.sma(close, 200)
// CumDelta proxy (uptick/downtick signed volume)
tickSign = close > close ? 1.0 : close < close ? -1.0 : 0.0
delta = volume * tickSign
cumDelta = ta.cum(delta)
rollCD = cumDelta - cumDelta
//======================
// Signal conditions
//======================
volActive = rvol >= rvolMin
effortBuy = wrb and clo >= upperCloseQ
effortSell = wrb and clo <= lowerCloseQ
cdUp = ta.crossover(rollCD, 0)
cdDown = ta.crossunder(rollCD, 0)
biasBuy = not useVWAP or close > vwap
biasSell = not useVWAP or close < vwap
longOF = barstate.isconfirmed and volActive and effortBuy and cdUp and biasBuy
shortOF = barstate.isconfirmed and volActive and effortSell and cdDown and biasSell
//======================
// Plot ONLY on price chart
//======================
// SMAs & VWAP
plot(sma9, title="9 SMA", color=color.orange, linewidth=3)
plot(sma20, title="20 SMA", color=color.white, linewidth=3)
plot(sma200, title="200 SMA", color=color.black, linewidth=3)
plot(vwap, title="VWAP", color=color.new(color.aqua, 0), linewidth=3)
// Triangles with const text (no extra pane)
plotshape(showSignals and longOF, title="LONG OF",
style=shape.triangleup, location=location.belowbar, size=size.tiny,
color=color.new(color.green, 0), text="LONG OF")
plotshape(showSignals and shortOF, title="SHORT OF",
style=shape.triangledown, location=location.abovebar, size=size.tiny,
color=color.new(color.red, 0), text="SHORT OF")
// Alerts
alertcondition(longOF, title="LONG OF confirmed", message="LONG OF confirmed")
alertcondition(shortOF, title="SHORT OF confirmed", message="SHORT OF confirmed")
//────────────────────────────
// End-of-line labels (offset to the right)
//────────────────────────────
var label label9 = na
var label label20 = na
var label label200 = na
var label labelVW = na
if barstate.islast
// delete old labels before drawing new ones
label.delete(label9)
label.delete(label20)
label.delete(label200)
label.delete(labelVW)
// how far to move the labels rightward (increase if needed)
offsetBars = input.int(3)
label9 := label.new(bar_index + offsetBars, sma9, "9 SMA", style=label.style_label_left, textcolor=color.white, color=color.new(color.orange, 0))
label20 := label.new(bar_index + offsetBars, sma20, "20 SMA", style=label.style_label_left, textcolor=color.black, color=color.new(color.white, 0))
label200 := label.new(bar_index + offsetBars, sma200, "200 SMA", style=label.style_label_left, textcolor=color.white, color=color.new(color.black, 0))
labelVW := label.new(bar_index + offsetBars, vwap, "VWAP", style=label.style_label_left, textcolor=color.black, color=color.new(color.aqua, 0))
//────────────────────────────────────────────────────────────────────
//────────────────────────────────────────────
// Overnight High/Low + HOD/LOD (no POC)
//────────────────────────────────────────────
sessionRTH = input.session("0930-1600", "RTH Session (exchange tz)")
levelWidth = input.int(2, "HL line width", minval=1, maxval=5)
labelOffsetH = input.int(10, "HL label offset (bars to right)", minval=0)
isRTH = not na(time(timeframe.period, sessionRTH))
rthOpen = isRTH and not isRTH
// --- Track Overnight High/Low during NON-RTH; freeze at RTH open
// --- Track Overnight High/Low during NON-RTH; freeze at RTH open
var float onHigh = na
var float onLow = na
var int onHighBar = na
var int onLowBar = na
var float onHighFix = na
var float onLowFix = na
var int onHighFixBar = na
var int onLowFixBar = na
if not isRTH
if na(onHigh) or high > onHigh
onHigh := high
onHighBar := bar_index
if na(onLow) or low < onLow
onLow := low
onLowBar := bar_index
if rthOpen
onHighFix := onHigh
onLowFix := onLow
onHighFixBar := onHighBar
onLowFixBar := onLowBar
onHigh := na, onLow := na
onHighBar := na, onLowBar := na
// ──────────────────────────────────────────
// Candle coloring + labels for 9/20/VWAP crosses
// ──────────────────────────────────────────
showCrossLabels = input.bool(true, "Show cross labels")
// Helpers
minAll = math.min(math.min(sma9, sma20), vwap)
maxAll = math.max(math.max(sma9, sma20), vwap)
// All three lines
goldenAll = open <= minAll and close >= maxAll
deathAll = open >= maxAll and close <= minAll
// 9/20 only (exclude cases that also crossed VWAP)
dcUpOnly = open <= math.min(sma9, sma20) and close >= math.max(sma9, sma20) and not goldenAll
dcDownOnly = open >= math.max(sma9, sma20) and close <= math.min(sma9, sma20) and not deathAll
// Candle colors (priority: all three > 9/20 only)
var color cCol = na
cCol := goldenAll ? color.yellow : deathAll ? color.black :dcUpOnly ? color.lime :dcDownOnly ? color.red : na
barcolor(cCol)
// Labels
plotshape(showCrossLabels and barstate.isconfirmed and goldenAll, title="GOLDEN CROSS",
style=shape.labelup, location=location.belowbar, text="GOLDEN CROSS",
color=color.new(color.yellow, 0), textcolor=color.black, size=size.tiny)
plotshape(showCrossLabels and barstate.isconfirmed and deathAll, title="DEATH CROSS",
style=shape.labeldown, location=location.abovebar, text="DEATH CROSS",
color=color.new(color.black, 0), textcolor=color.white, size=size.tiny)
plotshape(showCrossLabels and barstate.isconfirmed and dcUpOnly, title="DC UP",
style=shape.labelup, location=location.belowbar, text="DC UP",
color=color.new(color.lime, 0), textcolor=color.black, size=size.tiny)
plotshape(showCrossLabels and barstate.isconfirmed and dcDownOnly, title="DC DOWN",
style=shape.labeldown, location=location.abovebar, text="DC DOWN",
color=color.new(color.red, 0), textcolor=color.white, size=size.tiny)
// ──────────────────────────────────────────
// Audible + alert conditions
// ──────────────────────────────────────────
alertcondition(goldenAll, title="GOLDEN CROSS", message="GOLDEN CROSS detected")
alertcondition(deathAll, title="DEATH CROSS", message="DEATH CROSS detected")
alertcondition(dcUpOnly, title="DC UP", message="Dual Cross UP detected")
alertcondition(dcDownOnly,title="DC DOWN", message="Dual Cross DOWN detected")

Smart Margin Zone
SMART MARGIN ZONE - CME-BASED SUPPORT & RESISTANCE INDICATOR
TITLE FOR PUBLICATION:
Smart Margin Zone - CME Margin-Based Support and Resistance
CATEGORY:
Support and Resistance
SHORT DESCRIPTION (for preview):
Automatically plots margin zones based on CME Group requirements. These zones represent critical price levels where leveraged traders face margin calls, creating natural support and resistance through forced liquidations.
═══════════════════════════════════════════════════════════════
FULL DESCRIPTION FOR TRADINGVIEW:
═══════════════════════════════════════════════════════════════
📊 Smart Margin Zone - Professional Trading Zones Based on CME Data
This indicator automatically calculates and displays margin zones derived from official CME Group margin requirements. These zones represent critical price levels where traders using leverage receive margin calls, triggering forced position closures that create natural support and resistance levels.
═══════════════════════════════════════════════════════════════
🎯 CORE CONCEPT
═══════════════════════════════════════════════════════════════
When price reaches calculated margin zones, traders using 2:1 or 4:1 leverage on CME futures receive margin calls. Brokers automatically liquidate these positions, creating waves of buying or selling pressure that form strong support and resistance levels.
This is not theoretical - it's based on actual margin requirements from CME Group, the world's largest derivatives marketplace.
═══════════════════════════════════════════════════════════════
📐 CALCULATION METHODOLOGY
═══════════════════════════════════════════════════════════════
The indicator uses the following formula to calculate zone sizes:
Zone Size = (Margin Requirement / Tick Value) × Tick Size × 1.10
Where:
• Margin Requirement = Official CME initial margin (updated November 2024)
• Tick Value = Dollar value of minimum price movement
• Tick Size = Minimum price increment
• 1.10 = 10% buffer for realistic zone width
SUPPORTED INSTRUMENTS WITH CME DATA:
Currency Pairs:
• EURUSD: $2,100 margin → 0.0168 zone size
• GBPUSD: $1,800 margin → 0.0144 zone size
• AUDUSD: $1,300 margin → 0.0065 zone size
• NZDUSD: $1,100 margin → 0.0055 zone size
• USDJPY: $3,200 margin → custom calculation
• USDCAD: $950 margin → calculated
• USDCHF: $1,650 margin → calculated
Commodities:
• Gold (XAUUSD): $8,000 margin → 80 points zone size
• Silver (XAGUSD): $6,500 margin → calculated
• WTI Crude Oil: $4,500 margin → calculated
═══════════════════════════════════════════════════════════════
🔍 HOW IT WORKS
═══════════════════════════════════════════════════════════════
1. SWING POINT DETECTION
The indicator automatically identifies swing highs and swing lows using a configurable lookback period (default 10 bars). These become anchor points for zone calculations.
2. FIVE ZONE LEVELS
From each swing point, five zone levels are calculated:
• Zone 1/4 (25%) - First correction level
• Zone 1/2 (50%) - KEY ZONE for trend determination
• Zone 3/4 (75%) - Intermediate level
• Zone 1/1 (100%) - Full margin zone (strongest level)
• Zone 5/4 (125%) - Extended zone
3. TREND IDENTIFICATION
• Close above Zone 1/2 resistance = Bullish trend
• Close below Zone 1/2 support = Bearish trend
• Between zones = Range/consolidation
4. HISTORICAL CONTEXT
Current zones are displayed prominently with fills and labels. Historical zones appear as thin, semi-transparent lines for context without cluttering the chart.
═══════════════════════════════════════════════════════════════
⚙️ FEATURES
═══════════════════════════════════════════════════════════════
AUTOMATED CALCULATION:
✅ Auto-detection of swing highs and lows
✅ Real-time zone updates as new swings form
✅ CME margin data built-in for major instruments
✅ Manual override option for custom calculations
VISUAL CLARITY:
✅ Color-coded zones (red=resistance, green=support)
✅ Adjustable transparency for fills and lines
✅ Current zones bold with fills and price labels
✅ Historical zones thin and transparent
✅ Swing point markers show calculation origins
CUSTOMIZATION:
✅ Show/hide individual zone levels (1/4, 1/2, 3/4, 1/1, 5/4)
✅ Toggle historical zones on/off
✅ Adjustable lookback period (5-50 bars)
✅ Customizable colors for all elements
✅ Line width and transparency controls
✅ Zone extension options (none/right/both)
TREND ANALYSIS:
✅ Optional trend background coloring
✅ Customizable trend colors and transparency
✅ Real-time trend identification display
STATISTICS:
✅ Live statistics table showing:
- Current instrument
- Active zone size
- Calculation mode
- Current trend direction
- Number of zones displayed
ALERTS:
✅ Zone 1/2 breakout (up/down)
✅ Full margin zone 1/1 reached
✅ Customizable alert messages
═══════════════════════════════════════════════════════════════
📈 TRADING APPLICATIONS
═══════════════════════════════════════════════════════════════
ENTRY SIGNALS:
• Bounces from zone levels = potential entry points
• Zone 1/2 breakouts = trend continuation entries
• Zone rejections = reversal opportunities
RISK MANAGEMENT:
• Zone levels = logical stop-loss placement
• Zone 1/1 = maximum risk level
• Zone spacing = position sizing guide
PROFIT TARGETS:
• Next zone level = first target
• Zone 1/1 = full profit target
• Zone breakouts = extended targets
TREND CONFIRMATION:
• Price above Zone 1/2 resistance = confirmed uptrend
• Price below Zone 1/2 support = confirmed downtrend
• Consolidation between zones = wait for breakout
═══════════════════════════════════════════════════════════════
📚 USAGE INSTRUCTIONS
═══════════════════════════════════════════════════════════════
GETTING STARTED:
1. Add indicator to chart of any supported instrument
2. Zones automatically calculate and display
3. Adjust swing detection period if needed (default 10 works well)
4. Customize colors and visibility to your preference
OPTIMAL SETTINGS:
• Best timeframes: H1, H4, Daily, Weekly
• Default swing length (10) suitable for most markets
• Show 2-3 historical zones for context
• Enable swing point markers to see calculation origins
INTERPRETATION:
• Watch for price reactions at zone boundaries
• Strong bounces = respect for margin level
• Clean breaks = momentum continuation
• Multiple touches = zone strength confirmation
SET ALERTS:
• Zone 1/2 breakouts for trend entries
• Zone 1/1 reaches for profit-taking
• Custom alerts for your specific strategy
═══════════════════════════════════════════════════════════════
⚠️ IMPORTANT NOTES
═══════════════════════════════════════════════════════════════
DATA ACCURACY:
• CME margin requirements updated November 2024
• Margins change periodically - check CME Group website
• Manual mode available for latest margin data
• Indicator provides analysis tool, not financial advice
STATISTICAL PERFORMANCE:
• Historical data shows >60% probability of continued movement after Zone 1/2 breakout
• Zone effectiveness varies by market conditions
• Best results in trending markets with clear swings
LIMITATIONS:
• Margin requirements change - monitor CME updates
• Works best on liquid instruments with clear swings
• Not a standalone trading system
• Should be combined with additional analysis
═══════════════════════════════════════════════════════════════
🔧 METHODOLOGY CREDIT
═══════════════════════════════════════════════════════════════
This indicator is based on the margin zones concept developed by Alexander Bazylev (BTrade indicator for MetaTrader platforms).
The TradingView implementation has been completely rewritten with original enhancements:
• Multiple zone levels instead of single level
• Automatic swing point detection algorithm
• Direct CME data integration
• Historical zone visualization
• Advanced customization options
• Comprehensive statistics and alerts
All code is original and specifically designed for TradingView's Pine Script v5 environment.
═══════════════════════════════════════════════════════════════
💡 BEST PRACTICES
═══════════════════════════════════════════════════════════════
COMBINE WITH:
• Volume analysis for confirmation
• Trend indicators for direction bias
• Price action patterns at zones
• Higher timeframe analysis
AVOID:
• Trading against strong trends at minor zones
• Over-leveraging based solely on zone placement
• Ignoring broader market context
• Expecting perfect bounces every time
OPTIMIZE:
• Adjust swing length for different timeframes
• Shorter period (5-7) for intraday trading
• Longer period (15-20) for swing trading
• Test historical effectiveness on your instruments
═══════════════════════════════════════════════════════════════
📖 EDUCATIONAL VALUE
═══════════════════════════════════════════════════════════════
This indicator helps traders understand:
• How institutional margin requirements affect price
• Where forced liquidations create pressure
• Natural support and resistance formation
• Relationship between leverage and price levels
• Market structure and key technical levels
═══════════════════════════════════════════════════════════════
🔄 VERSION HISTORY
═══════════════════════════════════════════════════════════════
Version 1.0 (Initial Release):
• CME-based zone calculation for 10 instruments
• Automatic swing high/low detection
• 5 zone levels with customizable display
• Historical zones with transparency control
• Swing point markers
• Trend background indicator
• Live statistics table
• Multiple alert conditions
• Fully customizable colors and styles
• English language interface
═══════════════════════════════════════════════════════════════
📞 SUPPORT & FEEDBACK
═══════════════════════════════════════════════════════════════
Questions or suggestions? Leave a comment below!
If you find this indicator useful:
⭐ Please leave a like
💬 Share your experience in comments
🔔 Follow for updates and new indicators
═══════════════════════════════════════════════════════════════
⚖️ DISCLAIMER
═══════════════════════════════════════════════════════════════
This indicator is provided for educational and analytical purposes only. It is not financial advice and should not be the sole basis for trading decisions.
• Past performance does not guarantee future results
• Trading involves substantial risk of loss
• CME margin requirements subject to change
• Always do your own research and risk management
• Consult a financial advisor for investment advice
The creator is not responsible for any trading losses incurred through use of this indicator.

Market Breadth Decision HelperMarket Breadth Decision Helper (NYSE/NASDAQ VOLD, ADD, TICK)
Combines NYSE VOLD, NASDAQ VOLD (VOLDQ), NYSE/NASDAQ ADD, and TICK into a single intraday dashboard for tactical bias and risk management.
Tiered pressure scale (sign shows direction, abs(tier) shows intensity): 0 = Neutral, 1 = Mild, 2 = Strong, 3 = Severe, 4 = Panic. On-chart legend makes this explicit.
Table view highlights value, tier, bull/bear point contributions, and notes (PANIC, OVERRIDE, DIVERGENCE). VOLD and ADD panic trigger “stand down”; VOLD ±2 triggers bull/bear overrides; NYSE vs NASDAQ ADD divergence triggers “scalp only.”
Bull/bear points: VOLD 2 pts, ADD NYSE 2 pts, ADD NASDAQ 1 pt, TICK 1 pt. ≥3 pts on a side lifts that side’s multiplier to 1.5. Bias flips Bullish/Bearish only if a side leads and has ≥2 pts; otherwise Neutral.
Breadth modes: PANIC_NO_TRADE → DIVERGENCE_SCALP_ONLY → VOLD_OVERRIDE_BULL/BEAR → NORMAL/NO_EDGE.
Intraday context: tracks current session day_high / day_low for the chart symbol.
JSON/Alert export (optional) sends raw values plus *_tier and *_tier_desc labels (NEUTRAL/MILD/STRONG/SEVERE/PANIC) with sign/magnitude hints, so agents/bots never have to guess what “1 vs 2 vs 3 vs 4” mean.
Customizable bands for VOLD/ADD/TICK, table styling, label placement, and dashboard bias input to align with higher-timeframe context.
Best use
Quick read on internal participation and pressure magnitude.
Guardrails: respect PANIC and overrides; treat divergence as “scalp only.”
Pair with your strategy entries; let breadth govern when to press, scale back, or stand down.
Symbols (defaults)
VOLD (NYSE volume diff), VOLDQ (NASDAQ volume diff), ADD (NYSE), ADDQ (NASDAQ), TICK (NYSE). Adjust in Inputs as needed.
Alerts
Panic, divergence, strong bullish/bearish breadth. Enable JSON export to feed algo/agent workflows.

Algorithm Predator - ML-liteAlgorithm Predator - ML-lite
This indicator combines four specialized trading agents with an adaptive multi-armed bandit selection system to identify high-probability trade setups. It is designed for swing and intraday traders who want systematic signal generation based on institutional order flow patterns , momentum exhaustion , liquidity dynamics , and statistical mean reversion .
Core Architecture
Why These Components Are Combined:
The script addresses a fundamental challenge in algorithmic trading: no single detection method works consistently across all market conditions. By deploying four independent agents and using reinforcement learning algorithms to select or blend their outputs, the system adapts to changing market regimes without manual intervention.
The Four Trading Agents
1. Spoofing Detector Agent 🎭
Detects iceberg orders through persistent volume at similar price levels over 5 bars
Identifies spoofing patterns via asymmetric wick analysis (wicks exceeding 60% of bar range with volume >1.8× average)
Monitors order clustering using simplified Hawkes process intensity tracking (exponential decay model)
Signal Logic: Contrarian—fades false breakouts caused by institutional manipulation
Best Markets: Consolidations, institutional trading windows, low-liquidity hours
2. Exhaustion Detector Agent ⚡
Calculates RSI divergence between price movement and momentum indicator over 5-bar window
Detects VWAP exhaustion (price at 2σ bands with declining volume)
Uses VPIN reversals (volume-based toxic flow dissipation) to identify momentum failure
Signal Logic: Counter-trend—enters when momentum extreme shows weakness
Best Markets: Trending markets reaching climax points, over-extended moves
3. Liquidity Void Detector Agent 💧
Measures Bollinger Band squeeze (width <60% of 50-period average)
Identifies stop hunts via 20-bar high/low penetration with immediate reversal and volume spike
Detects hidden liquidity absorption (volume >2× average with range <0.3× ATR)
Signal Logic: Breakout anticipation—enters after liquidity grab but before main move
Best Markets: Range-bound pre-breakout, volatility compression zones
4. Mean Reversion Agent 📊
Calculates price z-scores relative to 50-period SMA and standard deviation (triggers at ±2σ)
Implements Ornstein-Uhlenbeck process scoring (mean-reverting stochastic model)
Uses entropy analysis to detect algorithmic trading patterns (low entropy <0.25 = high predictability)
Signal Logic: Statistical reversion—enters when price deviates significantly from statistical equilibrium
Best Markets: Range-bound, low-volatility, algorithmically-dominated instruments
Adaptive Selection: Multi-Armed Bandit System
The script implements four reinforcement learning algorithms to dynamically select or blend agents based on performance:
Thompson Sampling (Default - Recommended):
Uses Bayesian inference with beta distributions (tracks alpha/beta parameters per agent)
Balances exploration (trying underused agents) vs. exploitation (using proven winners)
Each agent's win/loss history informs its selection probability
Lite Approximation: Uses pseudo-random sampling from price/volume noise instead of true random number generation
UCB1 (Upper Confidence Bound):
Calculates confidence intervals using: average_reward + sqrt(2 × ln(total_pulls) / agent_pulls)
Deterministic algorithm favoring agents with high uncertainty (potential upside)
More conservative than Thompson Sampling
Epsilon-Greedy:
Exploits best-performing agent (1-ε)% of the time
Explores randomly ε% of the time (default 10%, configurable 1-50%)
Simple, transparent, easily tuned via epsilon parameter
Gradient Bandit:
Uses softmax probability distribution over agent preference weights
Updates weights via gradient ascent based on rewards
Best for Blend mode where all agents contribute
Selection Modes:
Switch Mode: Uses only the selected agent's signal (clean, decisive)
Blend Mode: Combines all agents using exponentially weighted confidence scores controlled by temperature parameter (smooth, diversified)
Lock Agent Feature:
Optional manual override to force one specific agent
Useful after identifying which agent dominates your specific instrument
Only applies in Switch mode
Four choices: Spoofing Detector, Exhaustion Detector, Liquidity Void, Mean Reversion
Memory System
Dual-Layer Architecture:
Short-Term Memory: Stores last 20 trade outcomes per agent (configurable 10-50)
Long-Term Memory: Stores episode averages when short-term reaches transfer threshold (configurable 5-20 bars)
Memory Boost Mechanism: Recent performance modulates agent scores by up to ±20%
Episode Transfer: When an agent accumulates sufficient results, averages are condensed into long-term storage
Persistence: Manual restoration of learned parameters via input fields (alpha, beta, weights, microstructure thresholds)
How Memory Works:
Agent generates signal → outcome tracked after 8 bars (performance horizon)
Result stored in short-term memory (win = 1.0, loss = 0.0)
Short-term average influences agent's future scores (positive feedback loop)
After threshold met (default 10 results), episode averaged into long-term storage
Long-term patterns (weighted 30%) + short-term patterns (weighted 70%) = total memory boost
Market Microstructure Analysis
These advanced metrics quantify institutional order flow dynamics:
Order Flow Toxicity (Simplified VPIN):
Measures buy/sell volume imbalance over 20 bars: |buy_vol - sell_vol| / (buy_vol + sell_vol)
Detects informed trading activity (institutional players with non-public information)
Values >0.4 indicate "toxic flow" (informed traders active)
Lite Approximation: Uses simple open/close heuristic instead of tick-by-tick trade classification
Price Impact Analysis (Simplified Kyle's Lambda):
Measures market impact efficiency: |price_change_10| / sqrt(volume_sum_10)
Low values = large orders with minimal price impact ( stealth accumulation )
High values = retail-dominated moves with high slippage
Lite Approximation: Uses simplified denominator instead of regression-based signed order flow
Market Randomness (Entropy Analysis):
Counts unique price changes over 20 bars / 20
Measures market predictability
High entropy (>0.6) = human-driven, chaotic price action
Low entropy (<0.25) = algorithmic trading dominance (predictable patterns)
Lite Approximation: Simple ratio instead of true Shannon entropy H(X) = -Σ p(x)·log₂(p(x))
Order Clustering (Simplified Hawkes Process):
Tracks self-exciting event intensity (coordinated order activity)
Decays at 0.9× per bar, spikes +1.0 when volume >1.5× average
High intensity (>0.7) indicates clustering (potential spoofing/accumulation)
Lite Approximation: Simple exponential decay instead of full λ(t) = μ + Σ α·exp(-β(t-tᵢ)) with MLE
Signal Generation Process
Multi-Stage Validation:
Stage 1: Agent Scoring
Each agent calculates internal score based on its detection criteria
Scores must exceed agent-specific threshold (adjusted by sensitivity multiplier)
Agent outputs: Signal direction (+1/-1/0) and Confidence level (0.0-1.0)
Stage 2: Memory Boost
Agent scores multiplied by memory boost factor (0.8-1.2 based on recent performance)
Successful agents get amplified, failing agents get dampened
Stage 3: Bandit Selection/Blending
If Adaptive Mode ON:
Switch: Bandit selects single best agent, uses only its signal
Blend: All agents combined using softmax-weighted confidence scores
If Adaptive Mode OFF:
Traditional consensus voting with confidence-squared weighting
Signal fires when consensus exceeds threshold (default 70%)
Stage 4: Confirmation Filter
Raw signal must repeat for consecutive bars (default 3, configurable 2-4)
Minimum confidence threshold: 0.25 (25%) enforced regardless of mode
Trend alignment check: Long signals require trend_score ≥ -2, Short signals require trend_score ≤ 2
Stage 5: Cooldown Enforcement
Minimum bars between signals (default 10, configurable 5-15)
Prevents over-trading during choppy conditions
Stage 6: Performance Tracking
After 8 bars (performance horizon), signal outcome evaluated
Win = price moved in signal direction, Loss = price moved against
Results fed back into memory and bandit statistics
Trading Modes (Presets)
Pre-configured parameter sets:
Conservative: 85% consensus, 4 confirmations, 15-bar cooldown
Expected: 60-70% win rate, 3-8 signals/week
Best for: Swing trading, capital preservation, beginners
Balanced: 70% consensus, 3 confirmations, 10-bar cooldown
Expected: 55-65% win rate, 8-15 signals/week
Best for: Day trading, most traders, general use
Aggressive: 60% consensus, 2 confirmations, 5-bar cooldown
Expected: 50-58% win rate, 15-30 signals/week
Best for: Scalping, high-frequency trading, active management
Elite: 75% consensus, 3 confirmations, 12-bar cooldown
Expected: 58-68% win rate, 5-12 signals/week
Best for: Selective trading, high-conviction setups
Adaptive: 65% consensus, 2 confirmations, 8-bar cooldown
Expected: Varies based on learning
Best for: Experienced users leveraging bandit system
How to Use
1. Initial Setup (5 Minutes):
Select Trading Mode matching your style (start with Balanced)
Enable Adaptive Learning (recommended for automatic agent selection)
Choose Thompson Sampling algorithm (best all-around performance)
Keep Microstructure Metrics enabled for liquid instruments (>100k daily volume)
2. Agent Tuning (Optional):
Adjust Agent Sensitivity multipliers (0.5-2.0):
<0.8 = Highly selective (fewer signals, higher quality)
0.9-1.2 = Balanced (recommended starting point)
1.3 = Aggressive (more signals, lower individual quality)
Monitor dashboard for 20-30 signals to identify dominant agent
If one agent consistently outperforms, consider using Lock Agent feature
3. Bandit Configuration (Advanced):
Blend Temperature (0.1-2.0):
0.3 = Sharp decisions (best agent dominates)
0.5 = Balanced (default)
1.0+ = Smooth (equal weighting, democratic)
Memory Decay (0.8-0.99):
0.90 = Fast adaptation (volatile markets)
0.95 = Balanced (most instruments)
0.97+ = Long memory (stable trends)
4. Signal Interpretation:
Green triangle (▲): Long signal confirmed
Red triangle (▼): Short signal confirmed
Dashboard shows:
Active agent (highlighted row with ► marker)
Win rate per agent (green >60%, yellow 40-60%, red <40%)
Confidence bars (█████ = maximum confidence)
Memory size (short-term buffer count)
Colored zones display:
Entry level (current close)
Stop-loss (1.5× ATR)
Take-profit 1 (2.0× ATR)
Take-profit 2 (3.5× ATR)
5. Risk Management:
Never risk >1-2% per signal (use ATR-based stops)
Signals are entry triggers, not complete strategies
Combine with your own market context analysis
Consider fundamental catalysts and news events
Use "Confirming" status to prepare entries (not to enter early)
6. Memory Persistence (Optional):
After 50-100 trades, check Memory Export Panel
Record displayed alpha/beta/weight values for each agent
Record VPIN and Kyle threshold values
Enable "Restore From Memory" and input saved values to continue learning
Useful when switching timeframes or restarting indicator
Visual Components
On-Chart Elements:
Spectral Layers: EMA8 ± 0.5 ATR bands (dynamic support/resistance, colored by trend)
Energy Radiance: Multi-layer glow boxes at signal points (intensity scales with confidence, configurable 1-5 layers)
Probability Cones: Projected price paths with uncertainty wedges (15-bar projection, width = confidence × ATR)
Connection Lines: Links sequential signals (solid = same direction continuation, dotted = reversal)
Kill Zones: Risk/reward boxes showing entry, stop-loss, and dual take-profit targets
Signal Markers: Triangle up/down at validated entry points
Dashboard (Configurable Position & Size):
Regime Indicator: 4-level trend classification (Strong Bull/Bear, Weak Bull/Bear)
Mode Status: Shows active system (Adaptive Blend, Locked Agent, or Consensus)
Agent Performance Table: Real-time win%, confidence, and memory stats
Order Flow Metrics: Toxicity and impact indicators (when microstructure enabled)
Signal Status: Current state (Long/Short/Confirming/Waiting) with confirmation progress
Memory Panel (Configurable Position & Size):
Live Parameter Export: Alpha, beta, and weight values per agent
Adaptive Thresholds: Current VPIN sensitivity and Kyle threshold
Save Reminder: Visual indicator if parameters should be recorded
What Makes This Original
This script's originality lies in three key innovations:
1. Genuine Meta-Learning Framework:
Unlike traditional indicator mashups that simply display multiple signals, this implements authentic reinforcement learning (multi-armed bandits) to learn which detection method works best in current conditions. The Thompson Sampling implementation with beta distribution tracking (alpha for successes, beta for failures) is statistically rigorous and adapts continuously. This is not post-hoc optimization—it's real-time learning.
2. Episodic Memory Architecture with Transfer Learning:
The dual-layer memory system mimics human learning patterns:
Short-term memory captures recent performance (recency bias)
Long-term memory preserves historical patterns (experience)
Automatic transfer mechanism consolidates knowledge
Memory boost creates positive feedback loops (successful strategies become stronger)
This architecture allows the system to adapt without retraining , unlike static ML models that require batch updates.
3. Institutional Microstructure Integration:
Combines retail-focused technical analysis (RSI, Bollinger Bands, VWAP) with institutional-grade microstructure metrics (VPIN, Kyle's Lambda, Hawkes processes) typically found in academic finance literature and professional trading systems, not standard retail platforms. While simplified for Pine Script constraints, these metrics provide insight into informed vs. uninformed trading , a dimension entirely absent from traditional technical analysis.
Mashup Justification:
The four agents are combined specifically for risk diversification across failure modes:
Spoofing Detector: Prevents false breakout losses from manipulation
Exhaustion Detector: Prevents chasing extended trends into reversals
Liquidity Void: Exploits volatility compression (different regime than trending)
Mean Reversion: Provides mathematical anchoring when patterns fail
The bandit system ensures the optimal tool is automatically selected for each market situation, rather than requiring manual interpretation of conflicting signals.
Why "ML-lite"? Simplifications and Approximations
This is the "lite" version due to necessary simplifications for Pine Script execution:
1. Simplified VPIN Calculation:
Academic Implementation: True VPIN uses volume bucketing (fixed-volume bars) and tick-by-tick buy/sell classification via Lee-Ready algorithm or exchange-provided trade direction flags
This Implementation: 20-bar rolling window with simple open/close heuristic (close > open = buy volume)
Impact: May misclassify volume during ranging/choppy markets; works best in directional moves
2. Pseudo-Random Sampling:
Academic Implementation: Thompson Sampling requires true random number generation from beta distributions using inverse transform sampling or acceptance-rejection methods
This Implementation: Deterministic pseudo-randomness derived from price and volume decimal digits: (close × 100 - floor(close × 100)) + (volume % 100) / 100
Impact: Not cryptographically random; may have subtle biases in specific price ranges; provides sufficient variation for agent selection
3. Hawkes Process Approximation:
Academic Implementation: Full Hawkes process uses maximum likelihood estimation with exponential kernels: λ(t) = μ + Σ α·exp(-β(t-tᵢ)) fitted via iterative optimization
This Implementation: Simple exponential decay (0.9 multiplier) with binary event triggers (volume spike = event)
Impact: Captures self-exciting property but lacks parameter optimization; fixed decay rate may not suit all instruments
4. Kyle's Lambda Simplification:
Academic Implementation: Estimated via regression of price impact on signed order flow over multiple time intervals: Δp = λ × Δv + ε
This Implementation: Simplified ratio: price_change / sqrt(volume_sum) without proper signed order flow or regression
Impact: Provides directional indicator of impact but not true market depth measurement; no statistical confidence intervals
5. Entropy Calculation:
Academic Implementation: True Shannon entropy requires probability distribution: H(X) = -Σ p(x)·log₂(p(x)) where p(x) is probability of each price change magnitude
This Implementation: Simple ratio of unique price changes to total observations (variety measure)
Impact: Measures diversity but not true information entropy with probability weighting; less sensitive to distribution shape
6. Memory System Constraints:
Full ML Implementation: Neural networks with backpropagation, experience replay buffers (storing state-action-reward tuples), gradient descent optimization, and eligibility traces
This Implementation: Fixed-size array queues with simple averaging; no gradient-based learning, no state representation beyond raw scores
Impact: Cannot learn complex non-linear patterns; limited to linear performance tracking
7. Limited Feature Engineering:
Advanced Implementation: Dozens of engineered features, polynomial interactions (x², x³), dimensionality reduction (PCA, autoencoders), feature selection algorithms
This Implementation: Raw agent scores and basic market metrics (RSI, ATR, volume ratio); minimal transformation
Impact: May miss subtle cross-feature interactions; relies on agent-level intelligence rather than feature combinations
8. Single-Instrument Data:
Full Implementation: Multi-asset correlation analysis (sector ETFs, currency pairs, volatility indices like VIX), lead-lag relationships, risk-on/risk-off regimes
This Implementation: Only OHLCV data from displayed instrument
Impact: Cannot incorporate broader market context; vulnerable to correlated moves across assets
9. Fixed Performance Horizon:
Full Implementation: Adaptive horizon based on trade duration, volatility regime, or profit target achievement
This Implementation: Fixed 8-bar evaluation window
Impact: May evaluate too early in slow markets or too late in fast markets; one-size-fits-all approach
Performance Impact Summary:
These simplifications make the script:
✅ Faster: Executes in milliseconds vs. seconds (or minutes) for full academic implementations
✅ More Accessible: Runs on any TradingView plan without external data feeds, APIs, or compute servers
✅ More Transparent: All calculations visible in Pine Script (no black-box compiled models)
✅ Lower Resource Usage: <500 bars lookback, minimal memory footprint
⚠️ Less Precise: Approximations may reduce statistical edge by 5-15% vs. academic implementations
⚠️ Limited Scope: Cannot capture tick-level dynamics, multi-order-book interactions, or cross-asset flows
⚠️ Fixed Parameters: Some thresholds hardcoded rather than dynamically optimized
When to Upgrade to Full Implementation:
Consider professional Python/C++ versions with institutional data feeds if:
Trading with >$100K capital where precision differences materially impact returns
Operating in microsecond-competitive environments (HFT, market making)
Requiring regulatory-grade audit trails and reproducibility
Backtesting with tick-level precision for strategy validation
Need true real-time adaptation with neural network-based learning
For retail swing/day trading and position management, these approximations provide sufficient signal quality while maintaining usability, transparency, and accessibility. The core logic—multi-agent detection with adaptive selection—remains intact.
Technical Notes
All calculations use standard Pine Script built-in functions ( ta.ema, ta.atr, ta.rsi, ta.bb, ta.sma, ta.stdev, ta.vwap )
VPIN and Kyle's Lambda use simplified formulas optimized for OHLCV data (see "Lite" section above)
Thompson Sampling uses pseudo-random noise from price/volume decimal digits for beta distribution sampling
No repainting: All calculations use confirmed bar data (no forward-looking)
Maximum lookback: 500 bars (set via max_bars_back parameter)
Performance evaluation: 8-bar forward-looking window for reward calculation (clearly disclosed)
Confidence threshold: Minimum 0.25 (25%) enforced on all signals
Memory arrays: Dynamic sizing with FIFO queue management
Limitations and Disclaimers
Not Predictive: This indicator identifies patterns in historical data. It cannot predict future price movements with certainty.
Requires Human Judgment: Signals are entry triggers, not complete trading strategies. Must be confirmed with your own analysis, risk management rules, and market context.
Learning Period Required: The adaptive system requires 50-100 bars minimum to build statistically meaningful performance data for bandit algorithms.
Overfitting Risk: Restoring memory parameters from one market regime to a drastically different regime (e.g., low volatility to high volatility) may cause poor initial performance until system re-adapts.
Approximation Limitations: Simplified calculations (see "Lite" section) may underperform academic implementations by 5-15% in highly efficient markets.
No Guarantee of Profit: Past performance, whether backtested or live-traded, does not guarantee future performance. All trading involves risk of loss.
Forward-Looking Bias: Performance evaluation uses 8-bar forward window—this creates slight look-ahead for learning (though not for signals). Real-time performance may differ from indicator's internal statistics.
Single-Instrument Limitation: Does not account for correlations with related assets or broader market regime changes.
Recommended Settings
Timeframe: 15-minute to 4-hour charts (sufficient volatility for ATR-based stops; adequate bar volume for learning)
Assets: Liquid instruments with >100k daily volume (forex majors, large-cap stocks, BTC/ETH, major indices)
Not Recommended: Illiquid small-caps, penny stocks, low-volume altcoins (microstructure metrics unreliable)
Complementary Tools: Volume profile, order book depth, market breadth indicators, fundamental catalysts
Position Sizing: Risk no more than 1-2% of capital per signal using ATR-based stop-loss
Signal Filtering: Consider external confluence (support/resistance, trendlines, round numbers, session opens)
Start With: Balanced mode, Thompson Sampling, Blend mode, default agent sensitivities (1.0)
After 30+ Signals: Review agent win rates, consider increasing sensitivity of top performers or locking to dominant agent
Alert Configuration
The script includes built-in alert conditions:
Long Signal: Fires when validated long entry confirmed
Short Signal: Fires when validated short entry confirmed
Alerts fire once per bar (after confirmation requirements met)
Set alert to "Once Per Bar Close" for reliability
Taking you to school. — Dskyz, Trade with insight. Trade with anticipation.
