[NG] Indicator - Altcoin Alpha - v1(Created for Client)
Alpha (Unique price action of asset) indicator for ALTcoins implementation, taking `BINANCE:BTCUSDT` as the market reference. Can be improved by adding more BTC charts from more sources, so as to get a unified chart of BTC for market representation.
Set `alpha period` to a value, wherein you want to see the unique price action of the asset. For short term trend, a value of 24 is good for `1H` charts (1 day), and value of 168 is good for long term trends on `1H` charts (1 week trend).
Corresponding values of `beta period` should be `168` (1 week for 1 day alpha) and `720` (1 month for 1 week alpha period).
You can set `alpha` and `beta` period as per your requirements.
Regards,
在腳本中搜尋"油价调整最新消息:国内油价今日24时上调多少"


RSI3graf. 3 RSI in one window[wozdux] Three RSI indicator charts in one window. Plus, the resale area (green) and overbought area ( red) are highlighted. Indicator settings are periods of calculation of the RSI indicator (24, 14, 9). The fourth parameter (30) is the critical levels, which are at a distance of 30 units from the edges. If the parameter is 30, then the oversold level is 30 and the overbought level is 70 (100-30).

[f(x)] Bollinger Donchian RemixThis is my version of a mixture of Bollinger and Donchian (BB/DC Remix)
It is a modified fork of Dolchian/Bollinger Hybrid by Ricardo Santos ( DBH.V0)
this is the two pictures comparing it.
Made this Fork because Santos' code starts getting chopping with my type of settings.
His time input is 24, but mine varies between 13 and 21.
You really notice in scalping and sometimes intraday timeframes with my settings.
His also differ from mine based on the trendline, where he modifies his Simple Moving Average, which is default color is black, and I use the the default one, which the default color is red.
Also you can change the trendline type input (open,close,hl2,etc...) to tailor your preference.
Note: Default is close, Santos use hl2, I use ohlc4.

RSI Oversold bounce - Scaling in levels (30, 28, 26, 24, 22, 20)Oversold bounce entry levels based on RSI
Helps to gauge levels for scaling into a position based on oversold rsi levels.

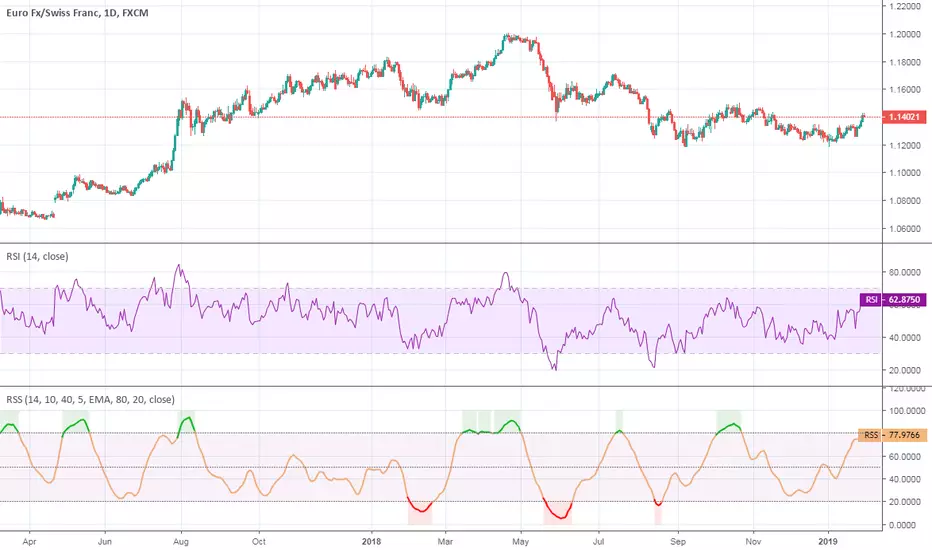
Relative Spread StrengthRelative Spread Strength indicator script. This indicator was originally developed by Ian Copsey (Stocks & Commodities V. 24:10 (16-23): Forex Focus).
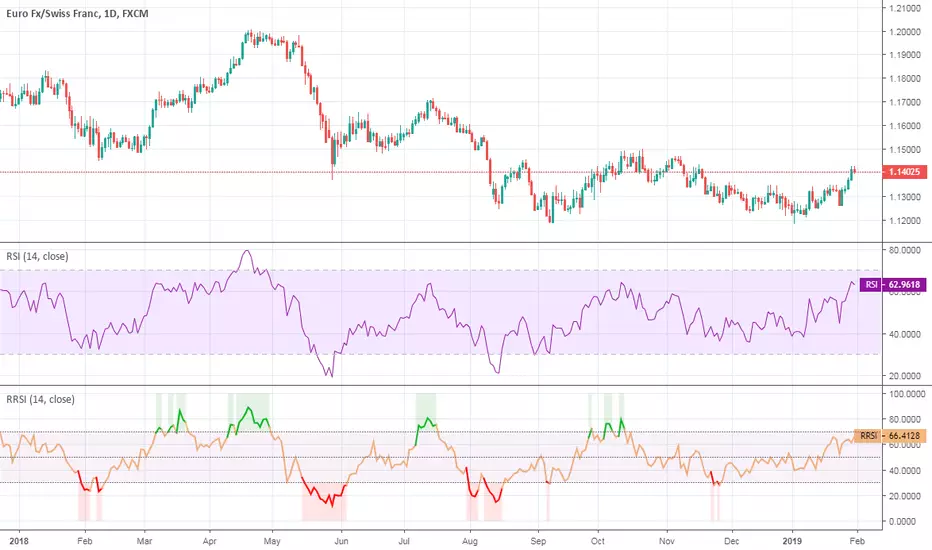
Rapid RSIRapid RSI indicator script. This indicator was originally developed by Ian Copsey (Stocks & Commodities V. 24:10 (16-23): Forex Focus).
TSP Ichimoku Clouds x2 MTFDouble Ichimoku
Use a Multiple of current time frame :
15m * 4 = 1h
1h*24 = 1d

Highlight the weekendsA number of times I've heard people say that the market drops on the weekends.
Being that cryptocurrencies are a 24/7 market I thought it would be interesting to see what candle movements happen on the weekends.
This is a very simple script that highlights the candles that are on Saturday and Sunday.

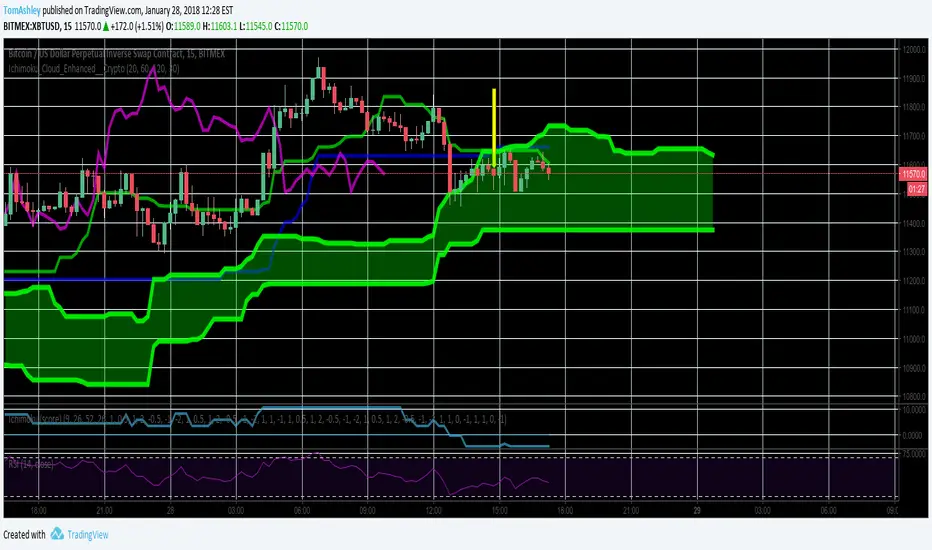
Ichimoku Cloud Enhanced For CryptoIntervals have been changed to account for a 24/7 cryptocurrency trading period. Values were then doubled so that the trader can avoid fakeout breakouts/traps. This leads to a bit less signals but rather, more sure signals instead. Very useful and more safe, even in smaller timeframes. Colors were set to the standard and breakout arrows are now enabled by default.
ACD For Trading View 1.1This is a modification of ACD for Trading View created by pengkwai.
It is based on Mark Fisher's ACD Method. The old version had some clunky old instructions and extra code that I have removed and made easier to modify.
You can change the trading duration of whatever security you are trading -- default is 24 hours, works fine for Forex and Crypto. For other things then just set accordingly.

DEMA Double Exponential Moving Average Strategy@Moneros 2017
Based on The DEMA is a fast-acting moving average that is more responsive to market changes than a traditional moving average
en.wikipedia.org
!!!! IN ORDER TO AVOID REPAITING ISSUES !!!!
!!!! DO NOT VIEW IN LOWER RESOLUTIONS THAN res/2 PARAMETER !!!!
for example res = 120 view >= 60m res = 60 view >= 30m
the length of the DEMA sampling shouldn't be longer than a candle
Best profits tested on BTCUSD
res = 105 slowPeriod = 2 fastPeriod = 32
res = 125 slowPeriod = 3 fastPeriod = 21
res = 120 slowPeriod = 2 fastPeriod = 32
res = 130 slowPeriod = 1 fastPeriod = 24
res = 40 slowPeriod = 4 fastPeriod = 93
res = 60 slowPeriod = 1 fastPeriod = 67
BTCUSD

Renko Bar Time by JustUncleLThis indicator in designed to be used with Renko and other price only bars (ie Kagi, LineBreak, Point&Figure) and shows the number of minutes a bar was open before it was confirmed and printed.
NOTE: It will only work on currencies and symbols that are in the 24/5 market, it does account for weekend market close time but does not account for any Forex market holiday close times.
HINTS:
When the BAR TIME is long and the Renko Bricks have wicks, this is an indication of consolidation.
When the BAR TIME is short and the Renko Bricks have no wicks, this is an indication of acceleration.

Free Strategy #08 (Combo of #01 and #02) (ES / SPY)This strategy was designed to be traded on daily data on the ES and SPY—the strategy was originally developed for NinjaTrader, which displays daily ES data based on RTH hours instead of 24 hours (1440 minute) like TradingView does, so we are presenting the results on the SPY until we figure out how to overcome this hurdle.
The strategy combines the two ideas from strategy #01 and strategy #02 .
Strategy #08
Quantity 100
Slippage: 2 ticks
Commission: 4.95 per order
Net Profit: 26,044.60
Max Drawdown: 3,947.60
Buy and Hold (Custom)
Quantity 100
Slippage: 2 ticks
Commission: 4.95 per order
Entry Long: 1993-02-01 @ 43.99
Exit Long: 2017-07-28 @ 246.34
Net Profit: 20,225.10
Max Drawdown: 9,042.00

Free Strategy #02 (ES / SPY)This strategy was designed to be traded on daily data on the ES and SPY—the strategy was originally developed for NinjaTrader, which displays daily ES data based on RTH hours instead of 24 hours (1440 minute) like TradingView does, so we are presenting the results on the SPY until we figure out how to overcome this hurdle.
Strategy #02
Quantity 100
Slippage: 2 ticks
Commission: 4.95 per order
Net Profit: 10,118.30
Max Drawdown: 4.037.60
Buy and Hold (Custom)
Quantity 100
Slippage: 2 ticks
Commission: 4.95 per order
Entry Long: 1993-02-01 @ 43.99
Exit Long: 2017-07-28 @ 246.34
Net Profit: 20,225.10
Max Drawdown: 9,042.00

BestMA v1.0My new indicator "BestMA 1.0" (or "BMA"). He is pleasant to me more any other *MA-indicator.
Idea
"BMA" uses 2 different SMA:
1) SMA Open (red color)
2) SMA Close (blue color)
It is long at both SMA identical it (is so very necessary). The user sets length in settings. Therefore they are always very close.
If SMA Open is higher than SMA Close, means bars now is more often falling (close < open), but not growing is downtrend.
If SMA Open is lower than SMA Close, means bars now is more often growing (close > open), but not falling is uptrend.
Background:
Lime color of a background = uptrend
Red color of a background = downtrend
Plots:
Red plot = SMA Open
Blue plot = SMA Close
Arrows:
Red arrows = new trend!
Black arrows = price too high or too low
The recommended TimeFrames:
1W, 1D, 4H, 1H
The recommended parameters:
For 1W and 1D length = 30
For 4H and 1H length = 24

4X Global Trend SignalNOTE: This is an invite-only script for paying 4X Global Members.
When you request access, please provide your 4X Global username. I cannot provide access until I cross-check your 4X Global account to verify that you have one and that it is active.
If you are not a 4X Global member and want access; a 4X Global Membership is only $19 per month. You can read more: Click Here
I had 4X Global code this indicator based on several of their tools. This indicator is a combination of several 4X Global data sources. When all of the sources confirm a trend (based on my criteria), the indicator draws a 'buy' or 'sell' label on the chart. This is a very simple indicator to use and it's darn accurate. I may automate it at some point.
This indicator does NOT repaint, but it will flash on/off during the current bar until it closes. Do NOT enter a trade until the current bar closes with a signal. You enter at the open of the succeeding candle (i.e. the candle immediately after the signal candle).
There is only one variable to adjust; 'Risk'. When you increase the Risk variable, you are increasing your trading risk because the indicator will not respond as fast. However, I have found that higher settings filter out the noise better.
For me, the sweet spot seems to be on the 30 minute chart with a Risk value of '24'. If you find additional 'sweet spots' for this indicator, please share them with your fellow 4X Global members.
Please direct any/all support question to me. I will do my best to answer them.
This is not investment advice, just my opinion(s). Please trade accordingly.
Trade safe and keep an eye on news.

CCI 0Trend Strategy (by Marcoweb) v1.0Hi guys,
I am trying to create a strategy that consists in the crossover/under of the 0 line of the Commodity Channel Index . Every time the price crosses over the 0 line in the CCI the strategy has to long getting short on the cross under and viceversa.
I have published here another script strategy (consists in a crossover/under of the Overbought/Oversold levels of the CCI) that works so I could have the opportunity to share with you the main idea that as per now is mistaken:
//@version=2
strategy(title="CCI 0Trend Strategy (by Marcoweb) v1.0", shorttitle="CCI_0T_Stra_v1.0", overlay=true)
///////////// CCI
length = input(20, minval=1)
src = input(close, title="Source")
ma = sma(src, length)
cci = (src - ma) / (0.015 * dev(src, length))
plot(cci, color=black)
band1 = hline(100, color=blue, linestyle=solid)
band0 = hline(-100, color=red, linestyle=solid)
bandl = hline(0, color=orange, linestyle=solid)
fill(band1, band0, color=olive)
p1 = plot(band0, color=red,title="-100")
p2 = plot(band1, color=blue,title="100")
p3 = plot(bandl, color=orange,title="0")
///////////// CCI 0Trend Strategy (by Marcoweb) v1.0 Strategy
if (not na(cci))
if (crossover(cci, bandl)
strategy.entry("CCI_L", strategy.long, stop=bandl, oca_type=strategy.oca.cancel, comment="CCI_L")
else
strategy.cancel(id="CCI_L")
if (crossunder(cci, bandl)
strategy.entry("CCI_S", strategy.short, stop=bandl, oca_type=strategy.oca.cancel, comment="CCI_S")
else
strategy.cancel(id="CCI_S")
//plot(strategy.equity, title="equity", color=red, linewidth=2, style=areabr)
With this coding I get the error : line 24 (if (crossover(cci, bandl): mismatched input '|E|' expecting RPAR
Hope you like the idea ;)

Forex session - Opening Range- Jayy fixed updatedOpening Range (OR) for Forex 24 hour regular session. This is not for regular market day sessions addressed in a separate script.
This script fixes four issues:
syntax error when code compiles
messed up opening range the day after a holiday Monday
flaky plotting of the opening range and targets that required page reloading
TradingView problems with starting forex session at 1700 hours EST/EDT when using certain securities eg FX_IDC currently (Jan 2017)
Additions in his code are more options for trading range
Time compensation option for some securities that incorrectly start sessions at 1200 hrs instead of 1700 hrs NY time
- this glitch is likely temporary but present when this script update was created
More opening range time period choices
Opening Range Targets:
Opening Range Targets as per Leaf_West
Targets are set at 127% , 162%, 200 %, 262 %, 362%, 423%, 685%, 1109% and 1794% and this can be traded intraday using methods described here charts-by-leaf.com I also have some Leaf West PDFs that describe how the targets are set and how they are traded. There are others that use opening range.
The Time Session Glitch and the Fix:
The script will correctly default to 1700 hrs to 1700hrs EDT/EST session for FXCM.
Strangely some securities appear to erroneously start their session at 1200 hrs ie. My guess is that they are somehow tied to GMT+0 instead of New York time (GMT+5). See this for yourself by selecting EURUSD using the FXCM exchange (FX:EURUSD) and then EURUSD from the IDC exchange (FX_IDC:EURUSD). The FX-IDC session opening range starts 5 hours
before it actually should at 1700 hrs EDT/EST. To correct for this I have implemented an automatic fix (default) and a user selected "5 hour time shift adjust. ment needed on some securities".
There is also a 4 hour time shift button which might be necessary when New York reverts from Eastern Standard Time
to Eastern Daylight Time (1 hour difference) in March (and then back again in November). In the default auto adjust mode you will need to select the 1 hour time shift. That is if this glitch still exists at that time.
I have looked at other scripts, other than my own and where the script is available, that need to use information about the opening bar and all have the same time shift issue
What are the choices for Opening Range?
The dialogue box offers the standard TradingView options.
Also where you see Pick Opening Range 1 to 12 hours , SET TO 0 To USE LINE ABOVE TO DETERMINE OR LENGTH
As the note says a number other than 0 will override the standard options from the line above
The dialogue box below in offers choices by hours 1 to 12. A number greater than 12 will still only give
720 minutes (12 hours) for the length of Opening Range.
What sessions within the FOREX time-frame are available?
The default is 1700 hours to 1700 hours EST/EDT
Check any one (only one) of the time periods to change the opening range period to suit.
New York opens at 8:00 am to 5:00 pm EST (EDT)
Tokyo opens at 7:00 pm to 4:00 am EST (EDT)
Sydney opens at 5:00 pm to 2:00 am EST (EDT)
London opens at 3:00 am to 12:00 noon EST (EDT)
There is a build your own session (click the button to select)
The two lines for inputting session times are almost identical except that the second line starts the be the same as each other.
The default for the build your own session is 2200 hours to 2200 hours. As of the time of publishing this plots EURUSD FX-IDC just right. The GMT+5 and GMT+4 do not apply to this selection.
See my comments above on this strange aberration.
The script originated from work done by Chris Moody. It has changed significantly but there are remnants of that script lurking within.
Script is free to all - that way you can see what is inside
Cheers Jayy

VWAP forex Yesterday Hi/Low update fix This script is an updte fix of an earlier script that stopped functioning when TradingView updated Pine script. This script plots Forex (24 hour session) VWAP, yesterday's high, low, open and close (HLOC),
the day before's HLOC -
Also plots higher timeframe 20 emas
1 minute 5, 15, 60 period 20 ema
5 minute 15, 60 period 20 ema
15 minute 60, 120 , 240 period 20 ema
60 minute 120, 240 period 20 ema
120 minute 240, D period 20 ema
240 minute D period 20 ema
Also signals inside bars (high is less than or equal to the previous bar's high and the low is greater than or equal to the previous low) the : true inside bars have a maroon triangle below the bar as well as a ">" above the bar.
If subsequest bars are inside the last bar before the last true inside bar they also are marked with an ">"
This is probably a slight variation from the way Leaf_West plots the inside bars.
It appears that he marks all bars that are inside the original bar until one a bar has a high or low
outside the original bar. But I would need to see an example on his charts.
The Time Session Glitch and the Fix FX_IDC, COINBASE and BITSTAMP:
The script will correctly default to 1700 hrs to 1700hrs EDT/EST session for FXCM.
Strangely some securities appear to erroneously start their session at 1200 hrs ie. My guess is that they are somehow tied to GMT+0 instead of New York time (GMT+5). See this for yourself by selecting EURUSD using the FXCM exchange (FX:EURUSD) and then EURUSD from the IDC exchange (FX_IDC:EURUSD). The FX-IDC session opening range starts 5 hours before it actually should at 1700 hrs EDT/EST. To correct for this I have implemented an automatic fix (default) and a user selected "5 hour time shift adjust. ment needed on some securities".
There is also a 4 hour time shift button which might be necessary when New York reverts from Eastern Standard Time to Eastern Daylight Time (1 hour difference) in March (and then back again in November). In the default auto adjust mode you will need to select the 1 hour time shift. That is if this glitch still exists at that time.
I have looked at other scripts, other than my own and where the script is available, that need to use information about the opening bar and all have the same time shift issue
COINBASE and BITSTAMP open at 0000 hours GMT. Since I use lines instead of circles or crosses I had to make a small adjustment to plot the lines correctly.
If it needs work let me know.
Jayy