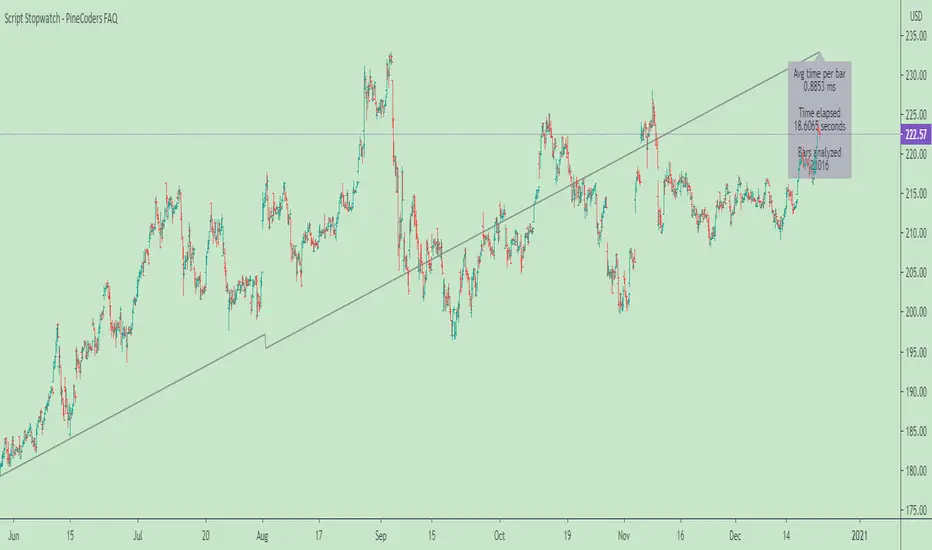
Script Stopwatch - PineCoders FAQ█ WARNING
The publication of our LibraryStopwatch has deprecated this publication.
█ ORIGINAL DESCRIPTION
This script calculates the run time of a Pine script. While its numbers are not very precise and it doesn’t work on all scripts, it will help developers calculate run times more precisely than by hand, and so provides Pine coders with an additional profiling tool to help them optimize their code.
How to use the code
• Place the code included between the up/down arrows after your script’s input() calls.
• Comment out the display modes you don’t want to use.
• Save your script, wait and look at the results.
• Results show in different colors, depending on the average time per bar:
- green for < 5 ms
- dark red for < 50 ms
- bright red for > 50 ms (the maximum allowed is 200).
How the code works
The code in this script starts by saving the value of the timenow variable on the first bar. While the time variable returns the time at the beginning of the bar, timenow returns the current time. The code then follows the progression of timenow during the script’s execution. The variable only updates every second, so in between updates the script makes an estimate of the total time elapsed by adding the last average time per bar calculated to each bar that passes until timenow increases by another 1000 because one more second has elapsed since its last update. At that point a new, current average time per bar is calculated and the cycle repeats.
The code only calculates elapsed time for the initial run. Once the realtime bar is hit, timing stops so that time spent in the realtime bar does not affect the numbers once they have been calculated on the script’s initial pass over the dataset.
Notes
• If results show zero elapsed time, it’s most probably because your script executes in less than one second, which is very good. In that case timenow hasn’t changed, so no timing can be calculated.
• The code is quirky and doesn’t work on all scripts.
• It doesn’t properly time execution of security() calls.
• The average time per bar will sometimes vary quite a bit with changes in chart resolution.
Look first. Then leap.
在腳本中搜尋"涨幅大于1000的股票"
Mix1 : Ema Cross + Trend Channel [Gu5]Based on Trend Channel
Ema-crossover is added
Crossing alerts, only on trend
Basado en mi anterior indicador, Trend Channel
Se agrega Cruce de Medias Moviles (Ema-crossover)
Las alertas solo son en favor a la tendencia
El valor de SMA Range es arbitrario (No Backtesting). Cambia la amplitud de canal que determina cuando es rango (barras amarillas por estar muy cerca del SMA200, sin tendencia definida)
Range Multiplier adapta el indicador a distintos mercados
//Setting recommended for SMA Range
//BTCUSD = 100
//EURUSD = 1000
//SPX = 100
//ETHUSD = 10
Si te fue útil este indicador, puedes comprarme una cerveza ;)
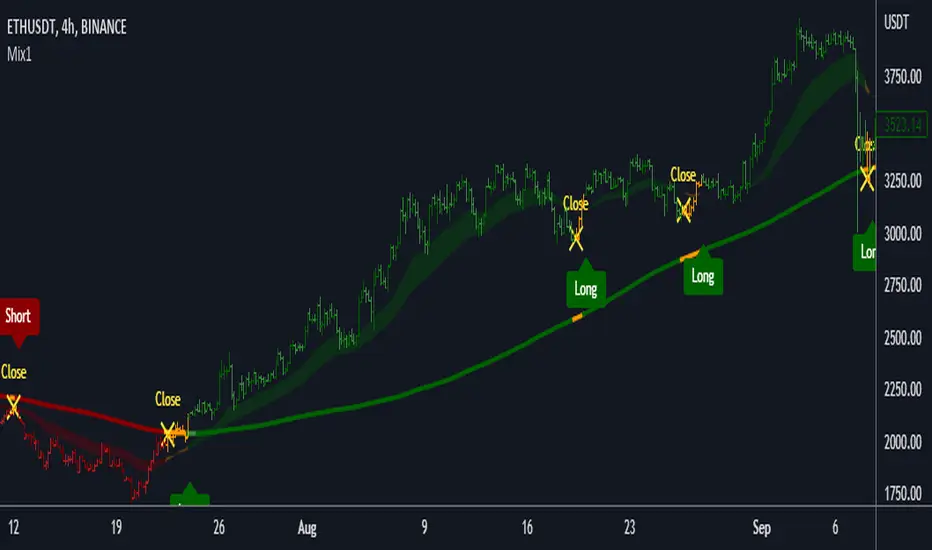
Trend Channel [Gu5]SMA 200 determines the trend
Bullish trend, green candles. Down trend, red candles.
If the market value is narrow to the SMA200 channel, yellow candles.
Setting recommended for SMA Range
BTCUSD = 100
EURUSD = 1000
SPX = 100
ETHUSD = 10

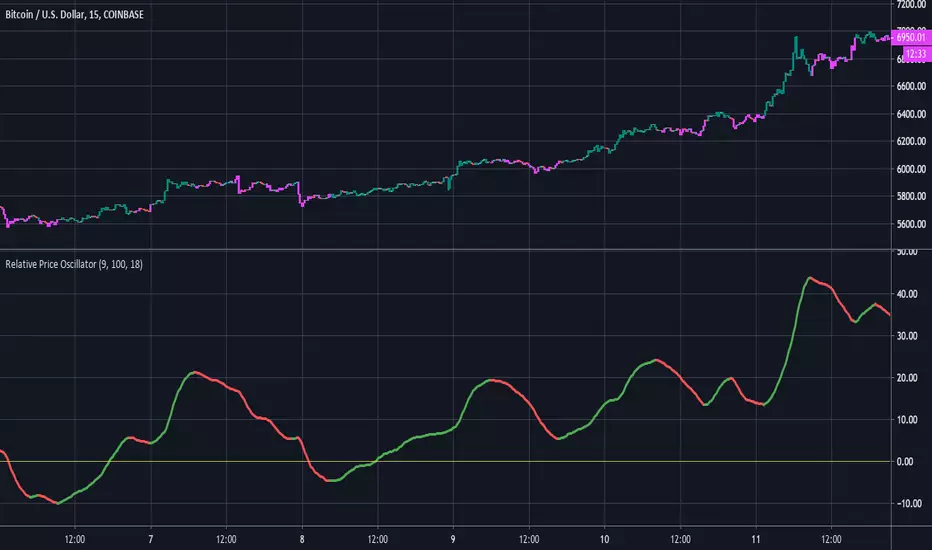
Relative Price OscillatorHere is a new experimental indicator we've been working on. The idea was to compare two EMA's of period midpoints to the actual closing price. The steps that were taken are listed below:
1.Calculate an EMA based on each period's midpoint ((High * Low) /2) for the last 9 periods.
2.Calculate an EMA based on each period's midpoint for the last 100 periods.
3. Divide the difference of the two EMA's by the closing price. ((EMA1 - EMA2) / Close).
4. Smooth the value from step #3 with an 18 period EMA. Multiply by 1000 for better scaling/visibility.
Using:
Bullish when line is green, bearish when line is red. Buy on first green, then sell on first red.
There is also an option to color the candles based on the RPO line.
Multi Horizontal Lines 540Draws horizontal lines depends on condition of regular price, if 10000 then increment is 540, otherwise increment by 54

Multi Bar OHLC Compare Panel (Floating Grid)Multi Bar OHLC Compare Panel by RagingRocketBull 2019
version 1.0
This indicator lets you compare OHLCV values from several specified bars. Bars can be dynamic/persistent.
You can also use it as an alternate OHLC panel if you don't like small font of the native TradingView panel.
It uses Pinescript v4 to output data dynamically as string labels in a horiz/vertical grid.
Features:
- Floating Panel with customizable horiz/vertical layout and grid spacing
- Support for up to 5 OHLC bars (highlighted with markers)
- Outputs Bar #/index, OHLCV, Bar Change Value/%, Exchange/Ticker, Timeframe, Timestamp strings
- Dynamic (fixed offset)/Persistent bars (fixed time)
- Show/Hide parts of strings
- Full output string customization, including text size, date/time format and delimiters
- 2 Anchor points for panel offset: cur bar high or range high
- Bar Change can change color
Usage:
- specify at least 1 bar index as OHLC source
- select anchor point to position the panel
- select horiz/vertical grid layout
- adjust horiz/vertical spacing
- customize output strings as needed
Notes:
- this indicator uses Pinescript v3 Compatibity Framework
- both bars 1,2 are required for log scale adjustment to work
- you can't attach the panel to screen's top/bottom and must use offset/anchor because, unlike plotshape, string labels don't support yloc=yloc.top/bottom, only yloc.above/belowbar
- you can't precisely align strings in a grid because there's no label.get_width/height to calculate mid/left points, only get_x/y/text. Alignment will break depending on string length, zoom and change color option on/off
- bar change is rendered as a separate label when change color is enabled (2 panels total) and merged into the main panel when disabled (single panel)
- you can't change the order of strings as playing with the natural order of things isn't the best of ideas
- you can modify the script to compare up to 50 OHLC bars, but do you need that much power? Of course, you do.
- you can't set color/style for string labels in Style UI, so a few extra settings were added.
- bar index is limited to 5000 for free accounts (10000 for paid), will show an error when exceeded, also when it exceeds the total number of bars in history
- in persistent bars mode all bars with index > 0 are considered persistent, bar 0 always remains a dynamic bar
- persistent bars' offset is reset: in replay mode on exit or when price reaches cur bar, or when panel layout is changed from h to v in both replay/realtime modes
- initial pos of each persistent bar relative to the first realtime bar anchor doesn't change during session - new persistent bars introduced during session are attached to the most recent cur bar anchor
P.S. Everything is proceeding as I have foreseen

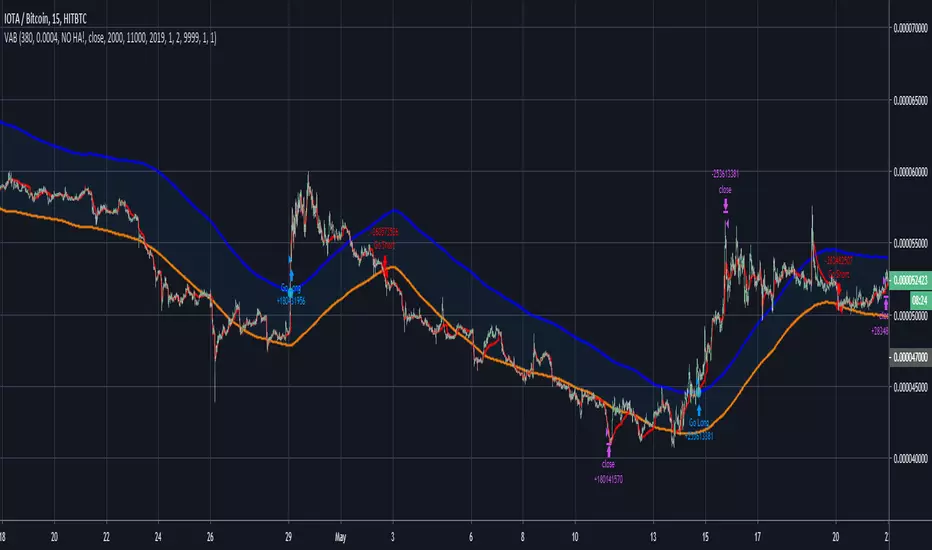
[XC] Adaptive strategy with volume bandsFirst much thanks to alexgrover for his rich source of unbelievable indicators
The list below shows as an example some might profitable strategy settings.
But like every new strategy only a long term test can tell you if it works.
//Curency - - src Time stategy Length C. Factor Smoothed SL TP Profit Factor (with no Commission)
//---------------------------------------------------------------------------------------------------------------------------------
//BTCUSD NOHA close 15min 1 240 10 yes 3000 25000 4.2 (June 2019)
//XBTUSD NOHA close 15min 1 310 0.00006 no 1000 11000 2.3 (June 2019)
//IOTABTC NOHA close 15min 1 380 0.0004 no 2000 11000 10.6 (June 2019)
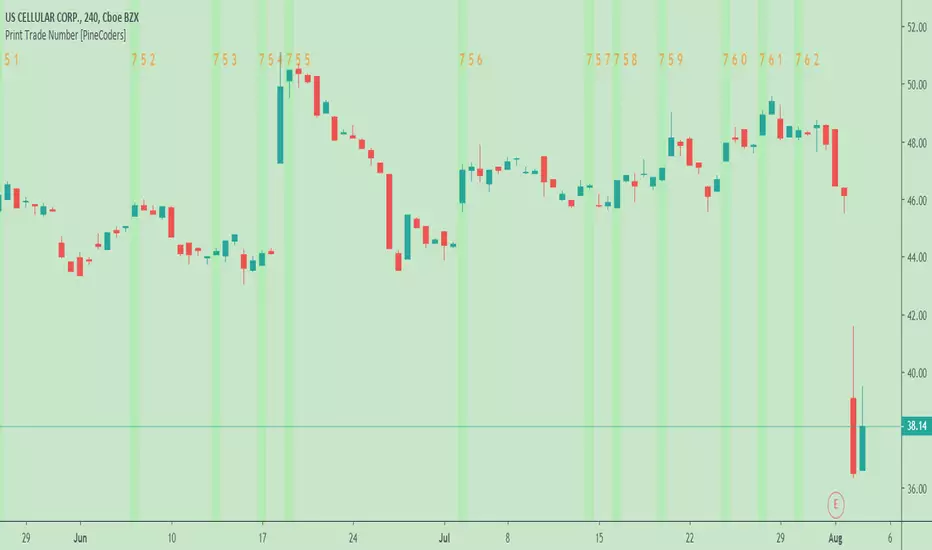
Print Trade Number - PineCoders FAQThis script prints a trade number <1000 on the chart. It requires at least 3 bars between successive entries.
Look first. Then leap.
Volume Profile Free Pro (25 Levels Value Area VWAP) by RRBVolume Profile Free Pro by RagingRocketBull 2019
Version 1.0
All available Volume Profile Free Pro versions are listed below (They are very similar and I don't want to publish them as separate indicators):
ver 1.0: style columns implementation
ver 2.0: style histogram implementation
ver 3.0: style line implementation
This indicator calculates Volume Profile for a given range and shows it as a histogram consisting of 25 horizontal bars.
It can also show Point of Control (POC), Developing POC, Value Area/VWAP StdDev High/Low as dynamically moving levels.
Free accounts can't access Standard TradingView Volume Profile, hence this indicator.
There are 3 basic methods to calculate the Value Area for a session.
- original method developed by Steidlmayr (calculated around POC)
- classical method using StdDev (calculated around the mean VWAP)
- another method based on the mean absolute deviation (calculated around the median)
POC is a high volume node and can be used as support/resistance. But when far from the day's average price it may not be as good a trend filter as the other methods.
The 80% Rule: When the market opens above/below the Value Area and then returns/stays back inside for 2 consecutive 30min periods it has 80% chance of filling VA (like a gap).
There are several versions: Free, Free Pro, Free MAX. This is the Free Pro version. The Differences are listed below:
- Free: 30 levels, Buy/Sell/Total Volume Profile views, POC
- Free Pro: 25 levels, +Developing POC, Value Area/VWAP High/Low Levels, Above/Below Area Dimming
- Free MAX: 50 levels, packed to the limit
Features:
- Volume Profile with up to 25 levels (3 implementations)
- POC, Developing POC Levels
- Buy/Sell/Total/Side by Side View modes
- Side Cover
- Value Area, VAH/VAL dynamic levels
- VWAP High/Low dynamic levels with Source, Length, StdDev as params
- Show/Hide all levels
- Dim Non Value Area Zones
- Custom Range with Highlighting
- 3 Anchor points for Volume Profile
- Flip Levels Horizontally
- Adjustable width, offset and spacing of levels
- Custom Color for POC/VA/VWAP levels and Transparency for buy/sell levels
Usage:
- specify max_level/min_level for a range (required in ver 1.0/2.0, auto/optional in ver 3.0 = set to highest/lowest)
- select range (start_bar, range length), confirm with range highlighting
- select mode Value Area or VWAP to show corresponding levels.
- flip/select anchor point to position the buy/sell levels, adjust width and spacing as needed
- select Buy/Sell/Total/Side by Side view mode
- use POC/Developing POC/VA/VWAP High/Low as S/R levels. Usually daily values from 1-3 days back are used as levels for the current day.
- Green - buy volume of a specific price level in a range, Red - sell volume. Green + Red = Total volume of a price level in a range
There's no native support for vertical histograms in Pinescript (with price axis as base)
Basically, there are 4 ways to plot a series of horizontal bars stacked on top of each other:
1. plotshape style labeldown (ver 0 prototype discarded)
- you can have a set of fixed width/height text labels consisting of a series of underscores and moving dynamically as levels. Level offset controls visible length.
- you can move levels and scale the base width of the volume profile histogram dynamically
- you can calculate the highest/lowest range values automatically. max_level/min_level inputs are optional
- you can't fill the gaps between levels/adjust/extend width, height - this results in a half baked volume profile and looks ugly
- fixed text level height doesn't adjust and looks bad on a log scale
- fixed font width also doesn't scale and can't be properly aligned with bars when zooming
2. plot style columns + hist_base (ver 1.0)
- you can plot long horizontal bars using a series of small adjacent vertical columns with level offsets controlling visible length.
- you can't hide/move levels of the volume profile histogram dynamically on each bar, they must be plotted at all times regardless - you can't delete the history of a plot.
- you can't scale the base width of the volume profile histogram dynamically, can't set show_last from input, must use a preset fixed width for each level
- hist_base can only be a static const expression, can't be assigned highest/lowest range values automatically - you have to specify max_level/min_level manually from input
- you can't control spacing between columns - there's an equalizer bar effect when you zoom in, and solid bars when you zoom out
- using hist_base for levels results in ugly load/redraw times - give it 3-5 sec to finalize its shape after each UI param change
- level top can be properly aligned with another level's bottom producing a clean good looking histogram
- columns are properly aligned with bars automatically
3. plot style histogram + hist_base (ver 2.0)
- you can plot long horizontal bars using a series of small vertical bars (horizontal histogram) instead of columns.
- you can control the width of each histogram bar comprising a level (spacing/horiz density). Large enough width will cause bar overlapping and give level a "solid" look regardless of zoom
- you can only set width <= 4 in UI Style - custom textbox input is provided for larger values. You can set width and plot transparency from input
- this method still uses hist_base and inherits other limitations of ver 2.0
4. plot style lines (ver 3.0)
- you can also plot long horizontal bars using lines with level offsets controlling visible length.
- lines don't need hist_base - fast and smooth redraw times
- you can calculate the highest/lowest range values automatically. max_level/min_level inputs are optional
- level top can't be properly aligned with another level's bottom and have a proper spacing because line width uses its own units and doesn't scale
- fixed line width of a level (vertical thickness) doesn't scale and looks bad on log (level overlapping)
- you can only set width <= 4 in UI Style, a custom textbox input is provided for larger values. You can set width and plot transparency from input
Notes:
- hist_base for levels results in ugly load/redraw times - give it 3-5 sec to finalize its shape after each UI param change
- indicator is slow on TFs with long history 10000+ bars
- Volume Profile/Value Area are calculated for a given range and updated on each bar. Each level has a fixed width. Offsets control visible level parts. Side Cover hides the invisible parts.
- Custom Color for POC/VA/VWAP levels - UI Style color/transparency can only change shape's color and doesn't affect textcolor, hence this additional option
- Custom Widh for levels - UI Style supports only width <= 4, hence this additional option
- POC is visible in both modes. In VWAP mode Developing POC becomes VWAP, VA High and Low => VWAP High and Low correspondingly to minimize the number of plot outputs
- You can't change buy/sell level colors (only plot transparency) - this requires 2x plot outputs exceeding max 64 limit. That's why 2 additional plots are used to dim the non Value Area zones
- Use Side by Side view to compare buy and sell volumes between each other: base width = max(total_buy_vol, total_sell_vol)
- All buy/sell volume lengths are calculated as % of a fixed base width = 100 bars (100%). You can't set show_last from input
- Sell Offset is calculated relative to Buy Offset to stack/extend sell on top of buy. Buy Offset = Zero - Buy Length. Sell Offset = Buy Offset - Sell Length = Zero - Buy Length - Sell Length
- If you see "loop too long error" - change some values in UI and it will recalculate - no need to refresh the chart
- There's no such thing as buy/sell volume, there's just volume, but for the purposes of the Volume Profile method, assume: bull candle = buy volume, bear candle = sell volume
- Volume Profile Range is limited to 5000 bars for free accounts
P.S. Cantaloupia Will be Free!
Links on Volume Profile and Value Area calculation and usage:
www.tradingview.com
stockcharts.com
onlinelibrary.wiley.com

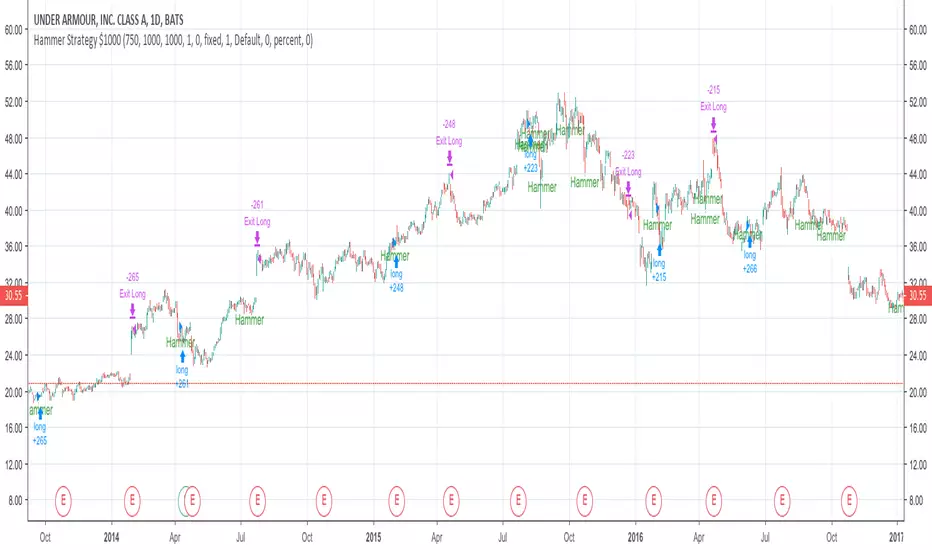
Basic Hammer StrategyThis is a basic strategy that will buy after a hammer is printed, and sell when a predetermined risk or reward price is hit. You can change the risk and reward values in the settings. Risk and reward values are in increments of $0.01. Default values are 75 ($0.75) and 200 ($2.00). If the strategy is producing losses, try adding a zero to the end of the risk value and the reward value. Example: Higher valued stocks may do better with a Risk of 750 ($7.50) and a Reward of 2000 ($20.00). Maybe even a Risk of 750 ($7.50) and reward of 1000 ($10.00). Play around with these values to get the best result for different charts. Initial investment is set to $1000
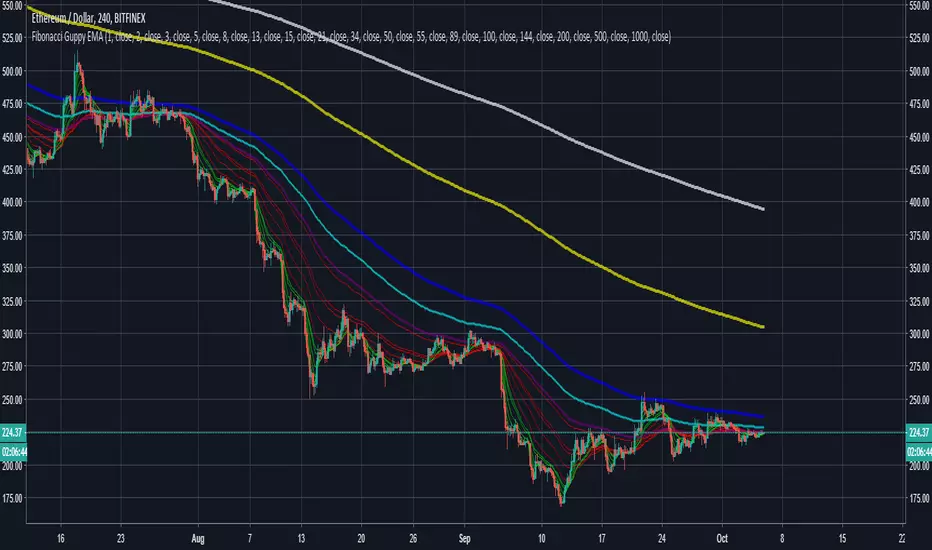
Fibonacci Guppy EMAGuppy EMA that uses fibonacci numbers instead of standard guppy numbers.
EMA's used: 1, 2, 3, 5, 8, 13, 15, 21, 34, (50), 55, 89, (100), 144, (200), (500), (1000)
MY_NL no OVThis is the same as "MY_DXY corrected price" script, Price is divided by 1000 instead of 100, and not in overlay mode. St. calls it NL, I call it "price in the 'DXY currency'"

BTCSHORT'S secret_ETHHi everyone, I am back.
After I published my first script, many people ask me if I can provide a long-short ratio script for other cryptocurrencies,ike for EOS /ETH.
SO,I decided to publish a BITshort‘s secret series script.
This script for Eth(Bitfinex)
What’s that
The indicator is BITFINEX Eth total margin positions(longs&shorts)
HOW TO USE THAT ? (Similar as Bitcoin)
1·RED line is Eth total shorts.Red line corresponds to the frist number shown above
2·BLUE line is Eth total longs.Blue line corresponds to the second number shown above
3·The histogramis Long-short ratio, orange one represents taht L/S is more than 1,green one represents that L/S is less than 1.
Histogram corresponds to the third number shown above.
4·The total longs and shorts has been reduced by 10000 times,Long-short ratio magnified 10 times.
For example
Frist number(red) is 19.8285 second(blue) is 27.1612 third(orange or green) is 13.6781
This means that total shorts is 198285 Eth total longs is 271612 Eth and L/S ration is 1.36781
I am a beginner in code writing.The script source code created by user BTCshort.Updated by user legofish123(me) 2018-9-8
Sincerely,again,Thank for BTCSHORT help with my code writing.
BTCshort (Tradingview,ID is BTCSHORT) ,A Bitcoin ghost,is a man who always able to predict the price of bitcoin.So we always call him 'Raytheon' .

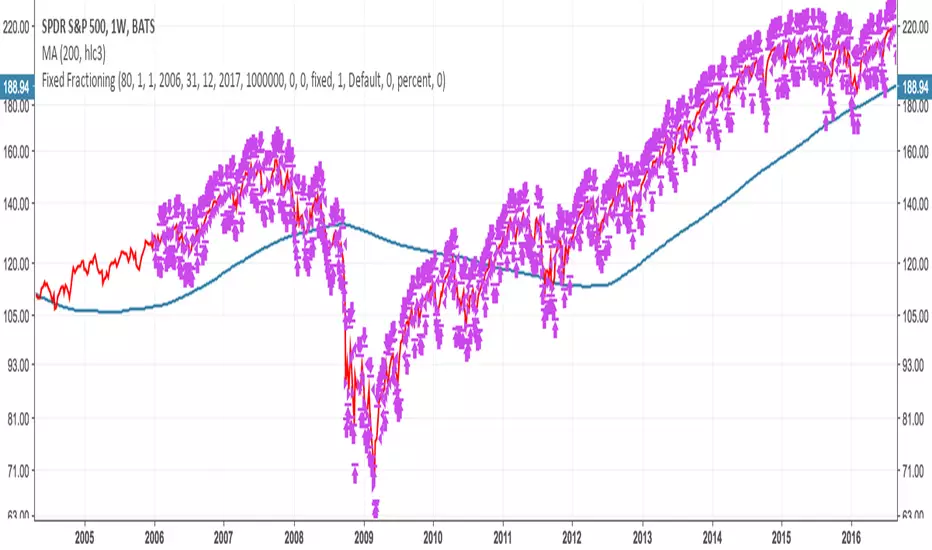
basic fixed fraction strategyOne of the most common trading strategy is to invest a certain percentage in an asset, and keep the percentage fixed. For example you invest 2% in a stock, and as the value goes up you sell. And as the value goes down you buy. Always trying to keep the value of how much you have invested in that asset at 2%.
This works very well with assets that are stable. If you have something that fluctuates around a value, you will find yourself that each time it has gone back to the value in which you entered, you have actually gained something. With an asset that grows it also works. But in general you might find that more aggressive investments are more profitable. On the other side if there is a bubble, and you invest from the beginning using this strategy you will find yourself at the end of the bubble having gained something. Not as much as having bought all at the beginning and having sold all at the end, but still you will have sold going up, and bought going down. Plus you will have gained in the fluctuation.
Where is instead very dangerous is in stock and assets that go to zero. This because you might invest just 2% in an investment. But then as the strategy works you keep investing more as you are trying to keep 2%. You basically can lose all your money in this way (like if you were invested 100% in an asset). Very dangerous. This is why you should only use this with assets that you are sure cannot go to zero (an ETF on S & P 500 could be a good example).
So I coded this strategy on TradingView. basically it will ask you what percentage you want to invest. Then starts with entering with an order of that amount, and will then keep sitself at the same percentage. The system is discrete, as it can only buy a discrete number of contract.
Note that if you use this for cryptocurrency (where you can buy a fraction of a coin, like 0.01 btc) then you should multiply the money that you have by 10, 100, 1000 ... depending on how many digits after the comma your exchange permit you to trade.
If you are using this for forex or crypto it is quite easy that the number of order will explode. As such I added the date range taken from Allanster great script
One way to use Fixed Fractioning is to calculate the Kelly Index of an asset (which will give you a percentage), and then invest half or a quarter of the kelly in that coin, and then keep this fixed.
Another way (which goes well beyond what this script can do alone) to use the Fixed Fractioning is, if you have two assets that are anticorrelated (has a negative correlation), then investing a certain percentage of your capital in one and another percentage in another. And then each time one goes up (and the other goes down) you sell the one that is going up, and buy the one that is going down to keep the percentages fixed.
Something else, it is pretty common for people to invest around 80% of their money in an ETF that follows tha S&P500. This is why here we use 80%. Generally I have seen a more common investment strategy to be around 2%.
As everybody says: I am not responsible for your money. Study before investing.
Consensio Trading SystemConsensio Trading System involves using 3 different moving average comprised of 2, 7 and 30-week simple moving average. The trading methodology is simple when all moving average are above one another and is converging up ..You're in a bull market and vise versa for a bear market when all the moving average below one another and is converging down. There are said to be more than 1000 (1k) combination for this system to begin trade with and all pattern require at least 3 moving average. This system is mainly used with the weekly chart for longterm perspective although it can be used up to 30 min for short-term trade setups. The main component of this system is longer-term moving average i.e.30 period if that is down and other MA are consolidating within a range aka death cross back and forth ... the overall market should be considered bear market regardless of other two moving average crossovers.
Hyperwave Channel by Lucid Investment Strategies
Co-hosted by D. Tyler Jenks and Leah Wald
D. Tyler Jenks, the President, and CIO of Lucid Investment Strategies LLC developed the proprietary technical system of Hyperwave. After 40 years as an investment manager, he discovered over 300 examples of Hyperwaves within various asset classes; stocks, bonds, commodities , indexes, and cryptocurrencies

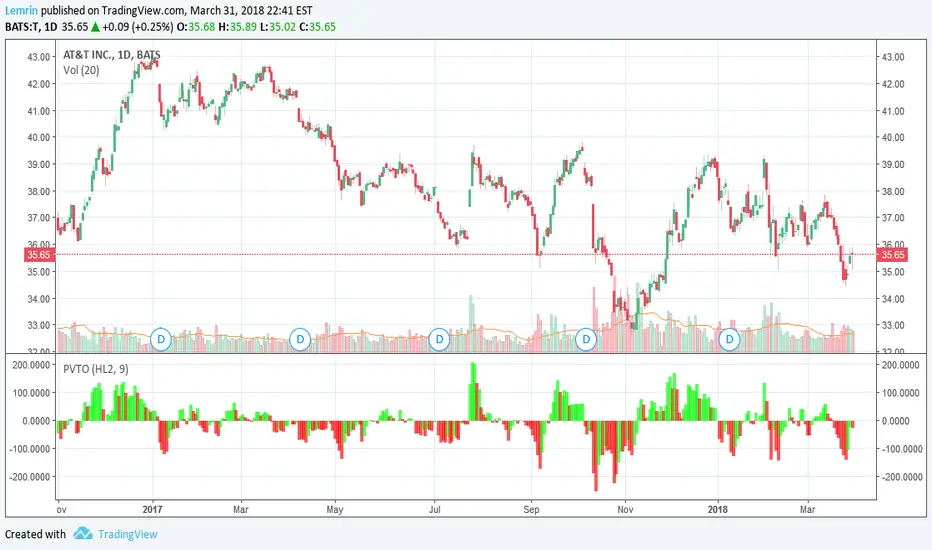
PVT OscillatorThis is the non-accumulating portion of the price-volume trend (PVT)--the amount by which PVT would change each bar--which I have turned into a zero-centered oscillator. The plot is a 9-day EMA of the PVT change, multiplied by 1000 for readability, with lime/red corresponding to whether the actual PVT increased or decreased for that bar.
As always, the length of this moving average is adjustable, as is the source of price(s) to use--open, close, high, low, HL2, HLC3, or OHLC4.
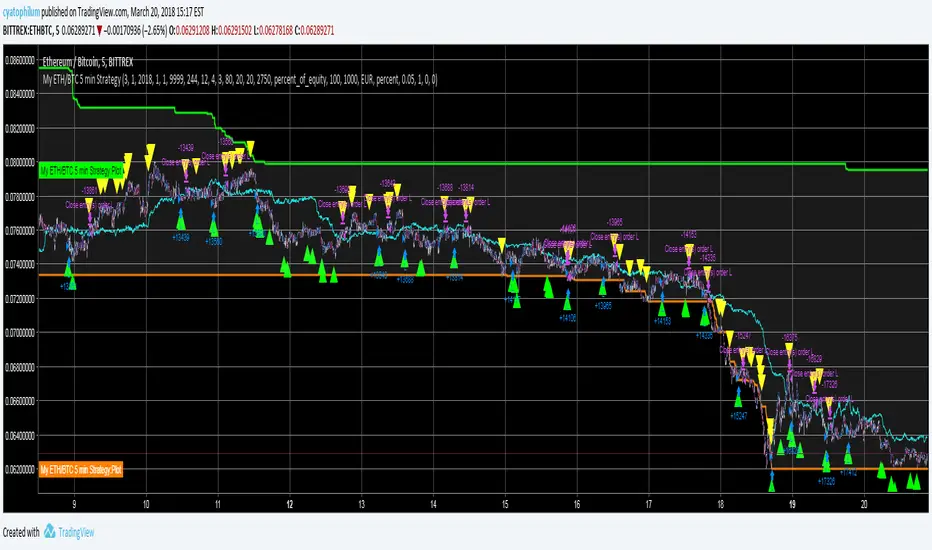
My ETH/BTC 5 min StrategyHello, beginner in trading here. Use this at your own risk.
Commission : 0.05%
Time Unit : 5 min
Backtest range : 15 days (looking like that is the maximum in 5 min UT)
Initial capital : 1000€
How it works :
Long entries and exits. That's all, no pyramiding, no shorting.
It takes the first buy signal (green triangle) and the first sell signal (yellow triangle)
The idea is to scalp while in range using stochastic, and to get out / in when a big trend appears (that is what the tunnel is for).
See the code for details.
I think those are pretty good result when we look at hueg negative buy and hold returns of this month of March. What do you think?
XPloRR MA-Trailing-Stop StrategyXPloRR MA-Trailing-Stop Strategy
Long term MA-Trailing-Stop strategy with Adjustable Signal Strength to beat Buy&Hold strategy
None of the strategies that I tested can beat the long term Buy&Hold strategy. That's the reason why I wrote this strategy.
Purpose: beat Buy&Hold strategy with around 10 trades. 100% capitalize sold trade into new trade.
My buy strategy is triggered by the fast buy EMA (blue) crossing over the slow buy SMA curve (orange) and the fast buy EMA has a certain up strength.
My sell strategy is triggered by either one of these conditions:
the EMA(6) of the close value is crossing under the trailing stop value (green) or
the fast sell EMA (navy) is crossing under the slow sell SMA curve (red) and the fast sell EMA has a certain down strength.
The trailing stop value (green) is set to a multiple of the ATR(15) value.
ATR(15) is the SMA(15) value of the difference between the high and low values.
The scripts shows a lot of graphical information:
The close value is shown in light-green. When the close value is lower then the buy value, the close value is shown in light-red. This way it is possible to evaluate the virtual losses during the trade.
the trailing stop value is shown in dark-green. When the sell value is lower then the buy value, the last color of the trade will be red (best viewed when zoomed)(in the example, there are 2 trades that end in gain and 2 in loss (red line at end))
the EMA and SMA values for both buy and sell signals are shown as a line
the buy and sell(close) signals are labeled in blue
How to use this strategy?
Every stock has it's own "DNA", so first thing to do is tune the right parameters to get the best strategy values voor EMA , SMA, Strength for both buy and sell and the Trailing Stop (#ATR).
Look in the strategy tester overview to optimize the values Percent Profitable and Net Profit (using the strategy settings icon, you can increase/decrease the parameters)
Then keep using these parameters for future buy/sell signals only for that particular stock.
Do the same for other stocks.
Important : optimizing these parameters is no guarantee for future winning trades!
Here are the parameters:
Fast EMA Buy: buy trigger when Fast EMA Buy crosses over the Slow SMA Buy value (use values between 10-20)
Slow SMA Buy: buy trigger when Fast EMA Buy crosses over the Slow SMA Buy value (use values between 30-100)
Minimum Buy Strength: minimum upward trend value of the Fast SMA Buy value (directional coefficient)(use values between 0-120)
Fast EMA Sell: sell trigger when Fast EMA Sell crosses under the Slow SMA Sell value (use values between 10-20)
Slow SMA Sell: sell trigger when Fast EMA Sell crosses under the Slow SMA Sell value (use values between 30-100)
Minimum Sell Strength: minimum downward trend value of the Fast SMA Sell value (directional coefficient)(use values between 0-120)
Trailing Stop (#ATR): the trailing stop value as a multiple of the ATR(15) value (use values between 2-20)
Example parameters for different stocks (Start capital: 1000, Order=100% of equity, Period 1/1/2005 to now) compared to the Buy&Hold Strategy(=do nothing):
BEKB(Bekaert): EMA-Buy=12, SMA-Buy=44, Strength-Buy=65, EMA-Sell=12, SMA-Sell=55, Strength-Sell=120, Stop#ATR=20
NetProfit: 996%, #Trades: 6, %Profitable: 83%, Buy&HoldProfit: 78%
BAR(Barco): EMA-Buy=16, SMA-Buy=80, Strength-Buy=44, EMA-Sell=12, SMA-Sell=45, Strength-Sell=82, Stop#ATR=9
NetProfit: 385%, #Trades: 7, %Profitable: 71%, Buy&HoldProfit: 55%
AAPL(Apple): EMA-Buy=12, SMA-Buy=45, Strength-Buy=40, EMA-Sell=19, SMA-Sell=45, Strength-Sell=106, Stop#ATR=8
NetProfit: 6900%, #Trades: 7, %Profitable: 71%, Buy&HoldProfit: 2938%
TNET(Telenet): EMA-Buy=12, SMA-Buy=45, Strength-Buy=27, EMA-Sell=19, SMA-Sell=45, Strength-Sell=70, Stop#ATR=14
NetProfit: 129%, #Trade

XPloRR MA-Buy ATR-Trailing-Stop Long Term Strategy Beating B&HXPloRR MA-Buy ATR-MA-Trailing-Stop Strategy
Long term MA Trailing Stop strategy to beat Buy&Hold strategy
None of the strategies that I tested can beat the long term Buy&Hold strategy. That's the reason why I wrote this strategy.
Purpose: beat Buy&Hold strategy with around 10 trades. 100% capitalize sold trade into new trade.
My buy strategy is triggered by the EMA(blue) crossing over the SMA curve(orange).
My sell strategy is triggered by another EMA(lime) of the close value crossing the trailing stop(green) value.
The trailing stop value(green) is set to a multiple of the ATR(15) value.
ATR(15) is the SMA(15) value of the difference between high and low values.
Every stock has it's own "DNA", so first thing to do is find the right parameters to get the best strategy values voor EMA, SMA and Trailing Stop.
Then keep using these parameter for future buy/sell signals only for that particular stock.
Do the same for other stocks.
Here are the parameters:
Exponential MA: buy trigger when crossing over the SMA value (use values between 11-50)
Simple MA: buy trigger when EMA crosses over the SMA value (use values between 20 and 200)
Stop EMA: sell trigger when Stop EMA of close value crosses under the trailing stop value (use values between 8 and 16)
Trailing Stop #ATR: defines the trailing stop value as a multiple of the ATR(15) value
Example parameters for different stocks (Start capital: 1000, Order=100% of equity, Period 1/1/2005 to now):
BAR(Barco): EMA=11, SMA=82, StopEMA=12, Stop#ATR=9
Buy&HoldProfit: 45.82%, NetProfit: 294.7%, #Trades:8, %Profit:62.5%, ProfitFactor: 12.539
AAPL(Apple): EMA=12, SMA=45, StopEMA=12, Stop#ATR=6
Buy&HoldProfit: 2925.86%, NetProfit: 4035.92%, #Trades:10, %Profit:60%, ProfitFactor: 6.36
BEKB(Bekaert): EMA=12, SMA=42, StopEMA=12, Stop#ATR=7
Buy&HoldProfit: 81.11%, NetProfit: 521.37%, #Trades:10, %Profit:60%, ProfitFactor: 2.617
SOLB(Solvay): EMA=12, SMA=63, StopEMA=11, Stop#ATR=8
Buy&HoldProfit: 43.61%, NetProfit: 151.4%, #Trades:8, %Profit:75%, ProfitFactor: 3.794
PHIA(Philips): EMA=11, SMA=80, StopEMA=8, Stop#ATR=10
Buy&HoldProfit: 56.79%, NetProfit: 198.46%, #Trades:6, %Profit:83.33%, ProfitFactor: 23.07
I am very curious to see the parameters for your stocks and please make suggestions to improve this strategy.

Noro's Accuracy Strategy v1.0Strategy with a piramiding (leverage is necessary)
Only long
Than the accuracy is more
the there are more profitable trades
the there are less signals
the profit is less
For:
- any asset (forex, stocks, crypto, etc)
- any timeframe
Recomended:
Accuracy = 1-10
MA period = 100-1000

Understanding contract sizes in a strategyThis simple strat fires up on green bars, down on red bars. cannot get any simpler. So, it's a good example to check how returns are calculated.
First, the internal firing mechanism for the strategy.entry function is something hardcore. As result, the entry points can be confusing, and seem to appear in a wrong bar (as the 2nd and 3rd signals are good examples), but i'll put that aside to keep it simple. And, because i don't yet get it myself ;)
The example is simple, so that numbers can be followed easy. Chart in BTC/USD, so USD is the "base" currency used by strat to calculate. A contract/unit is the value of 1 unit in base currency. 1 Apple share is 600$, 1 bitcoin is 600$, 1 oz gold is 1330 bucks. So, here in each bar, the value of 1 contract is the value of the BTC in USD. simple as that.
The strat properties, can be passed as input fields (line 2) or accessed/changed in the right click->properties pop-up. To make it easier, initial capital is 1000 bucks, and "order size" is 1 contract. This means that the strat will open a position of 1 BTC when it fires. Value "Initial capital" makes no difference at all, at least with these choices. It's just for show. Try to put 1$ and 1 contract, the strat will still trade anyway. It manages to trade 1 contract(or BTC) values at ~600$, with a single dollar. nice ;)
Check the chart. see the little blue "BarUp +1" ? that's it, strat goes long 1 BTC. there's a little blue triangle on the bar, points to the value of entry.
Then later, on second move, the "BarDn -2", the strat goes short 2BTC. 1BTC to close the long +1 more to open a short.
The profit here is the difference between the value of the long opening and the long closing. The extra BTC (shorted) is part of the next position. Since this dumb strat just reverses the direction, there are always +2, -2 , +2.... 1 to close previous position, 1 to open another. At the strategy tester tab, the option "list of trades" shows in details each of the moves
Checking each move and comparing what we see with the chart itself helps to achieve ilumination :)
Bonus feature: as soon as you get it, try to increase the option "pyramiding" and see how the strat adds more contracts, and how it reverses the positions. sometimes it even makes sense!!!! :)

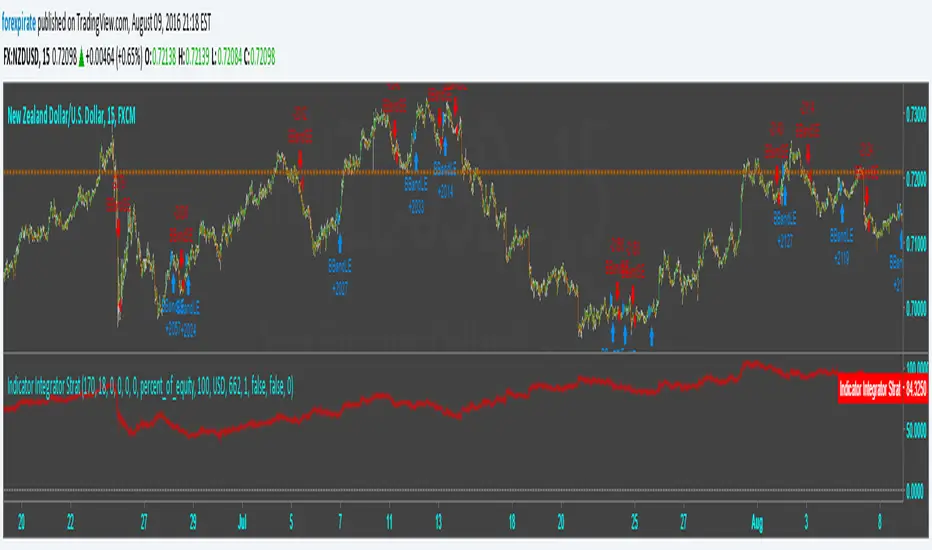
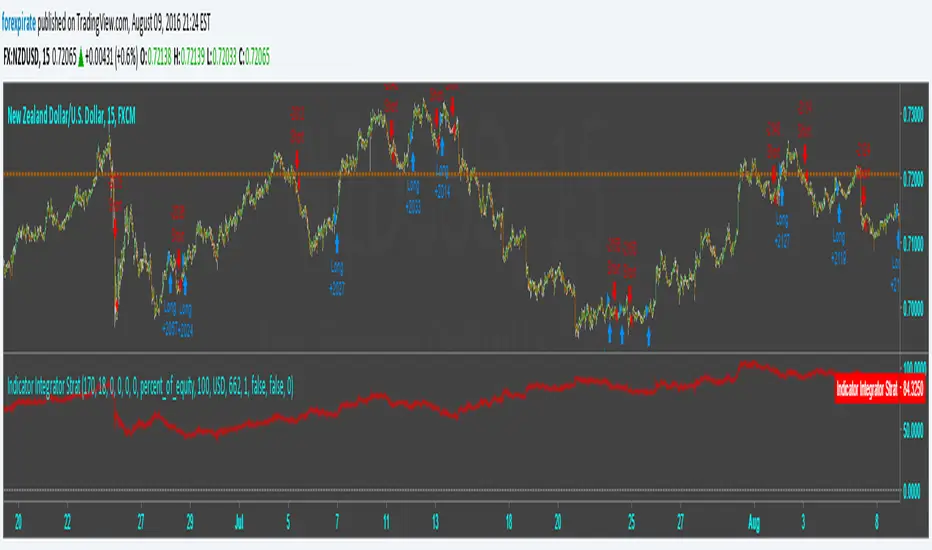
Indicator Integrator Strat <<<<<< Updated again, second2nd patch
Found an error in the orders. Script was making double orders at times. I fixed it. It is tuned as such:
NZDUSD
15 min chart
starting $USD to show 1000 contracts for minicontract with FXCM (start date 3-18 $633 ** see note)
Indicator plots Starting equity-trade gain and loses-number of trades time spread = net money
** with 1:50 leverage it requires $16 for one 1,000 contract.
$84 net vs $16 initial balance is 456% in 109 days.
* If you find errors please comment.
Indicator Integrator Strat <<<<<< UPDATED with CorrectionFound an error in the orders. Script was making double orders at times. I fixed it. It is tuned as such:
NZDUSD
15 min chart
starting $USD to show 1000 contracts for minicontract with FXCM (start date 3-18 $633 with 1:50 leverage)
Indicator plots ==> Starting equity - (trade gain and loses) - (number of trades) * (spread) = true balance estimate