在腳本中搜尋"科创板医药板块股票技术指标分析(MACD、成交量、支撑位压力位)"

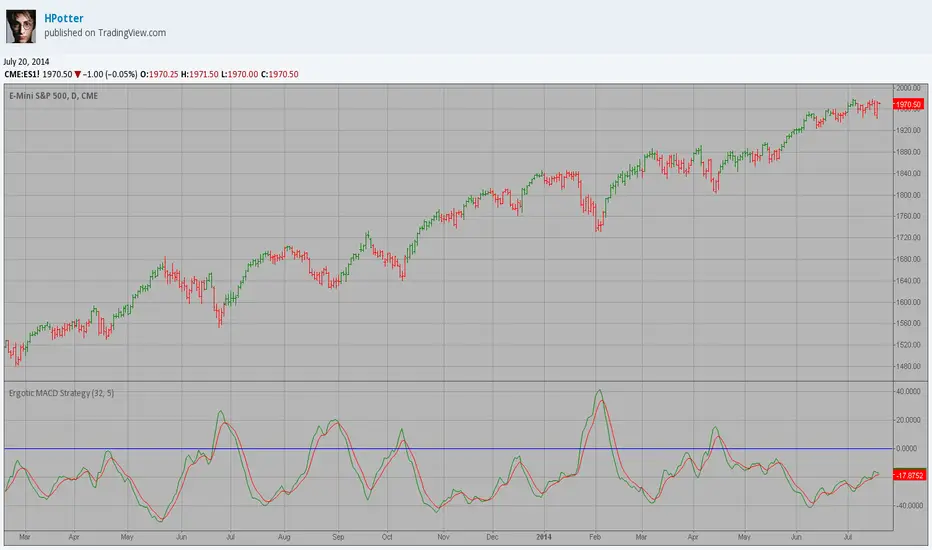
Ergotic MACD Strategy Backtest This is one of the techniques described by William Blau in his book
"Momentum, Direction and Divergence" (1995). If you like to learn more,
we advise you to read this book. His book focuses on three key aspects
of trading: momentum, direction and divergence. Blau, who was an electrical
engineer before becoming a trader, thoroughly examines the relationship
between price and momentum in step-by-step examples. From this grounding,
he then looks at the deficiencies in other oscillators and introduces some
innovative techniques, including a fresh twist on Stochastics. On directional
issues, he analyzes the intricacies of ADX and offers a unique approach to help
define trending and non-trending periods.
Blau`s indicator is like usual MACD, but it plots opposite of meaningof
stndard MACD indicator.
You can change long to short in the Input Settings
Please, use it only for learning or paper trading. Do not for real trading.

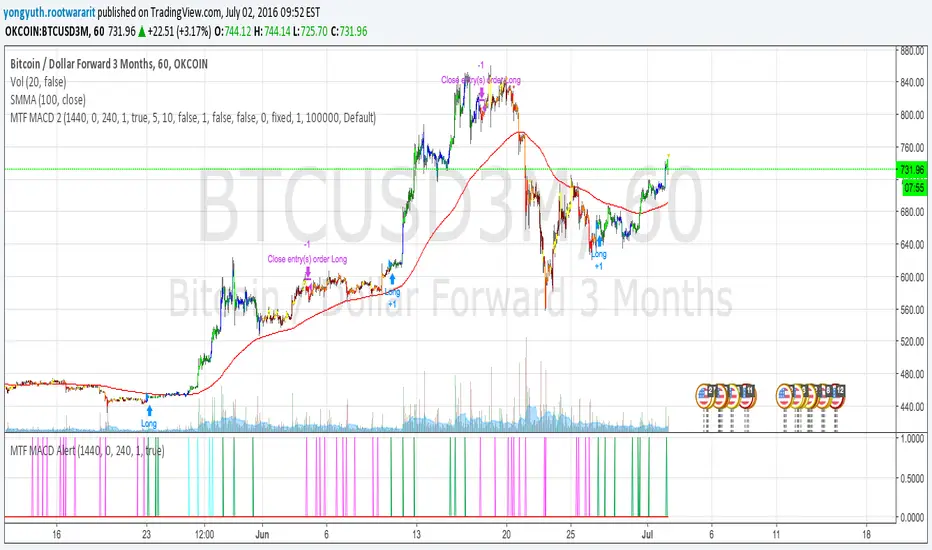
MTF MACD 2 By YuthavithiIf you want a good strategy without repaint. This one might be for you. Excellent profitable for BTCUSD3M for OKCoin.
It uses multiple time frame MACD for trading decision. To avoid repaint, set the delay period = 1 for both long term and midterm.
The idea is that, if long term, mid term and current time frame all agree on traidng direction, the trade will take place.
I also uses it in my automated trading bot with good result.
www.tradingview.com
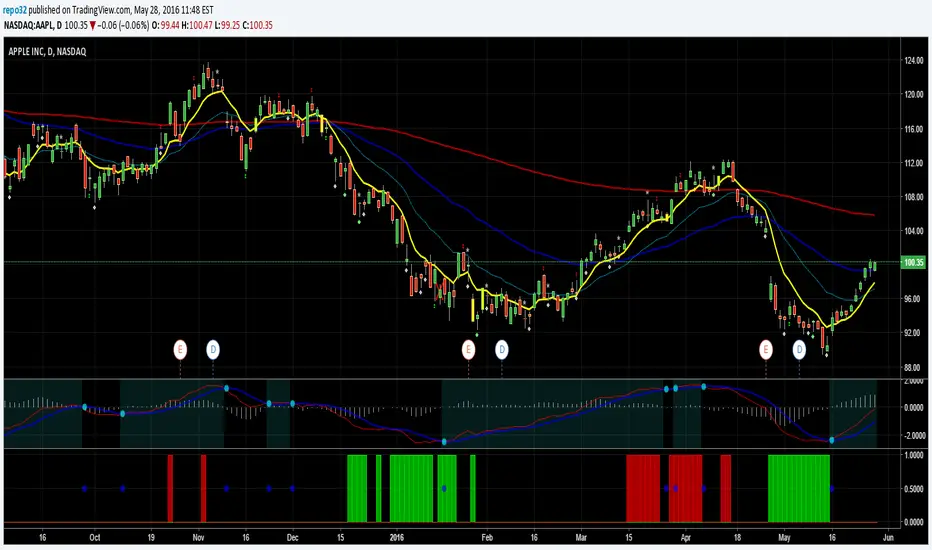
Rob RSI Stoch MACD Combo Alert//Created by Robert Nance on 5/28/16. Additional credit to vdubus.
//This was a special request from rich15stan. It combines my original RSI Stoch extremes with vdubus’ MACD VXI.
//This script will give you red or green columns as an indication for oversold/overbought,
//based upon the rsi and stochastic both being at certain levels. The default oversold is at 35.
//If Stochastic and RSI fall below 35, you will get a green column. Play with your levels to see how
//your stock reacts. It now adds the MACD crossover, plotted as a blue circle.
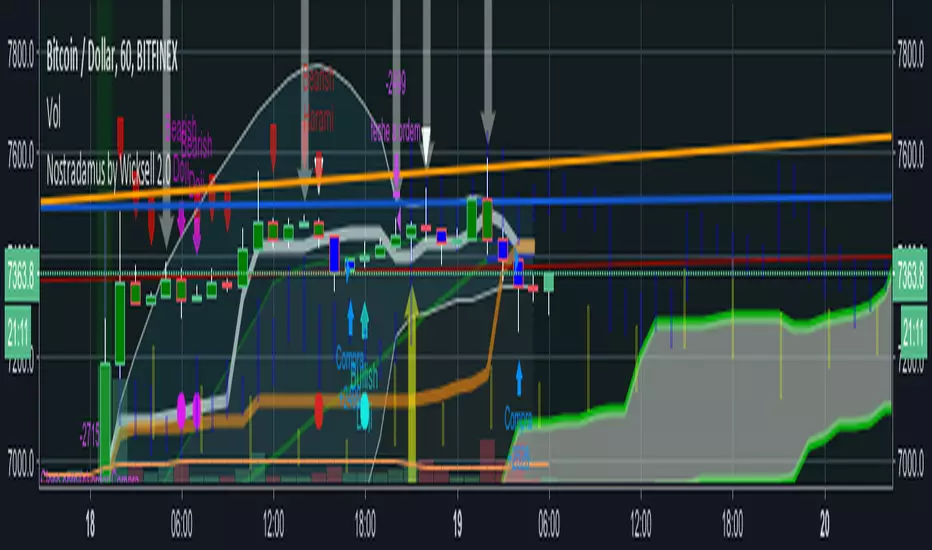
[RS]MACD Divergence V0EXPERIMENTAL:
MACD Divergence detection.
looks like macd is more prone for missing the extremes in price then the rsi due to lag.

Ergotic MACD Strategy This is one of the techniques described by William Blau in his book
"Momentum, Direction and Divergence" (1995). If you like to learn more,
we advise you to read this book. His book focuses on three key aspects
of trading: momentum, direction and divergence. Blau, who was an electrical
engineer before becoming a trader, thoroughly examines the relationship
between price and momentum in step-by-step examples. From this grounding,
he then looks at the deficiencies in other oscillators and introduces some
innovative techniques, including a fresh twist on Stochastics. On directional
issues, he analyzes the intricacies of ADX and offers a unique approach to help
define trending and non-trending periods.
Blau`s indicator is like usual MACD, but it plots opposite of meaningof
stndard MACD indicator.
Ergotic MACD This is one of the techniques described by William Blau in his book
"Momentum, Direction and Divergence" (1995). If you like to learn more,
we advise you to read this book. His book focuses on three key aspects
of trading: momentum, direction and divergence. Blau, who was an electrical
engineer before becoming a trader, thoroughly examines the relationship
between price and momentum in step-by-step examples. From this grounding,
he then looks at the deficiencies in other oscillators and introduces some
innovative techniques, including a fresh twist on Stochastics. On directional
issues, he analyzes the intricacies of ADX and offers a unique approach to help
define trending and non-trending periods.
Blau`s indicator is like usual MACD, but it plots opposite of meaningof
stndard MACD indicator.

MACD 4H Cross Above Zero AlertMACD 4H Cross the signal line to screen for stocks across a wide demo list

MACD cu RSI 7 Fibonacci color levelsMACD with RSI info
The RSI is display as value with changing color as Fibonacci levels.
MACD with RSI color 7 Fibonacci levelsMACD that contain RSI info
The color of RSI is change accordingly with Fibonacci levels, from red till green

MACD+RSI by NiksMACD and RSI combined in one indicator. This is to allow you to add more than 3 indicators in free version of Trading view


macZLSMAMacd that shows instantaneous trend using ZLSMA. This crossover has the ability to reveal trend directions before it happens.


MACD Luckscout versionMACD Luckscout version
How to use :
We should look for divergence and/or convergence.


MACD Strategy by ForbesStrategy นี้เขียนขึ้นมาจากบทความของนิตยสารธุรกิจ ชื่อดัง Forbes
สำหรับผู้ที่อยากอ่านสามารถค้นหาได้โดยใช้คำค้นว่า Bitcoin Trading Strategy For Passive Investors
สำหรับผู้ทีจะทอสอบ backtest ให้ตั้งค่า commission (หรือค่าธรรมเนียมการเทรดด้วย) เพื่อให้ผลลัพท์ใกล้เคียงกับความเป็นจริงมากที่สุด
อย่างไรก็ตามจากการ backtest นั้น พบว่า Strategy นี้เหมาะกับ Timeframe Day มากที่สุด และโดยส่วนตัวคิดว่าเหมาะสำหรับการซื้อขายแบบ Spot เท่านั้น


MACD + RSI + EMA + SMA + Ichimoku + overbought + buy, sell +Doji// MACD + EMA 200 *** buy and sell strategy (RSI, EMA, SMA) *** Doji Harami *** overbought and oversold *** trend direction *** divergence *** Ichimoku
Use this script in time 1h