M2 Global Liquidity Index [Custom Offsets]M2 Global Liquidity Index
Plots the global M2 money supply alongside price, with two user-configurable forward shifts to help you anticipate macro-driven moves in BTC (or any asset).
Key Features
Current M2 Index (no offset)
Offset A — shift M2 forward by N days (default 78)
Offset B — shift M2 forward by M days (default 109)
Extended Currencies toggle adds 9 additional central banks (CHF, CAD, INR, RUB, BRL, KRW, MXN, ZAR)
All lines share the left-hand axis and scale to trillions
Inputs
Offset A (days): integer ≥ 0 (default 78)
Offset B (days): integer ≥ 0 (default 109)
Include extended currencies?: on/off
How to Use
Add the indicator to any chart (overlay mode).
In Settings → Inputs, enter your desired lead times for Offset A and Offset B.
Toggle extended currencies if you need a broader “global liquidity” view.
Watch how price action (e.g. BTC) tracks the shifted M2 lines to spot potential turning points.
Why It Matters
Changes in money supply often lead risk assets by several weeks to months. This tool makes it easy to visualize and test those correlations directly on your favorite timeframe.
在腳本中搜尋"美国m2历年数据"
M2 Global Liquidity Index [Extended + Offset]M2 Global Liquidity Index
This indicator visualizes global M2 money supply, weighted in USD, based on major economic regions.
Features:
Standard Mode: Includes M2 data from the USA, China, Eurozone, Japan, and the UK.
Extended Mode: Adds Switzerland, Canada, India, Russia, Brazil, South Korea, Mexico, and South Africa.
Offset Function: Adjustable time lag (78 or 108 days) to analyze the delayed impact of liquidity on financial markets.
Use Case:
Designed to help identify global liquidity cycles and assess potential turning points in financial markets. Rising global liquidity generally supports risk assets like equities and crypto, while declining liquidity can put downward pressure on these markets.
Technical Details:
Non-USD M2 values are converted using real-time FX rates.
All values are displayed in trillions of USD (Tn).
Note:
Not all countries release M2 data in real-time or at the same frequency. Minor delays and discrepancies may occur.
Example:

M2 Global Liquidity Index
The M2 Global Liquidity Index calculates a composite index reflecting the aggregate liquidity provided by the M2 money supply of five major currencies: Chinese Yuan (CNY), US Dollar (USD), Euro (EUR), Japanese Yen (JPY), and British Pound (GBP). The M2 money supply includes cash, checking deposits, and easily convertible near money. By incorporating exchange rates (CNY/USD, EUR/USD, JPY/USD, GBP/USD), the script adjusts each country's M2 supply to a common base (USD) and sums them up to produce a global liquidity metric. This metric, plotted on a daily timeframe, provides an overview of the total liquidity available in these five significant economies.
Understanding the M2 money supply is crucial for assessing liquidity because it represents the amount of money readily available in an economy for spending and investment. Higher M2 levels generally indicate more liquidity, suggesting easier access to capital for businesses and consumers, potentially leading to economic growth. Conversely, lower M2 levels can signify tighter liquidity conditions, possibly resulting in constrained spending and investment.

M2 Liqudity WaveGlobal Liquidity Wave Indicator (M2-Based)
The Global Liquidity Wave Indicator is designed to track and visualize the impact of global M2 liquidity on risk assets—especially those highly correlated to monetary expansion, like Bitcoin, MSTR, and other macro-sensitive equities.
Key features include:
Leading Signal: Historically leads Bitcoin price action by approximately 70 days, offering traders and analysts a forward-looking edge.
Wave-Based Projection: Visualizes a "probability cloud"—a smoothed band representing the most likely trajectory for Bitcoin based on changes in global liquidity.
Min/Max Offset Controls: Adjustable offsets let you define the range of lookahead windows to shape the wave and better capture liquidity-driven inflection points.
Explicit Offset Visualization: Option to manually specify an exact offset to fine-tune the overlay, ideal for testing hypotheses or aligning with macro narratives.
Macro Alignment: Particularly effective for assets with high sensitivity to global monetary policy and liquidity cycles.
This tool is not just a chart overlay—it's a lens into the liquidity engine behind the market, helping anticipate directional bias in advance of price moves.
How to use?
- Enable the indicator for BTCUSD.
- Set Offset Range Start and End to 70 and 115 days
- Set Specific Offset to 78 days (this can change so you'll need to play around)
FAQ
Why a global liquidity wave?
The global liquidity wave accounts for variability in how much global liquidity affects an underlying asset. Think of the Global Liquidity Wave as an area that tracks the most probable path of Bitcoin, MSTR, etc. based on the total global liquidity.
Why the offset?
Global liquidity takes time to make its way into assets such as #Bitcoin, Strategy, etc. and there can be many reasons for that. It's never a specific number of days of offset, which is why a global liquidity wave is helpful in tracking probable paths for highly correlated risk assets.

[c3s] CWS - M2 Global Liquidity Index & BTC Correlation CWS - M2 Global Liquidity Index with Offset BTC Correlation
This custom indicator visualizes and analyzes the relationship between the global M2 money supply and Bitcoin (BTC) price movements. It calculates the correlation between these two variables to provide insights into how changes in global liquidity may impact Bitcoin’s price over time.
Key Features:
Global M2 Liquidity Index Calculation:
Fetches M2 money supply data from multiple economies (China, US, EU, Japan, UK) and normalizes using currency exchange rates (e.g., CNY/USD, EUR/USD).
Combines all M2 data points and normalizes by dividing by 1 trillion (1e12) for easier visualization.
Offset for M2 Data:
The offset parameter allows users to shift the M2 data by a specified number of days, helping track the influence of past global liquidity on Bitcoin.
BTC Price Correlation:
Computes the correlation between shifted global M2 liquidity and Bitcoin (BTC) price, using a 52-day lookback period by default.
Correlation Quality Display:
Categorizes correlation quality as:
Excellent : Correlation >= 0.8
Good : Correlation >= 0.6 and < 0.8
Weak : Correlation >= 0.4 and < 0.6
Very Weak : Correlation < 0.4
Displays correlation quality as a label on the chart for easy assessment.
Visual Enhancements:
Labels : Displays dynamic labels on the chart with metrics like M2 value and correlation.
Plot Shapes : Uses shapes to indicate data availability for global M2 and correlation.
Data Table : Optionally shows a data table in the top-right corner summarizing:
Global M2 value (in trillions)
The correlation between global M2 and BTC
The correlation quality
Optional Debugging:
Debug plots help identify when data is missing for M2 or correlation, ensuring transparency and accurate functionality.
Inputs:
Offset: Shift the M2 data (in days) to see past liquidity effects on Bitcoin.
Lookback Period: Number of periods (default 52) used to calculate the correlation.
Show Labels: Toggle to show or hide labels for M2 and correlation values.
Show Table: Toggle to show or hide the data table in the top-right corner.
Usage:
Ideal for traders and analysts seeking to understand the relationship between global liquidity and Bitcoin price. The offset and lookback period can be adjusted to explore different timeframes and correlation strengths, aiding more informed trading decisions.

M2 Global Liquidity Index - Time-Shift - KHM2 Global Liquidity Index - Enhanced Time-Shift Indicator
Based on original work by @Mik3Christ3ns3n
Enhanced with advanced time-shift functionality and overlay capabilities.
Description:
This indicator tracks and visualizes the global M2 money supply from five major economies, allowing precise time-shift analysis for correlation studies. All values are converted to USD in real-time and aggregated to provide a comprehensive view of global liquidity conditions.
Key Features:
- Advanced time-shift capability (-1000 to +1000 days) with shape preservation
- Real-time currency conversion to USD
- Overlay functionality with main chart
- Right-scale display for better comparison
- Full historical data preservation during time shifts
Components Tracked:
- US M2 Money Supply (USM2)
- China M2 Money Supply (CNM2)
- Eurozone M2 Money Supply (EUM2)
- Japan M2 Money Supply (JPM2)
- UK M2 Money Supply (GBM2)
Primary Use Cases:
1. Correlation Analysis:
- Compare global liquidity trends with asset prices
- Identify leading/lagging relationships through time-shift
- Study monetary policy impacts across different time periods
2. Market Analysis:
- Track global liquidity conditions
- Monitor central bank policy effects
- Identify potential macro trend changes
Settings:
- Time Offset: Shift the M2 data backwards or forwards (-1000 to +1000 days)
- Positive values: Move M2 data into the future
- Negative values: Move M2 data into the past
- Zero: Current alignment
Technical Notes:
- Data updates follow central banks' M2 publication schedules
- All currency conversions performed in real-time
- Historical shape preservation during time-shifts
- Enhanced data consistency through lookahead mechanism
Credits:
Original concept and base code by @Mik3Christ3ns3n
Enhanced version includes advanced time-shift capabilities and shape preservation
License:
Pine Script™ code is subject to the terms of the Mozilla Public License 2.0
#M2 #GlobalLiquidity #MoneySupply #Macro #CentralBanks #MonetaryPolicy #TimeShift #Correlation #TradingIndicator #MacroAnalysis #LiquidityAnalysis #MarketIndicator

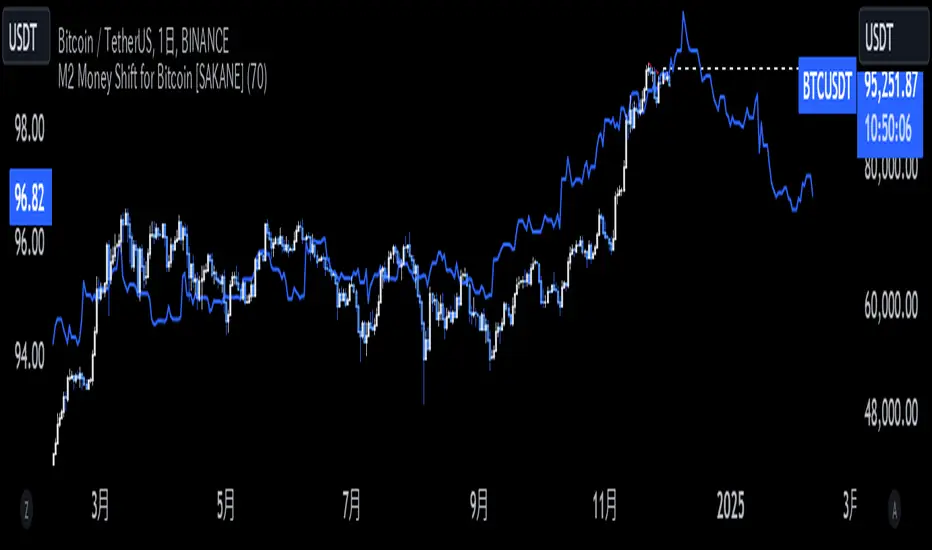
M2 Money Shift for Bitcoin [SAKANE]M2 Money Shift for Bitcoin was developed to visualize the impact of M2 Money, a macroeconomic indicator, on the Bitcoin market and to support trade analysis.
Bitcoin price fluctuations have a certain correlation with cycles in M2 money supply.In particular, it has been noted that changes in M2 supply can affect the bitcoin price 70 days in advance.Very high correlations have been observed in recent years in particular, making it useful as a supplemental analytical tool for trading.
Support for M2 data from multiple countries
M2 supply data from the U.S., Europe, China, Japan, the U.K., Canada, Australia, and India are integrated and all are displayed in U.S. dollar equivalents.
Slide function
Using the "Slide Days Forward" setting, M2 data can be slid up to 500 days, allowing for flexible analysis that takes into account the time difference from the bitcoin price.
Plotting Total Liquidity
Plot total liquidity (in trillions of dollars) by summing the M2 supply of multiple countries.
How to use
After applying the indicator to the chart, activate the M2 data for the required country from the settings screen. 2.
2. adjust "Slide Days Forward" to analyze the relationship between changes in M2 supply and bitcoin price
3. refer to the Gross Liquidity plot to build a trading strategy that takes into account macroeconomic influences.
Notes.
This indicator is an auxiliary tool for trade analysis and does not guarantee future price trends.
The relationship between M2 supply and bitcoin price depends on many factors and should be used in conjunction with other analysis methods.
SulLaLuna — HTF M2 x Ultimate BB (Fusion) 🌕 **SulLaLuna — HTF M2 x Ultimate BB (Fusion)** 🚀💵
**By SulLaLuna Trading**
(Portions of the Bollinger Band logic adapted with permission/credit from the *Ultimate Buy & Sell Indicator* by its original author — thank you for the brilliance!)
---
🧭 **What This Is**
This is not just another price-following tool.
This is **a macro liquidity detector** — a **Daily Higher Timeframe Hull Moving Average of the Global M2 Money Supply**, smoothed via lower timeframe candles (default 5m, 48 Hull length), overlaid with **Ultimate-style double Bollinger Bands** to reveal *over-extension & mean reversion zones*.
It doesn’t chase candles.
It watches the tides beneath the market — the **money supply currents** that have a **direct correlation** to asset price behavior.
When liquidity expands → risk-on assets tend to rise.
When liquidity contracts → risk-off waves hit.
We ride those waves.
---
🔍 **What It Does**
* **Tracks Global M2** across major economies, FX-adjusted, and scales it to your chart’s price.
* **HTF Hull MA** (Daily, smoothed via 5m base) → gives you the macro liquidity trend.
* **Ultimate BB logic** applied to the HTF M2 Hull → inner/outer bands for volatility envelopes.
* **Pivot Labels** → ideal entry/exit zones on macro turns.
* **Over-Extension Alerts** → when HTF M2 Hull pushes outside the outer bands.
* **Re-Entry Alerts** → mean reversion triggers when liquidity moves back inside the range.
* **Background Paint** from chart TF M2 slope → for confluence on your entry timeframe.
---
📜 **Suggested How-To**
1. **Choose your execution chart** — e.g., 1–15m for scalps, 1H–4H for swings.
2. **Use the background paint** as your *local tide check* (chart TF M2 slope).
3. **Trade in the direction of the HTF M2 Hull** — green line = liquidity rising, red line = liquidity falling.
4. **Watch pivot labels** — these are potential “macro inflection” points.
5. **Confluence stack** — pair with ZLSMA, WaveTrend divergences, VWAP volume, or your favorite price-action setups.
6. **Size down** when HTF M2 Hull is flat/gray (chop zone).
7. **Scale in/out** on over-extension + re-entry alerts for higher probability swings.
---
⚠️ **Important Note**
This indicator **does not predict price** — it tracks macro liquidity flows that *influence* price.
Think of it as your market’s **tide chart**: when the water’s coming in, you can swim out; when it’s going out, you’d better be ready for the undertow.
---
📢 **Alerts Available**
* HTF Pivot HIGH / LOW
* Over-Extension (HTF Hull outside outer BB)
* Re-Entry (return from overbought/oversold)
---
🤝 **Join the SulLaLuna Tribe**
If this indicator helps you capture better entries, follow & share so more traders can learn to trade *math, not emotion*.
We rise together — **and we’ll meet you on the Moon** 🌕🚀💵.

Global M2 Money Supply Top20 + Offset & WaveThe M2 Top20 is a global aggregation of the M2 money supply from the 20 largest economies in the world , providing a comprehensive view of the total liquidity in the global financial system. It is expressed in trillions of USD.
This script calculates and visualizes the M2 Money Supply of the Top 20 Global Economies, adjusted to various timeframes (4H, 1D, 1W, 1M) with customizable offset adjustments (in days) from -1000 days to +1000 days. This indicator includes data from the Americas, Europe, Africa, and the Asia Middle East , offering a diverse and balanced representation of major economic regions. The M2 of each country has been converted to USD.
Additionally, the user can set a minimum and maximum offset to create a wave around the main offset and expand the comparison.
Combining these options, this indicator enables users to visualize a range of the global money supply, making it useful for market analysis, economic forecasting, and understanding macroeconomic trends. This indicator is particularly valuable for traders and analysts interested in understanding the dynamics of global monetary systems and their potential impact on financial markets.
Key Features:
Global M2 Money Supply calculation from the Top 20 Economies.
Adjustable Offset: Adjust the offset to align the indicator with the best bar. Adjustment in days, usable on different timeframes (1D, 1W, 4H, 1M).
Wave Projection: Displays a "probability cloud"—a smoothed area that shows the probable path of Bitcoin, derived from shifts in global liquidity.
Min/Max Offset Adjustments: Customizable offsets allow you to determine the range of future windows, helping to shape the wave and better identify liquidity-driven turning points.
Use Cases:
Economic Forecasting: Identify trends in global money supply and their potential market impact (e.g., historically leads Bitcoin price by +/- 78 days to +/-108 days).
Market Analysis: Track the growth or contraction of money supply across key economies.
Macro-Economic Analysis: Understand the relationship between monetary policies and market performance.
How to use:
Add the indicator to your chart.
Set the timeframe to 1D to customize the offset.
Set the Offset (in days).
Set the Offset Range Minimum and Maximum.
Show/Hide the Range Wave
.
Use offset = 0 to have the indicator align directly with the current data, without any shift, providing a baseline for comparison with the most recent market conditions.
Countries included in the M2 Top20:
China (CN), Japan (JP), South Korea (KR), Hong Kong (HK), Taiwan (TW), India (IN), Saudi Arabia (SA), Thailand (TH), Vietnam (VN), United Arab Emirates (AE), Malawi (MW) – Africa, United States (US), Canada (CA), Brazil (BR), Mexico (MX), Eurozone (EU), United Kingdom (GB), Russia (RU), Poland (PL), Switzerland (CH).
These countries were selected from the ranking of the World Economy Indicator of Trading View .

Global M2 Money Supply (USD) GrowthThe Global M2 Growth indicator evaluates the total liquid money supply, including cash, checking deposits, and assets that can be easily converted to cash. It reflects changes in global liquidity by tracking year-on-year (YoY) changes in the Global M2 money supply rather than its absolute value. This approach highlights the velocity of liquidity expansion or contraction, offering a clearer understanding of its correlation with asset performance, such as Bitcoin.
How It Works
When the Global M2 money supply expands, it reflects an increase in available liquidity. This often leads to an influx of capital into higher-yielding and riskier assets like Bitcoin, equities, and commodities. Conversely, when M2 contracts, liquidity tightens, leading to declines in the values of these assets.
An essential insight is that Bitcoin's price is not immediately affected by changes in M2. Research shows a lag of approximately 56-60 days (around two months) between liquidity changes and Bitcoin's price movements. Shifting the liquidity data forward by this period improves the correlation between Global M2 and Bitcoin performance.
How to Use
Track Global M2 YoY Change: Focus on liquidity's yearly change to identify trends. Rapid increases in liquidity often signify favorable conditions for Bitcoin and other risk assets to rise, while contractions often predict price declines or consolidation phases.
Account for the Lag Effect: Incorporate the two-month lag into your analysis to predict Bitcoin's potential moves more accurately. For instance, a recent resurgence in liquidity growth could signal a Bitcoin rally within the next two months.
Use as a Macro Indicator: Monitor liquidity trends alongside other economic indicators and asset performance metrics to build a more comprehensive investment framework.
By tracking these dynamics, traders and investors can better anticipate Bitcoin's trajectory and make informed decisions.

FinFluential Global M2 Money Supply // Days Offset =The "Global M2 Money Supply" indicator calculates and visualizes the combined M2 money supply from multiple countries and regions worldwide, expressed in trillions of USD.
M2 is a measure of the money supply that includes cash, checking deposits, and easily convertible near-money assets. This indicator aggregates daily M2 data from various economies, converts them into a common USD base using forex exchange rates, and plots the total as a single line on the chart.
It is designed as an overlay indicator aligned to the right scale, making it ideal for comparing global money supply trends with price action or other market data.
Key Features
Customizable Time Offset: Users can adjust the number of days to shift the M2 data forward or backward (from -1000 to +1000 days) via the indicator settings. This allows for alignment with historical events or forward-looking analysis.
Global Coverage Includes:
Eurozone: Eurozone M2 (converted via EUR/USD)
North America: United States, Canada
Non-EU Europe: Switzerland, United Kingdom, Finland, Russia
Pacific: New Zealand
Asia: China, Taiwan, Hong Kong, India, Japan, Philippines, Singapore
Latin America: Brazil, Colombia, Mexico
Middle East: United Arab Emirates, Turkey
Africa: South Africa

Global M2 [BizFing]MARKETSCOM:BITCOIN ECONOMICS:USM2
This is an indicator designed to show the correlation between the global M2 money supply and Bitcoin.
This indicator basically provides a Global M2 index by summing the M2 money supply data from the United States, South Korea, China, Japan, the EU, and the United Kingdom.
Furthermore, it is configured to allow you to add or remove the M2 data of desired countries within the settings.
I hope this proves to be a small aid in predicting the future price of Bitcoin.
If you have any questions or require any improvements while using it, please feel free to contact me.
Thank you.

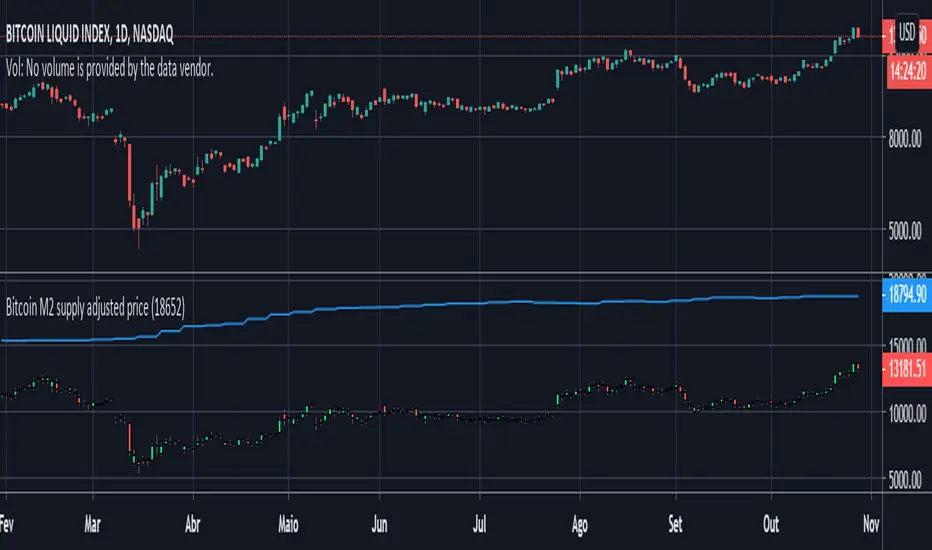
Bitcoin M2 supply adjusted priceThis script plots bitcoin candles adjusted by M2 supply (blue line), helping the trader to obtain insight of new support/resistance levels adjusted by M2 supply.
Note: As it was not possible to make the price adjust automatically by the last M2 value (pinescript limitation, I guess), the input parameter "M2Last" must be updated manually observing the last M2 value in blue curve.
My-Indicator - Global Liquidity & Money Supply M2 + Time OffsetThis script is designed to visualize a global liquidity and money supply index by combining data from various regions and, optionally, central bank activity. Visualizing this data on a chart allows you to see how central banks are intervening in the financial system and how the total amount of money in the economy is changing. Let’s take a look at how it works:
Central Bank Liquidity
Shows the actions of central banks (e.g. FED, ECB) providing short-term cash to commercial banks. If you see spikes or a steady increase in these indicators, it may suggest that liquidity is being increased through intervention, which often stimulates the market.
Money Supply
M2 money supply is a monetary aggregate that includes M1 (cash and current deposits) plus savings deposits, small term deposits, and other financial instruments that, while not as liquid as M1, can be quickly converted into cash. As a result, M2 provides a broader picture of the available money in the economy, which is useful for analyzing market conditions and potential economic trends.
How does it help investors?
It allows you to quickly see when central banks are injecting additional liquidity, which could signal higher prices.
It allows you to see trends in the money supply, which informs potential changes in inflation and the economic cycle.
Combining both sets of data provides a more complete picture – both in the short and long term – which makes it easier to predict upcoming price movements.
This allows investors to better respond to changes in central bank policy and broader monetary trends, increasing their chances of making better investment decisions.
Data Collection
The script retrieves money supply data for key markets such as the USA (USM2), Europe (EUM2), China (CNM2), and Japan (JPM2). It also offers additional money supply series for other markets—like Canada (CAM2), Great Britain (GBM2), Russia (RUM2), Brazil (BRM2), Mexico (MXM2), and New Zealand (NZM2)—with extra options (e.g., Australia, India, Korea, Indonesia, Malaysia, Sweden) disabled by default. Moreover, you can enable data for central bank liquidity (such as FED, RRP, TGA, ECB, PBC, BOJ, and other central banks), which are also disabled by default.
Index Calculation
The indicator calculates the index by adding together all the enabled money supply series (and the central bank data if activated) and then scales the sum by dividing it by 1,000,000,000,000 (one trillion). This scaling makes the resulting values more manageable and easier to read on the chart.
Time Offset Feature
A key feature of the script is the time offset. With the input parameter "Time Offset (days)", the user can shift the plotted index line by a specific number of days. The script converts the given offset in days into a number of bars based on the current chart's timeframe. This allows you to adjust for the delay between liquidity changes and their effect on asset prices.
Overall, the indicator plots a line on your chart representing the global liquidity and money supply index, allowing you to visually monitor trends and better understand how liquidity and central bank actions may influence market movements.
What makes this script different from others?
Every supported market—both major regions (USA, Eurozone, China, Japan, etc.) and additional ones—is available. You can toggle each series on or off, so you can view only Money Supply data, only Central Bank Liquidity, or any custom combination.
Separated Data Groups. Inputs are organized into clear groups (“Money Supply”, “Other Money Supply”, “Central Bank Liquidity”), making it easy to focus on just the data you need without clutter.
True Day‑Based Offset. This script converts your chosen “Time Offset (days)” into actual days regardless of timeframe. Whether you’re on a 5‑minute or daily chart, the index is always shifted by exactly the number of days you specify.

Global (World) Monetary Supply M2 (measured in USD)This is the Global Monetary Supply M2 of the richest and most populous countries that have info from at least 2008
It is measured in USD (converting the M2 of each of the countries respective currencies and virtually converting them into USD)
This is less than the global liquidity as it does not include the countries' assets in other currencies (on their balance sheets), it only focuses on the monetary supply of each of the countries own currencies.

Global Monetary Supply M2 Vs the Global GDP This indicator compares the Global (world) Monetary Supply (measured in USD) compared to the Global GDP.
This can be useful to measure the "money printing speed" of the world compare to the "world gdp growth", the higher the slope (angle of growth) the more money printing.
It includes the exact same countries of the Global M2 indicator (done by me), to make fair the comparison, which has the richest and most populous countries so to have a clear overview.
There tough a few very populated countries excluded, the details can be found on the Global M2 indicator script and reason for exclusion.
Enjoy!

Inflation Adjusted Performance: Ticker/M2 money supplyPlots current ticker / M2 money supply, to give an idea of 'inflation adjusted performance'.
~In the above, see the last decade of bullish equities is not nearly as impressive as it seems when adjusted to account for the FED's money printing.
~Works on all timeframes/ assets; though M2 money supply is daily data release, so not meaningful to plot this on timeframe lower than daily.
~To display on same pane; comment-out line 6 and un-comment line 7; then save, remove and re-add indicator.
~Scale on the right is meaningless; this indicator is just to show/compare the shape of the charts.

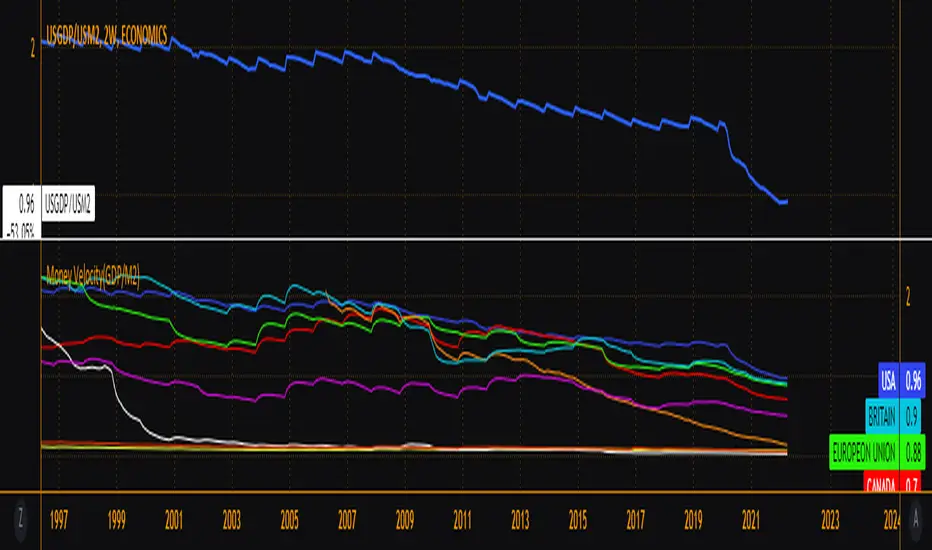
Money Velocity(GDP/M2)V=GDP/M2
Major world economy's money supply velocity. Compare how each country's monetary policy has played out and current trajectory in comparison to others. The velocity of money is a measure of the number of times that the average unit of currency is used to purchase goods and services within a given time period. The concept relates the size of economic activity to a given money supply, and the speed of money exchange is one of the variables that determine inflation.
M2 Growth Rate vs Borrowing RateHave you ever wondered how fast M2 is actually growing? Have you ever wanted to compare its percentage growth rate to the actual cost of borrowing? Are you also, like me, a giant nerd with too much time on your hands?
M2 Growth Rate vs Borrowing Rate
This Pine Script indicator analyzes the annualized growth rate of M2 money supply and compares it to key borrowing rates, providing insights into the relationship between money supply expansion and borrowing costs. Users can select between US M2 or a combined M2 (aggregating US, EU, China, Japan, and UK money supplies, adjusted for currency exchange rates). The M2 growth period is customizable, offering options from 1 month to 5 years for flexible analysis over different time horizons. The indicator fetches monthly data for US M2, EU M2, China M2, Japan M2, UK M2, and exchange rates (EURUSD, CNYUSD, JPYUSD, GBPUSD) to compute the combined M2 in USD terms.
It plots the annualized M2 growth rate alongside borrowing rates, including US 2-year and 10-year Treasury yields, corporate bond effective yield, high-yield bond effective yield, and 30-year US mortgage rates. Borrowing rates are color-coded for clarity: red if the rate exceeds the selected M2 growth rate, and green if below, highlighting relative dynamics. Displayed on a separate pane with a zero line for reference, the indicator includes labeled plots for easy identification.
This tool is designed for informational purposes, offering a visual framework to explore economic trends without providing trading signals or financial advice.
M2 Liquidity Divergence ModelM2 Liquidity Divergence Model
The M2 Liquidity Divergence Model is a macro-aware visualization tool designed to compare shifts in global liquidity (M2) against the performance of a benchmark asset (default: Bitcoin). This script captures liquidity flows across major global economies and highlights whether price action is aligned ("Agreement") or diverging ("Divergence") from macro trends.
🔍 Core Features
M2 Global Liquidity Index (GLI):
Aggregates M2 money supply from major global economies, FX-adjusted, including extended contributors like India, Brazil, and South Africa. The slope of this composite is used to infer macro liquidity trends.
Lag Offset Control:
Allows the M2 signal to lead benchmark asset price by a configurable number of days (Lag Offset), useful for modeling the forward-looking nature of macro flows.
Gradient Macro Context (Background):
Displays a color-gradient background—aqua for expansionary liquidity, fuchsia for contraction—based on the slope and volatility of M2. This contextual backdrop helps users visually anchor price action within macro shifts.
Divergence Histogram (Optional):
Plots a histogram showing dynamic correlation or divergence between the liquidity index and the selected benchmark.
Agreement Mode: M2 and asset are moving together.
Divergence Mode: Highlights break in expected macro-asset alignment.
Adaptive Transparency Scaling:
Histogram and background gradients scale their visual intensity based on statistical deviation to emphasize stronger signals.
Toggle Options:
Show/hide the M2 Liquidity Index line.
Show/hide divergence histogram.
Enable/disable visual offset of M2 to benchmark.
🧠 Suggested Usage
Macro Positioning: Use the background context to align directional trades with macro liquidity flows.
Disagreement as Signal: Use divergence plots to identify when price moves against macro expectations—potential reversal or exhaustion zones.
Time-Based Alignment: Adjust Lag Offset to synchronize M2 signals with asset price behavior across different market conditions.
⚠️ Disclaimer
This indicator is designed for educational and analytical purposes only. It does not constitute financial advice or an investment recommendation. Always conduct your own research and consult a licensed financial advisor before making trading decisions.

M2 Suite [KFB Quant]M2 Suite
The M2 Suite is a specialized technical indicator designed to analyze global M2 money supply data from major economies (US, EU, China, and Japan). It aggregates this macroeconomic data and transforms it into actionable insights for crypto trading, assisting with trend-following strategies on a 1D timeframe. By leveraging M2 money supply changes as an economic signal, the M2 Suite highlights potential long and short opportunities based on market liquidity trends.
Functionality:
The M2 Suite aggregates global M2 money supply data, normalizing it to USD for comparability. It calculates percentage changes over multiple timeframes (30–360 days) and averages these changes to score the strength and direction of the M2 trend. With customizable smoothing options, users can tailor the indicator to suit their trading style.
Signal Modes:
Users can choose from three signal modes for maximum flexibility:
Standard – Displays raw trend signals without smoothing.
Smoothed – Applies user-selected smoothing (EMA, SMA, or WMA) for cleaner signals.
Combined – Provides both standard and smoothed signals for a complete picture.
Indicator Features:
Thresholds: Define long and short entry points using customizable score and percentage change thresholds.
Signal Smoothing: Adjust signal clarity with selectable smoothing methods and lengths.
Visual Enhancements: Features gradient-colored signal lines, dynamic background shading, and labeled signal markers for enhanced chart readability.
Limitations:
The M2 Suite is intended for crypto markets and performs best on the 1D timeframe due to the daily data it requests. It should be used as part of a broader trading strategy, as it reflects historical macroeconomic trends and doesn’t predict future movements. Additionally, past results do not guarantee future performance.
Disclaimer: This tool is provided for informational and educational purposes only and should not be considered as financial advice. Always conduct your own research and consult with a licensed financial advisor before making any investment decisions.

M2 Global Liquidity Index - 10 Week Lead
M2 Global Liquidity Index - Forward Projection (10 Weeks)
This indicator provides a 10-week forward projection of the M2 Global Liquidity Index, offering traders insight into potential future market conditions based on global money supply trends.
What This Indicator Shows
The M2 Global Liquidity Index aggregates M2 money stock data from five major economies:
- China (CNY)
- United States (USD)
- European Union (EUR)
- Japan (JPY)
- Great Britain (GBP)
All values are converted to USD and presented as a unified global liquidity metric, providing a comprehensive view of worldwide monetary conditions.
Forward Projection Feature
This adaptation displays the indicator 10 weeks ahead of the current price, allowing you to visualize potential future liquidity conditions that might influence market behavior. The projection maintains data integrity while providing an advanced view of the liquidity landscape.
Trading Applications
- Anticipate potential market reactions to changing global liquidity conditions
- Identify divergences between projected liquidity and current price action
- Develop longer-term strategic positions based on forward liquidity projections
- Enhance your macro-economic analysis toolkit
Credit
This indicator is an adaptation of the original "M2 Global Liquidity Index" created by Mik3Christ3ns3n. Full credit for the original concept and implementation goes to the original author. This version simply adds a 10-week forward projection to the existing calculations.
Disclaimer
This indicator is for informational purposes only and should be used as one of many tools in your analysis. Past performance and projections are not guarantees of future results.

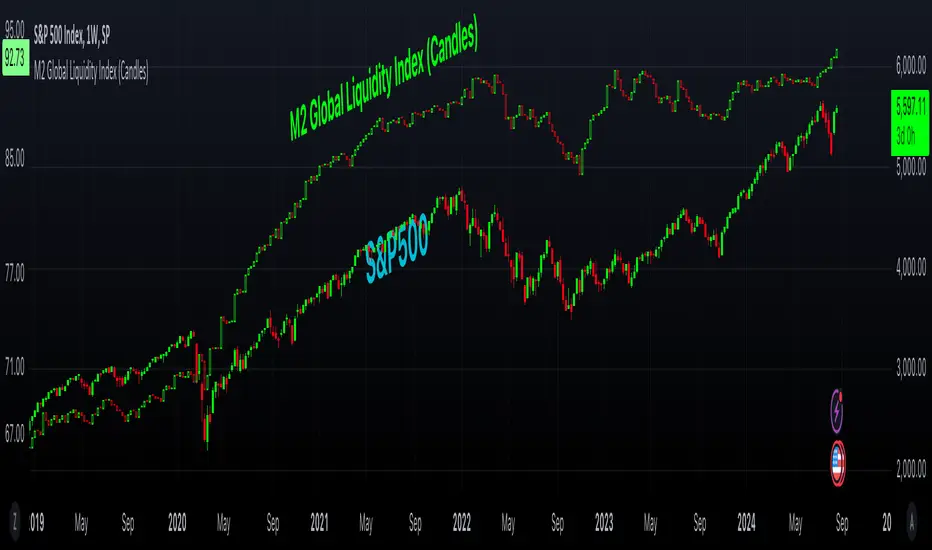
M2 Global Liquidity Index (Candles)M2 Global Liquidity Index (Candles)
In this enhanced version of the original M2 Global Liquidity Index script by Mik3Christ3ns3n , I've taken the foundational concept and expanded its capabilities for more in-depth analysis and user flexibility. This updated script aggregates M2 money supply data from major global economies—China, the U.S., the Eurozone, Japan, and the U.K.—adjusted by their respective exchange rates, into a customizable global liquidity index.
Key Enhancements:
Candlestick Visualization:
• Instead of a simple line chart, I've implemented a candlestick chart, providing a more detailed representation of liquidity trends with open, high, low, and close values for each period. This allows traders to analyze the index with the same technical tools used for price charts.
Customizable Components:
• Users can now select which components (M2 data and exchange rates) to include in the index calculation, giving you the flexibility to tailor the index to specific economic factors or regions of interest.
Dynamic Color Coding:
• Candles are color-coded based on their performance (bullish or bearish), with customized wick and border colors to enhance visual clarity, making it easier to spot liquidity trends at a glance.
Overlay Option:
• This script is designed to be an overlay, allowing you to plot the Global Liquidity Index directly on your price charts, facilitating comparison between liquidity trends and asset prices.
This enhanced script is ideal for traders and analysts who want a deeper understanding of global liquidity trends and their impact on financial markets.