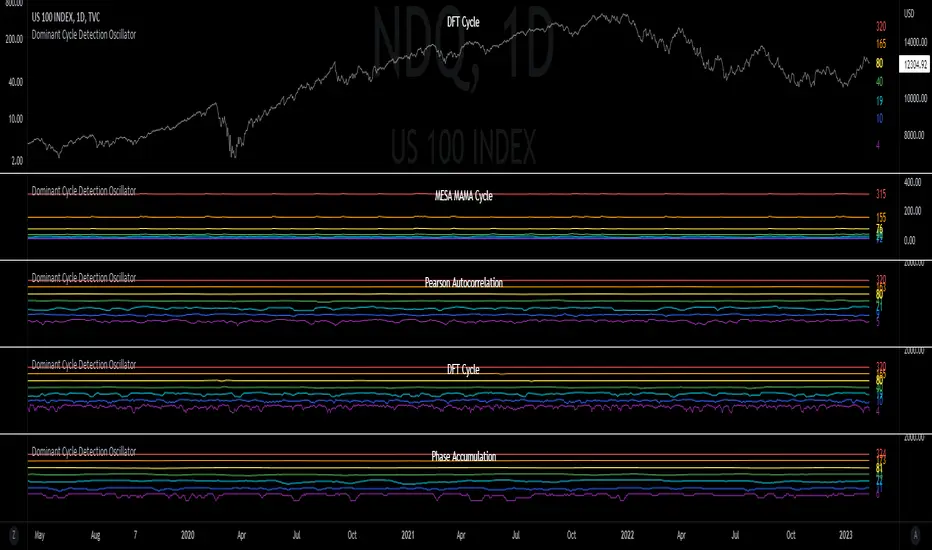
Dominant Cycle Detection OscillatorThis is a Dominant Cycle Detection Oscillator that searches multiple ranges of wavelengths within a spectrum. Choose one of 4 different dominant cycle detection methods (MESA MAMA cycle, Pearson Autocorrelation, Discreet Fourier Transform, and Phase Accumulation) to determine the most dominant cycles and see the historical results. Straight lines can indicate a steady dominant cycle; while Wavy lines might indicate a varying dominant cycle length. The steadier the cycle, the easier it may be to predict future events in that cycle (keep the log scale in mind when considering steadiness). The presence of evenly divisible (or harmonic) cycle lengths may also indicate stronger cycles; for example, 19, 38, and 76 dominant lengths for the 2x, 4x, and 8x cycles. Practically, a trader can use these cycle outputs as the default settings for other Hurst/cycle indicators. For example, if you see dominant cycle oscillator outputs of 38 & 76 for the 4x and 8x cycle respectively, you might want to test/use defaults of 38 & 76 for the 4x & 8x lengths in the bandpass, diamond/semi-circle notation, moving average & envelope, and FLD instead of the defaults 40 & 80 for a more fine-tuned analysis.
Muting the oscillator's historical lines and overlaying the indicator on the chart can visually cue a trader to the cycle lengths without taking up extra panes. The DFT Cycle lengths with muted historical lines have been overlayed on the chart in the photo.
The y-axis scale for this indicator's pane (just the oscillator pane, not the chart) most likely needs to be changed to logarithmic to look normal, but it depends on the search ranges in your settings. There are instructions in the settings. In the photo, the MESA MAMA scale is set to regular (not logarithmic) which demonstrates how difficult it can be to read if not changed.
In the Spectral Analysis chapter of Hurst's book Profit Magic, he recommended doing a Fourier analysis across a spectrum of frequencies. Hurst acknowledged there were many ways to do this analysis but recommended the method described by Lanczos. Currently in this indicator, the closest thing to the method described by Lanczos is the DFT Discreet Fourier Transform method.
Shoutout to @lastguru for the dominant cycle library referenced in this code. He mentioned that he may add more methods in the future.
在腳本中搜尋"美股科技股4月19日走势"
Market Crashes/Chart Timeframes HighlightThis extremely helpful indicator allows you to highlight 7 custom date-based timeframes on your charts.
The default dates selected are what I consider to be the most significant 7 most recent market declines, including and since the 87 flash crash.
Note: The default dates are approximate but good enough to highlight the key timeframes of these pullbacks/crashes/corrections.
It's simple to use and does exactly what it should.
I created this indicator to make it easier when looking at the overall story of a chart. I found it helpful to highlight these areas to see how a market or equity has responded during these significant market pullbacks.
The highlight alone I’ve found helpful, and it becomes more powerful if you combine it with your own trusted trade system.
Also, to get the most out of using the default dates it’s important to understand the narrative behind each pullback/crash. Here’s the list of what I consider significant pullbacks:
Black Monday - Oct 87
1990s Recession - Jul 90 to Mar 91
Dot Com Bubble - 2000 to 2002 or so
Real Estate 2008 Crisis - I choose 2007-2009 to cover full insider knowledge and aftermath
2016 - 2018 - This isn't seen as a pullback, but I have it as significant because in many markets and equities, this was an almost equal percentage pullback as 2008. See Notes below
2020 Crash - Covid-19 and related shenanigans pullback
April 2021 to August 2022 - I believe we are in a current SHORT cycle so I've highlighted April 2021 as the start of what might be the start of a major decline testing Dot Com or lower levels.
A few notes on the above.
You'll find on most of the pullbacks listed above most equities and related markets behave similarly or have similar patterns.
The 2016-18 pullback is the most difficult to track. For instance, GE in this timeframe had a -80% decline, whereas BA depending on how you want to measure it had a 50-110% gain.

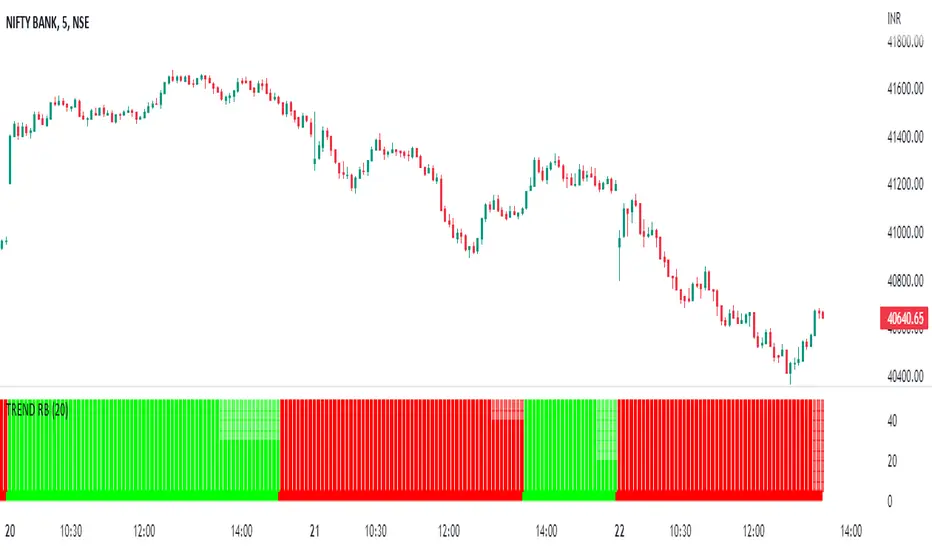
TREND RBReduce Fake Signals, and identify the trend and use as double confirmation
How Does it work ?
- it calculates main trend direction by using the length that is user-defined. so you can change it as you wish
- then it calculates trend direction for each 9 lower lengths. if you set the length = 20 then the lengths are 19, 18,...11
- and it checks if the trend directions that came from lower lengths is same or not with main trend direction.
- it changes the trend color of the ribbon.
A_HMS_EMAsthis is an indicator that have many essentials in one indicator and prevent from adding many indicator in chart
Ichimoko clouds and 4 ema from number 19 , 33 , 66 , 199
and an spatial average ema with 2 color that help you to find trend
Histomentu is a great Indicator that combine RSI Composit by RSi line and show momentum of price movement by a histogram
for better use note that:
red line is composite line
green line is rsi line
when composite line run away from histogram momemtum increase rapidly
when composite and rsi line is in same way its time to get position .
some futures is hidden by default:
composite red and green signal line
rmi of price with to color with momentum 4
ema 13, 33 of rmi as signal line
finaly u can change any colors from setting
in background we determine some fills for better use of Indicator
for better use note that:
1_pivots show with tiny triangles bellow and above the candles
red triangles for hi pivots and green triangles for low povots
2_ema19 , 66 , 199 shown on chart by default and you can change its source or length from settings
3- ichimoko cloud help you to determine demand and supply zones that those points are price target to go.

Bitcoin Golden Pi CyclesTops are signaled by the fast top MA crossing above the slow top MA, and bottoms are signaled by the slow bottom MA crossing above the fast bottom MA. Alerts can be set on top and bottom prints. Does not repaint.
Similar to the work of Philip Swift regarding the Bitcoin Pi Cycle Top, I’ve recently come across a similar mathematically curious ratio that corresponds to Bitcoin cycle bottoms. This ratio was extracted from skirmantas’ Bitcoin Super Cycle indicator . Cycle bottoms are signaled when the 700D SMA crosses above the 137D SMA (because this indicator is closed source, these moving averages were reverse-engineered). Such crossings have historically coincided with the January 2015 and December 2018 bottoms. Also, although yet to be confirmed as a bottom, a cross occurred June 19, 2022 (two days prior to this article)
The original pi cycle uses the doubled 350D SMA and the 111D SMA . As pointed out this gives the original pi cycle top ratio:
350/111 = 3.1532 ≈ π
Also, as noted by Swift, 111 is the best integer for dividing 350 to approximate π. What is mathematically interesting about skirmanta’s ratio?
700/138 = 5.1095
After playing around with this for a while I realized that 5.11 is very close to the product of the two most numerologically significant geometrical constants, π and the golden ratio, ϕ:
πϕ = 5.0832
However, 138 turns out to be the best integer denominator to approximate πϕ:
700/138 = 5.0725 ≈ πϕ
This is what I’ve dubbed the Bitcoin Golden Pi Bottom Ratio.
In the spirit of numerology I must mention that 137 does have some things going for it: it’s a prime number and is very famously almost exactly the reciprocal of the fine structure constant (α is within 0.03% of 1/137).
Now why 350 and 700 and not say 360 and 720? After all, 360 is obviously much more numerologically significant than 350, which is proven by the fact that 360 has its own wikipedia page, and 350 does not! Using 360/115 and 720/142, which are also approximations of π and πϕ respectively, this also calls cycle tops and bottoms.
There are infinitely many such ratios that could work to approximate π and πϕ (although there are a finite number whose daily moving averages are defined). Further analysis is needed to find the range(s) of numerators (the numerator determines the denominator when maintaining the ratio) that correctly produce bottom and top signals.

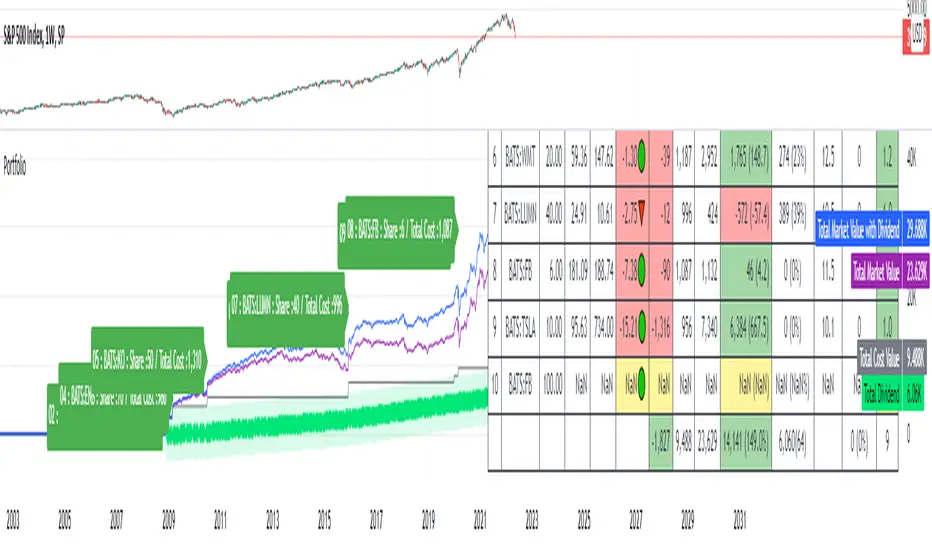
Portfolio SummaryThe stocks in my portfolio has very poor performance since the FED hiked the rate.
since the covid-19, i came to the stock market and buy a stock that i ever heard the name which i don't even know its fundamental.
Some stock, i bought them at the hilltop (and sell at the bottom, hehe).
Everyone is a genius in a bull market ; and now i realized i am gonna loss money.
I have to do something, so i looked for an indicator that allow me to manage my portfolio.
unfortunately, i cannot find one that fit me.
so i make this indicator.
How you can get the benefit from this indicator
This indicator will summarize the gain/loss since you bought the stock.
it also include the dividend.
So that you can see how much you gain and loss, and make a decision as you wish.
How to use it
1. Input some neccessary data like ticker/stock (up to 20 tickers, yeah i know, it is too much), share, average price which you can input manually or depend on your entry date.
2. The indicator will calculate gain/loss, dividend, % of your portfolio.
3. You can select how to display based on "Index" or "Market Value".
4. You can toggle on/off both label and table.
Disclaimer
This indicator may display inaccurate and need a lot of improvement.
pls use carefully.
if you have any suggestion, pls dont hersitate to comment below.
Enjoy.
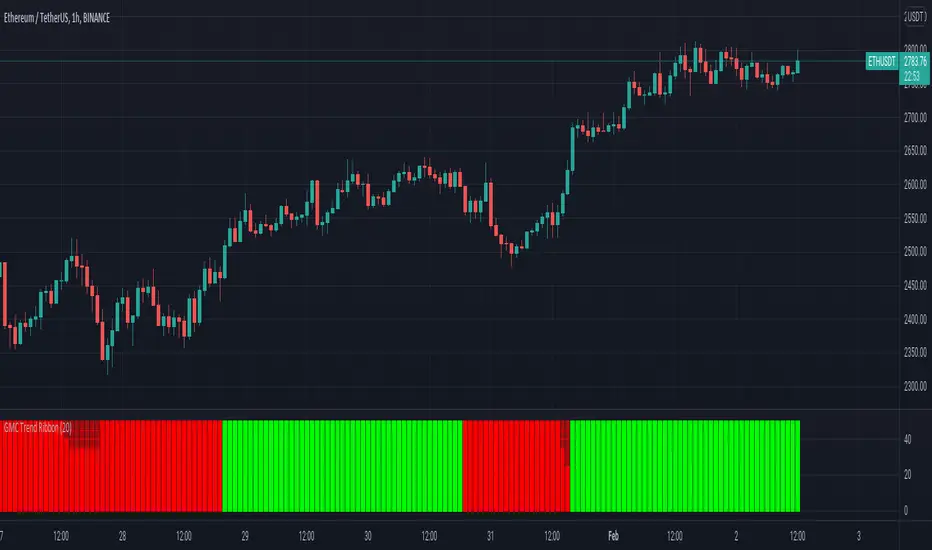
GMC Trend FilterAvoid Fake Signals, and identify the trend.
How it works ?
- it calculates main trend direction by using the length that is user-defined. so you can change it as you wish
- then it calculates trend direction for each 9 lower lengths. if you set the length = 20 then the lengths are 19, 18,...11
- and it checks if the trend directions that came from lower lengths is same or not with main trend direction.
- it changes the trend color of the ribbon.
Simple Daily Weekly Monthly YearlySimple price line of the previous daily, weekly, monthly, and yearly opens and closes.
By default your will get the open and close of the last period of the time frame. If you're in March, you will get the open and close of Febraury. If it is calendary day 20, you will get the open and close of day 19 (or previous market day).
Script can be modified to see the most recent opens and closes by switching the period on a desired time range to 0. This will make so that if you're in March, you will get the open of March and it's most recent close price even if the month isn't over.
Colors can be changed to your liking via the settings for the indicator.
To show the price labels on your y-axis, go to Main Chart Settings -> Scales -> "Last Value Indicator Label" and click the checkbox. Also, might be helpful to check the "Indicator Name Label" under the same settings.
The line plots need to be completely transparent, otherwise they will show up and crowd the price chart.

MathConstantsElectromagneticLibrary "MathConstantsElectromagnetic"
Mathematical Constants
ElementaryCharge() Elementary Electron Charge: e = 1.602176487e-19 (2007 CODATA)
MagneticFluxQuantum() Magnetic Flux Quantum: theta_0 = h/(2*e) (2007 CODATA)
ConductanceQuantum() Conductance Quantum: G_0 = 2*e^2/h (2007 CODATA)
JosephsonConstant() Josephson Constant: K_J = 2*e/h (2007 CODATA)
VonKlitzingConstant() Von Klitzing Constant: R_K = h/e^2 (2007 CODATA)
BohrMagneton() Bohr Magneton: mu_B = e*h_bar/2*m_e (2007 CODATA)
NuclearMagneton() Nuclear Magneton: mu_N = e*h_bar/2*m_p (2007 CODATA)

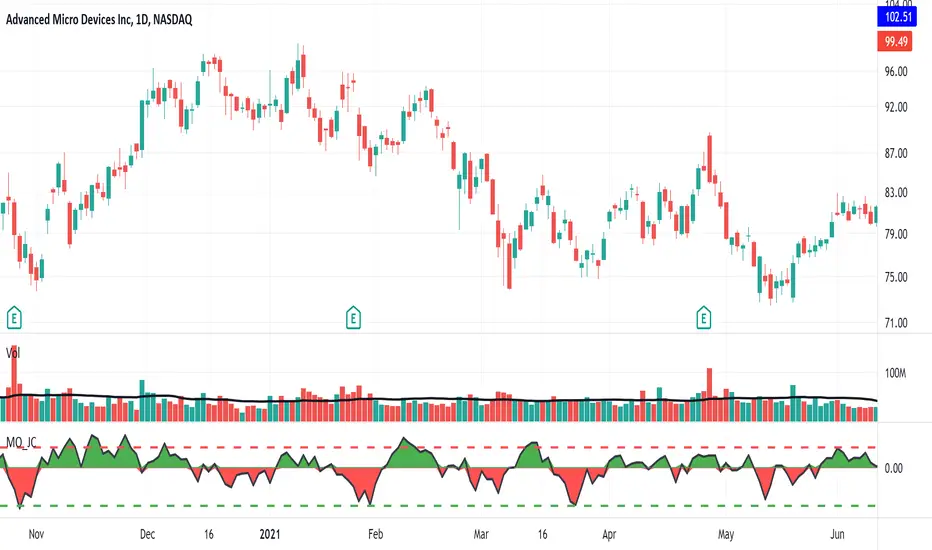
McClellan Oscillator Jack Corsellis [LazyBear Modified]Developed by Sherman and Marian McClellan, the McClellan Oscillator is a breadth indicator derived from Net Advances, the number of advancing issues less the number of declining issues.
Subtracting the 39-day exponential moving average of Net Advances from the 19-day exponential moving average of Net Advances forms the oscillator.
As the formula reveals, the McClellan Oscillator is a momentum indicator that works similar to MACD .
McClellan Oscillator signals can be generated with breadth thrusts, centerline crossovers, overall levels and divergences.
The original code was written by LazyBear ( code here: )
We have modified this code:
1. Added the ability to display and configure the overbought and undersold lines which are key to properly using this indicator. These are set to default +40 and -75 respectively.
2. This version uses USI:ADV(advances- issues) and USI:DECL (declines - issues) as the default.
Optimized Keltner Channels SL/TP Strategy for BTCThis strategy is optimized for Bitcoin with the Keltner Channel Strategy, which is TradingView's built-in strategy. In the original Keltner Channel Strategy, it was difficult to predict the timing of entry because the Buy and Sell signals floated in the middle of the candle in real time. This strategy is convenient because if the bitcoin price hits the top or bottom of the Keltner Channel and closes the closing price, you can enter Buy or Sell at the next candle start price. In addition, this strategy provides Stop Loss and Take Profit functions to maximize profit.
_________________________________
Recommended settings are below.
- length: 9
- multiplier: 1
- source: close
- (v) Use EMA
- Bands Style: Average True Range
- ATR Length: 19
- Stop Loss (%): 20
- Take Profit (%) : 20
_________________________________
- length: 9
- multiplier: 1
- source: close
- (v) Use EMA
- Bands Style: Average True Range
- ATR Length: 18
- Stop Loss (%): 20
- Take Profit (%) : 5
_________________________________
▶ Usefulness and Originality
- Stop Loss and Take Profit functions are available
- Convenient Buy and Sell entry compared to the original Keltner Channel Strategy
- Optimized for BTCUSD market (maximizing profits)
___________________________________________
이 전략은 TradingView의 Built-in 전략인 Keltner Channel Strategy를 비트코인에 맞게 최적화되었습니다. 기존의 Keltner Channel Strategy는 Buy, Sell 신호가 캔들 중간에 실시간으로 떠서 진입 시점을 예측하기 어려운 불편함이 있었지만 이 전략은 비트코인 가격이 Keltner Channel 상단 혹은 하단을 찍고 종가를 마감하면 그 다음 캔들 시작가에서 Buy 혹은 Sell 진입이 가능하여 편리합니다. 또한, 이 전략은 Keltner Channel을 만나서 캔들을 마감한 가격 (bprice, sprice)을 시각적으로 plot을 제공하여 타점 및 차트를 보기에 편리하며 손절가 및 목표가를 지정한 백테스팅이 가능합니다.

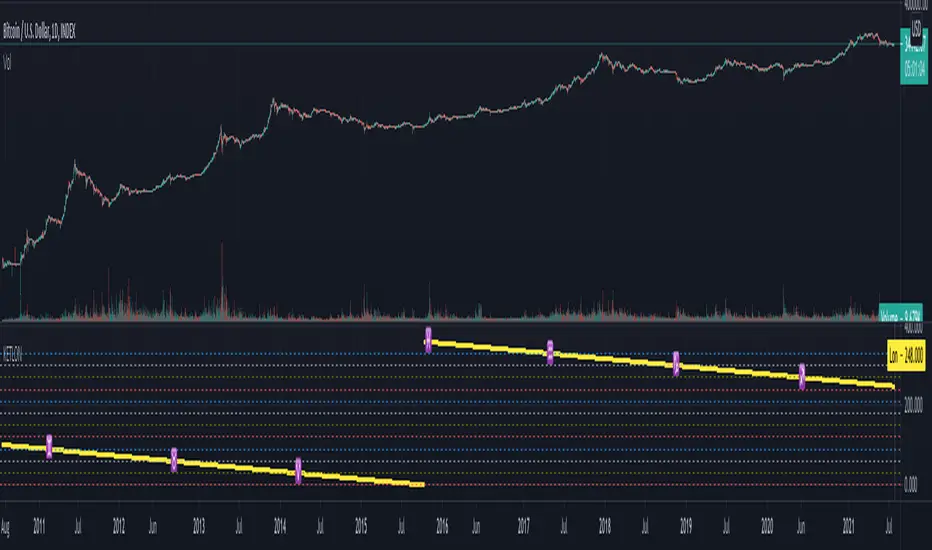
Financial Astrology South Node (Ketu) LongitudeSouth Node (Ketu) in Vedic astrology is considered to cause a bear trend when Eclipse occurs at this Moon Node. Moon Nodes are important because when Moon and Sun are in conjunction or opposition very close to the degree of a Moon's Node, a Solar or Lunar eclipse occurs.
The effect of the trend will be coloured by the Moon Node zodiac sign position. Based on statistical research we have noted that the periods where South Node (Ketu) was located in Sagittarius the trend was bullish 56% of the days, in Aquarius 54% of the days and in Pisces 62% of the days. When located at Aries was bearish 51% of the days. The other zodiac signs experienced mixed results that don't show a clear pattern.
Consider that the transition of South Node across all the Zodiac signs takes 19 years so in all BTCUSD historical prices, we don't have a complete revolution yet, for this reason, our understanding of all the energy frequencies related to South Node location are incomplete.
Note: The South Node (Ketu) longitude indicator is based on an ephemeris array that covers years 2010 to 2030, prior or after this years the data is not available, this daily ephemeris are based on UTC time so in order to align properly with the price bars times you should set UTC as your chart timezone.
Financial Astrology North Node (Rahu) LongitudeThe Moon Nodes are the points where Moon crosses the ecliptic and transition from North to South latitude, North Node (Rahu) in Vedic astrology is considered to cause a bull trend when Eclipse occurs at this Moon node. Moon nodes are important because when Moon and Sun are in conjunction or opposition close very close to the degree of a Moon Node, then a Solar or Lunar eclipse occurs.
The effect of the trend will be coloured by the Zodiac sign where the Moon Node is located at, based on statistical research we have noted that the periods where North Node (Rahu) was located in Geminis the 56% of days was bullish, in Virgo 62% of the days was bullish. The most bearish location was Libra with 51% of days bearish. However the transition of North Node around all the Zodiac takes 19 years so in all BTCUSD price history we don't have yet a complete revolution to have a complete understanding of all the energy frequencies.
Note: The North Node (Rahu) longitude indicator is based on an ephemeris array that covers years 2010 to 2030, prior or after this years the data is not available, this daily ephemeris are based on UTC time so in order to align properly with the price bars times you should set UTC as your chart timezone.

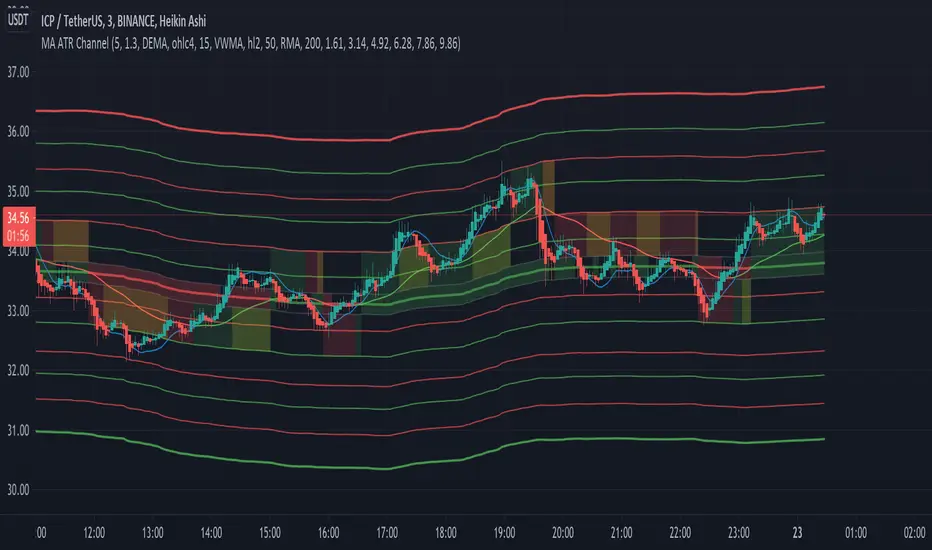
[EG] MA ATR ChannelsGreetings - the aim of this indicator was to code a single indicator with a selectable moving average, so I could examine price relationships to MA's and Average True Range (ATR) bollinger type bands. You can obviously approach this tool in so many different ways so I am going to share first an overview of moving averages and a short overview of how I use this this indicator.
Simple ( SMA ) – A simple average of the past N (length) prices. Just add the price data for each N (bar) and divide the total by N.
Exponential ( EMA ) – An exponential moving average with a greater weight for recent prices. The weighting is exponential. An N-period EMA takes more than N data points into account and gradually dilutes past data’s effect.
Double Exponential ( DEMA ) - Same as an EMA , the Double exponential moving average , or DEMA , is a measure of a security's trending average price that gives the even more weight to recent price data. Aimed to help reduce lag.
Triple Exponential ( TEMA ) - Same as an EMA , the Triple exponential moving average , or TEMA , is a measure of a security's trending average price that gives the even more weight to recent price data than EMA or DEMA . Aimed to help reduce lag.
Weighted ( WMA ) – An average of the past N prices with a linear weighting, again giving greater weight to more recent prices.
Hull ( HMA ) - The Hull Moving Average (developed by Alan Hull) has the purpose of reducing lag, increasing responsiveness while at the same time eliminating noise. It emphasises recent prices over older ones, resulting in a fast-acting yet smooth moving average that can be used to identify the prevailing market trend.
Wilder's (RMA) - Wilder's smoothing is a type of exponential moving average . It takes one parameter, the period n, and price. Larger values for n will have a greater smoothing effect on the input data but will also create more lag. It is equivalent to a 2n-1 Exponential Moving Average . For example, a 10 period Wilder's smoothing is the same as a 19 period exponential moving average .
Symmetrically Weighted ( SWMA ) - Weight distribution starts from median of given period and it's reduced linearly to the sides so the ending and starting point of period have the least weight. It's smooth and fast but reacts late to trend changes on higher lengths (lookback).
Arnaud Legoux ( ALMA ) - Arnaud Legoux Moving Average removes small price fluctuations and enhances trend via applying a moving average twice, once from left to right, and once from right to left and combines both. At the end of this process the phase shift (price lag) commonly associated with moving averages is significantly reduced.
Volume-Weighted ( VWMA ) - A Volume-Weighted Moving Average gives a different weight to each closing price and this weight depends on the volume of that period. For example, the closing price of a day with high volume will have a greater weight on the moving average value.
Volume Weighted Average Price ( VWAP ) - Though not necessarily a MA - Volume-weighted average price ( VWAP ) is a ratio of the cumulative share price to the cumulative volume traded over a given time period and so I thought would be useful as an ATR tool. The VWAP is calculated using the opening price for each day and adjusting in real time right up until the close of the session. Thus, the calculation uses intraday data only.
So what is Average True Range ?
Average True Range is a measure of volatility . It's an area that represents roughly how much you can expect a security to change in price over a time period. Average true range is usually calculated by applying Wilders Smoothing to True Range. If you want regular ATR - use RMA as the input for the ATR. The ATR is then divided into periods based on derivatives of Phi (3.14) and Fibs (0.618, 1.618 etc.) You will notice price bounces off the lines. Look for patterns.
The indicator - consisting of 3 parts:
Price/Fast MA - this is an MA anywhere between 3-20 periods that is reflective of very recent price action. It is red when price is below - and green when above. Recommendations : SMA , EMA , WMA , HMA
Trend/Medium MA - this is a slower MA that you could set anywhere between 30 - 100 periods that is reflective of overall bull/bear market trend depending on both it's direction and whether the Price MA / price is lower or higher. Recommendations: EMA , WMA , VWMA , RMA, ALMA
Average True Range - this is a way to measure and visualise range the price may be capable of in - if it is towards or below the 2.1 multiplier - a bull reversal is more likely and vice versea. The multi's are set to factors of Pi and Fibonacci ratio's. Green channel means bullish, red channel means bearish. Gold means sign of a likely reversal. If the PMA enters the channel - it is likely the reversal is cancelled for a short period more.
Recommendations : RMA, EMA , VWMA , ALMA , SWMA , VWAP
How I use it :
First of all - Consider longs when channel is green - or going to bounce on a support line - and consider shorts based on the opposite. This is not a buy/sell indicator - this is a MAP to PRICE to give reference and meaning to price movements across multiple time frames - very useful when using with a volume indicator and an RSI. I personally use it on the 3m chart but change the TFM to 5 for 15m data.
If you wish to see any other more exotic or interesting MA's added please feel free to request them in the comments ! And thanks for checking out my first indicator
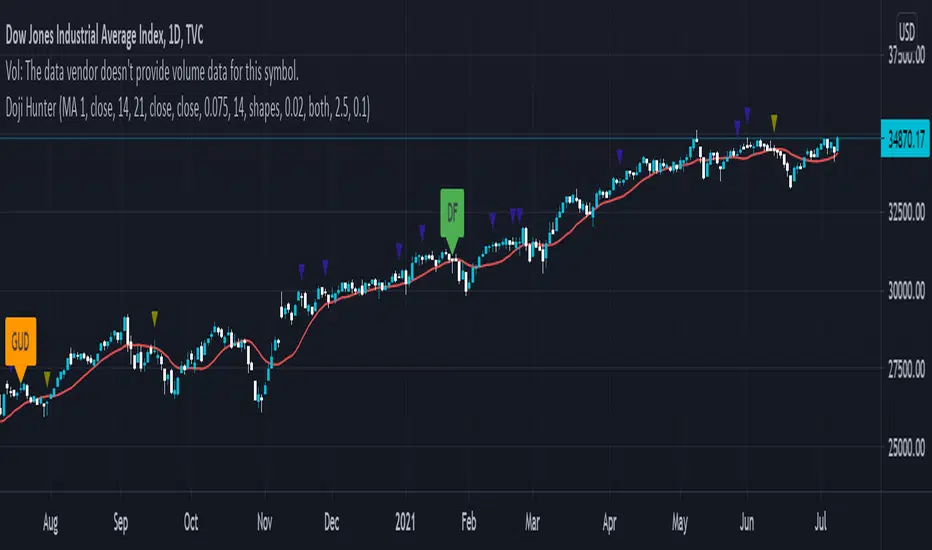
Doji Hunter█ OVERVIEW
This script is built to search for 8 different Doji candlestick patterns in markets and makes them appear on screen with bar coloring and creating color-coded labels/shapes. It will identify the following variants based upon user input for various rules to abide by:
Gapping Up
Gapping Down
Gravestone
Dragonfly
Long-Legged
Rickshaw Man
Northern (Doji in uptrend)
Southern (Doji in downtrend)
Note: for the remainder of this description, the types for inputs will be marked by italic text.
█ OPTIONS
This script features a wide range of options available to the user to modify how it functions. The first set of inputs dictate how the trend analysis is done with moving averages. The second and third sets of inputs dictate specific rules for how Doji candles are analyzed and the colors used for when they appear.
█ INPUTS (short)
1 — Moving Average Rules:
The Northern and Southern Doji variants require some trend analysis which will be done by Moving Averages. The inputs in this section change various things about the moving average(s) to be used. In the second section of inputs, there is one boolean option that will nullify the need for trend detection and consolidates the Northern and Southern Doji variants into one.
2/3 — Doji Rules and Colors:
The next two sections of inputs correspond to the various rules that dictate how various doji variants will be analyzed, as well as the colors that correspond to each variant. The colors will also apply to each of the labels/shapes used.
4 — Diagnostics:
The last boolean will allow the user to see extra detail with regards to how and when dojis are detected. Note: This is not a part of any prior section and is simply included as a last functional item to the list of all inputs.
An example of multiple labels being shown on screen for various types of Dojis (DJI 1D chart):
█ INPUTS (extended)
1 — Moving Average Rules:
This section consists of 10 different inputs specific to the rules on how the moving average functions for trend analysis.
"Trend Rule" ( string list) determines which Moving Average will be used for trend detection. It has 3 options: "MA 1", "MA 2", or "BOTH". The second input "Trend Source" determines which OHLC (or combination) value to use in comparison to either MA 1 or MA 2 (EX: Trend Rule -> "MA 1" and Trend Source -> "close": if close > MA 1 -> uptrend, downtrend otherwise). If "BOTH" is selected then "Trend Source" is ignored and added nuance in the script ensures that the shorter MA being above the longer MA yields an uptrend (downtrend otherwise).
The next 8 inputs focus on 4 different parts of both MA 1 and 2.
Length ( integer(s) )
Color
Switch between SMA/EMA ( boolean(s) )
Source for MA
Note: Additional attention to detail has been made here as trend direction is ignored if "BOTH" is selected for the MA Rules and the lengths of both Moving Averages are set to be the same.
2/3 — Doji Rules and Colors:
The next two sections include 19 inputs that are related to how this script will analyze and identify the different variants of Doji candles.
"Identify Pattern On Close" ( boolean ) modifies which candles are to be used for determining when Doji candles are recognized. This changes an offset used for historical reference on some global variables which will force the script to only identify patterns after the current candle has closed.
"Doji Body Tolerance" ( float ) tells the script the maximum % the candle body may be of the high-low range to be considered a Doji candle.
"Doji Wick Sample" ( integer ) defines how many prior candles to sample from in calculating the current average upper and lower wick sizes.
"Simplify Northern/Southern Dojis" ( boolean ) makes this script ignore trend direction for Doji detection and consolidates Northern and Southern Dojis into being recognized as the same. This has an added effect of removing the plotted moving averages from the screen.
"Northern/Southern Display" ( string list ) that has multiple options for how Northern and Southern Dojis will be displayed on screen. Because of how labels may be extremely taxing on TradingView's servers to display, the default setting is "shapes" where Northern and Southern (N/S) Dojis will be marked with a colored triangle at the top of the candle. If "Simplify Northern/Southern Dojis" is true, all N/S Dojis will be marked with an x-cross instead. Other options include "labels" which enables the use of labels accompanied by their respective tooltip and color, or "none" where N/S Dojis will be only noticeable by their changed barcolor.
"Allow Gravestone/Dragonfly Shadows" ( boolean ) allows a bit of additional nuance to the definition of Gravestone or Dragonfly Dojis with small shadows.
"Gravestone/Dragonfly Shadow Tolerance" ( float ) defines the maximum % that the lower wick/upper wick (respectively) may be relative to the high-low range for Gravestone or Dragonfly Dojis to still be considered valid.
"Doji Long Wick Setting" ( string list) is a list of settings for three different ways of confirming if a Doji is Long-Legged. The settings are "one", "two", and "average". These define how many wick lengths of a candle need to exceed the calculated average wick lengths (EX: "both" -> upper wick length > upper wick average and lower wick length > lower wick average). The "average" setting will combine the lengths of both wicks and both prior wick averages, divide both of these sums by 2 and compare them instead.
"Doji Long Wick Tolerance" ( float ) defines how large compared to the averages that wick lengths need to be in order for them to be considered "Long-Legged" (EX: 1.50 -> upper/lower wick needs to exceed 150% the average of previous upper/lower wicks).
"Rickshaw Man Body Placement Tolerance" ( float ) defines how close to the high-low range's midpoint the candle body's midpoint needs to be in order for it to be considered a Rickshaw Man Doji candle instead.
The remaining 9 inputs define the colors to use for differentiating between all Doji variants this script will recognize.
█ USAGE
My hope for this script is that users find this easy to use/understand and will tinker with the input values to better identify Doji candlesticks across a wide range of markets.
Suggestions for changes in the future are welcome.
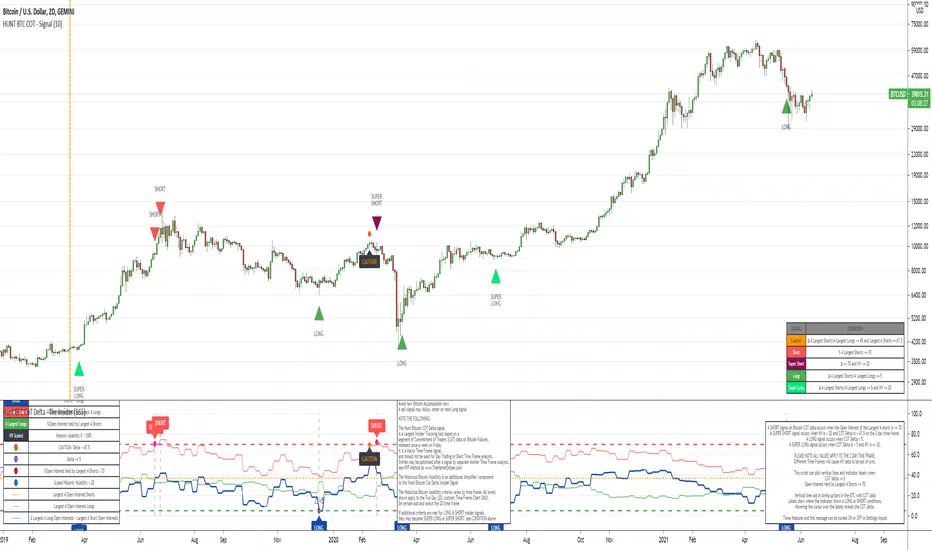
The Insider - Hunt Bitcoin CoT DeltaThe Insider - Hunt Bitcoin CoT Delta
The gift of the Squeeze in the Largest 4 open Interest Shorts vs Longs.
Why Bother another CoT signal?
Its different & focused on the Insider's.
Performance -
This Indicator provided a
1. Signal 1 = 26th March 2019 = SUPER LONG at $4,500 that saw a near $14,000 run up
2. Signal 2 = 18th & 24th June 2019 = SHORT at the second & final level $11,700 after repeated attempts & failure in the $13K range, the mini Echo Bitcoin Bull of 2019
3. Signal 3 = 17th December 2019 = LONG $6,900, Bitcoin rallied to Mid $10,500's
4. Signal 4 = 18th Feb 2020 = SUPER SHORT from $9,700's to a final extreme Low of $3,000, calling the CV-19 collapse
5. Signal 5 = 17th March 2020 = LONG from $5,400 no closure point yet
6. Signal 6 = 29th June 2020 = SUPER LONG reiterate from $10,700 no closure sell signal yet
7. Signal 7 = 17th May 2020 = LONG another accumulate LONG with no sell signal yet generated at Post H&S's low of $33,000
Note - This indicator only commences March 2019, as Bitcoin futures were a recent introduction and needed to settle for 6 months in both use and data, no signals were meaningful prior & data was light.
What is Provided. - Please note the need to also add the Hunt Bitcoin Historical Volatility Indicator for full understanding.
We provide 3 things with the 3 indicators.
'Insider' indications from Largest players in the futures market.
1. Bitcoin Macro Buy Signals.
a) The Bitcoin Commitment of Traders results see us focus solely on Largest 4 Short Open Interest & Largest 4 Long Open Interest aspects of the CoT Release data.
When the difference - is tight, a kind of pinch, these have been great Buy signals in Bitcoin.
We call this difference the Delta & When Delta is 5% or less Bitcoin is a Buy.
2. Bitcoin Macro Sells.
a) A sell signal is Triggered in Bitcoin at any point the Largest 4 short OI > or = to 70
3. AMPLIFIER Trade signals 'Super' Longs or Shorts -
Extreme low volatility events leads to highly impulsive & volatile subsequent moves, if either of 1 or 2 above occur, combined with extreme low volatility
a 'Super Long' or 'SUPER SELL' is generated. In the case of the short side, given Bitcoins general expansive and MACRO Bull trend since inception, we seek an additional component
that is an extreme differential/Delta reading between 4 biggest Longs & Shorts OI.
Namely CoT Delta also must be > 47.5%
We also have a Cautionary level, where it is not necessarily a good idea to accumulate Bitcon, as a better opportunity lower may avail itself, see conditions below.
So the required logic explicitly stated below for all Signals.
1. Long - Hunt Bitcoin CoT Delta < or = 5
2. SUPER Long - Hunt Bitcoin CoT Delta < or = 5; and 2 Day Historical Bitcoin Volatility = or < 20
3. Short - Largest 4 Sellers OI = or > 70
4. SUPER Short - Largest 4 Sellers OI = or > 70; AND..
Hunt Bitcoin CoT Delta = or > 47.5 AND 2 Day Historical BTC Volatility = or < 20
5. Caution - Largest 4 Sellers OI = or > 67.5 AND Hunt Bitcoin CoT Delta = or > 45
WARNING SEE Notes Below
Note 1 - = Largest 4 Open Interest Shorts
Note 2 - = Largest 4 Open Interest Longs
Note 3 - = Hunt Cot Delta = (Largest 4 sellers OI) -( Largest 4 Buyers OI)
Caution = Avoid new Bitcoin Accumulation Right Now, A sell signal might follow Enter on next Long
Note 4 - The Hunt Bitcoin COT Delta signal is a Largest 'Insider' Tracking tool based on a segment of Commitment of Traders data on Bitcoin Futures, released once a week on a Friday.
It is a Macro Timeframe signal , and should not be used for Day trading and Short Timeframe analysis , Entries may be optimised after a Hunt Bitcoin CoT Signal is generated by separate shorter Timeframe analysis.
Note 5 - The Historical Bitcoin Volatility is an additional 'Amplifier' component to the 'Hunt Bitcoin Cot Delta' Insider Signal
Note 6 - The Historical Bitcoin Volatility criteria varies by timeframe, the above levels are those applying on a Two Day TF Chart, select this custom timeframe in Trading View.
if additional criteria are met for LONG & SHORT insider signals, they may become 'Super Longs/Shorts', see conditions box above.
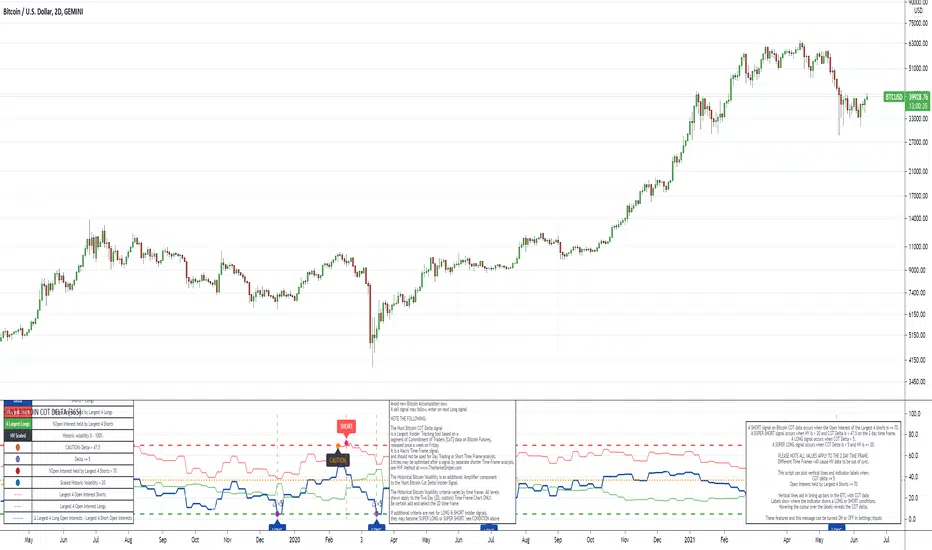
The Signal - Hunt Bitcoin CoT Buy/SellThe Signal - Hunt Bitcoin CoT Buy/Sell
Why Bother with another CoT signal?
Its different & focused on the Insider's. The Largest 4 Open Interest Seller and the Largest 4 open Interest Longs, plus the distance they are apart, the Delta, what does high percentage of Largest 4 sellers mean with a low 4 OI Buyers. , what when the usually higher Sellers are low and the largest 4 buyers almost the same value , Time to track the insiders Delta..
Performance -
This Indicator provided a
1. Signal 1 = 26th March 2019 = SUPER LONG at $4,500 that saw a near $14,000 run up
2. Signal 2 = 18th & 24th June 2019 = SHORT at the second & final level $11,700 after repeated attempts & failure in the $13K range, the mini Echo Bitcoin Bull of 2019
3. Signal 3 = 17th December 2019 = LONG $6,900, Bitcoin rallied to Mid $10,500's
4. Signal 4 = 18th Feb 2020 = SUPER SHORT from $9,700's to a final extreme Low of $3,000, calling the CV-19 collapse
5. Signal 5 = 17th March 2020 = LONG from $5,400 no closure point yet
6. Signal 6 = 29th June 2020 = SUPER LONG reiterate from $10,700 no closure sell signal yet
7. Signal 7 = 17th May 2020 = LONG another accumulate LONG with no sell signal yet generated at Post H&S's low of $33,000
Note - This indicator only commences March 2019, as Bitcoin futures were a recent introduction and needed to settle for 6 months in both use and data, no signals were meaningful prior & data was light.
What is Provided. - Please note the need to also add the Hunt Bitcoin Historical Volatility Indicator for full understanding.
We provide 3 things with the 3 indicators.
'Insider' indications from Largest players in the futures market.
1. Bitcoin Macro Buy Signals.
a) The Bitcoin Commitment of Traders results see us focus solely on Largest 4 Short Open Interest & Largest 4 Long Open Interest aspects of the CoT Release data.
When the difference - is tight, a kind of pinch, these have been great Buy signals in Bitcoin.
We call this difference the Delta & When Delta is 5% or less Bitcoin is a Buy.
2. Bitcoin Macro Sells.
a) A sell signal is Triggered in Bitcoin at any point the Largest 4 short OI > or = to 70
3. AMPLIFIER Trade signals 'Super' Longs or Shorts -
Extreme low volatility events leads to highly impulsive & volatile subsequent moves, if either of 1 or 2 above occur, combined with extreme low volatility
a 'Super Long' or 'SUPER SELL' is generated. In the case of the short side, given Bitcoins general expansive and MACRO Bull trend since inception, we seek an additional component
that is an extreme differential/Delta reading between 4 biggest Longs & Shorts OI.
Namely CoT Delta also must be > 47.5%
We also have a Cautionary level, where it is not necessarily a good idea to accumulate Bitcon, as a better opportunity lower may avail itself, see conditions below.
So the required logic explicitly stated below for all Signals.
1. Long - Hunt Bitcoin CoT Delta < or = 5
2. SUPER Long - Hunt Bitcoin CoT Delta < or = 5; and 2 Day Historical Bitcoin Volatility = or < 20
3. Short - Largest 4 Sellers OI = or > 70
4. SUPER Short - Largest 4 Sellers OI = or > 70; AND..
Hunt Bitcoin CoT Delta = or > 47.5 AND 2 Day Historical BTC Volatility = or < 20
5. Caution - Largest 4 Sellers OI = or > 67.5 AND Hunt Bitcoin CoT Delta = or > 45
WARNING SEE Notes Below
Note 1 - = Largest 4 Open Interest Shorts
Note 2 - = Largest 4 Open Interest Longs
Note 3 - = Hunt Cot Delta = (Largest 4 sellers OI) -( Largest 4 Buyers OI)
Caution = Avoid new Bitcoin Accumulation Right Now, A sell signal might follow Enter on next Long
Note 4 - The Hunt Bitcoin COT Delta signal is a Largest 'Insider' Tracking tool based on a segment of Commitment of Traders data on Bitcoin Futures, released once a week on a Friday.
It is a Macro Timeframe signal , and should not be used for Day trading and Short Timeframe analysis , Entries may be optimised after a Hunt Bitcoin CoT Signal is generated by separate shorter Timeframe analysis.
Note 5 - The Historical Bitcoin Volatility is an additional 'Amplifier' component to the 'Hunt Bitcoin Cot Delta' Insider Signal
Note 6 - The Historical Bitcoin Volatility criteria varies by timeframe, the above levels are those applying on a Two Day TF Chart, select this custom timeframe in Trading View.
if additional criteria are met for LONG & SHORT insider signals, they may become 'Super Longs/Shorts', see conditions box above.

The Amplifier - Two Day Historical Bitcoin Volatility PlotThe 3rd piece to the other two pieces to our CoT study. This is the Amplifier, which turns select signals into 'Super' Buys/Sells
The other two being the 'Bitcoin Insider CoT Delta', and the on chart Price indicator most will have, if no others the 'Hunt Bitcoin CoT Buy/Sell Signals' that will indicate the key signals, ave 4 a year on the chart as they occur.
Why Bother another CoT signal?
Its different & focused on the Insider's.
Performance -
This Indicator provided a
1. Signal 1 = 26th March 2019 = SUPER LONG at $4,500 that saw a near $14,000 run up
2. Signal 2 = 18th & 24th June 2019 = SHORT at the second & final level $11,700 after repeated attempts & failure in the $13K range, the mini Echo Bitcoin Bull of 2019
3. Signal 3 = 17th December 2019 = LONG $6,900, Bitcoin rallied to Mid $10,500's
4. Signal 4 = 18th Feb 2020 = SUPER SHORT from $9,700's to a final extreme Low of $3,000, calling the CV-19 collapse
5. Signal 5 = 17th March 2020 = LONG from $5,400 no closure point yet
6. Signal 6 = 29th June 2020 = SUPER LONG reiterate from $10,700 no closure sell signal yet
7. Signal 7 = 17th May 2020 = LONG another accumulate LONG with no sell signal yet generated at Post H&S's low of $33,000
Note - This indicator only commences March 2019, as Bitcoin futures were a recent introduction and needed to settle for 6 months in both use and data, no signals were meaningful prior & data was light.
What is Provided. - Please note the need to also add the Hunt Bitcoin Historical Volatility Indicator for full understanding.
We provide 3 things with the 3 indicators.
'Insider' indications from Largest players in the futures market.
1. Bitcoin Macro Buy Signals.
a) The Bitcoin Commitment of Traders results see us focus solely on Largest 4 Short Open Interest & Largest 4 Long Open Interest aspects of the CoT Release data.
When the difference - is tight, a kind of pinch, these have been great Buy signals in Bitcoin.
We call this difference the Delta & When Delta is 5% or less Bitcoin is a Buy.
2. Bitcoin Macro Sells.
a) A sell signal is Triggered in Bitcoin at any point the Largest 4 short OI > or = to 70
3. AMPLIFIER Trade signals 'Super' Longs or Shorts -
Extreme low volatility events leads to highly impulsive & volatile subsequent moves, if either of 1 or 2 above occur, combined with extreme low volatility
a 'Super Long' or 'SUPER SELL' is generated. In the case of the short side, given Bitcoins general expansive and MACRO Bull trend since inception, we seek an additional component
that is an extreme differential/Delta reading between 4 biggest Longs & Shorts OI.
Namely CoT Delta also must be > 47.5%
We also have a Cautionary level, where it is not necessarily a good idea to accumulate Bitcon, as a better opportunity lower may avail itself, see conditions below.
So the required logic explicitly stated below for all Signals.
1. Long - Hunt Bitcoin CoT Delta < or = 5
2. SUPER Long - Hunt Bitcoin CoT Delta < or = 5; and 2 Day Historical Bitcoin Volatility = or < 20
3. Short - Largest 4 Sellers OI = or > 70
4. SUPER Short - Largest 4 Sellers OI = or > 70; AND..
Hunt Bitcoin CoT Delta = or > 47.5 AND 2 Day Historical BTC Volatility = or < 20
5. Caution - Largest 4 Sellers OI = or > 67.5 AND Hunt Bitcoin CoT Delta = or > 45
WARNING SEE Notes Below
Note 1 - = Largest 4 Open Interest Shorts
Note 2 - = Largest 4 Open Interest Longs
Note 3 - = Hunt Cot Delta = (Largest 4 sellers OI) -( Largest 4 Buyers OI)
Caution = Avoid new Bitcoin Accumulation Right Now, A sell signal might follow Enter on next Long
Note 4 - The Hunt Bitcoin COT Delta signal is a Largest 'Insider' Tracking tool based on a segment of Commitment of Traders data on Bitcoin Futures, released once a week on a Friday.
It is a Macro Timeframe signal , and should not be used for Day trading and Short Timeframe analysis , Entries may be optimised after a Hunt Bitcoin CoT Signal is generated by separate shorter Timeframe analysis.
Note 5 - The Historical Bitcoin Volatility is an additional 'Amplifier' component to the 'Hunt Bitcoin Cot Delta' Insider Signal
Note 6 - The Historical Bitcoin Volatility criteria varies by timeframe, the above levels are those applying on a Two Day TF Chart, select this custom timeframe in Trading View.
if additional criteria are met for LONG & SHORT insider signals, they may become 'Super Longs/Shorts', see conditions box above.

Hunt Bitcoin CoT Buy/Sell signalWhy Bother another CoT signal?
Its different & focused on the Insider's.
Performance -
This Indicator provided a
1. Signal 1 = 26th March 2019 = SUPER LONG at $4,500 that saw a near $14,000 run up
2. Signal 2 = 18th & 24th June 2019 = SHORT at the second & final level $11,700 after repeated attempts & failure in the $13K range, the mini Echo Bitcoin Bull of 2019
3. Signal 3 = 17th December 2019 = LONG $6,900, Bitcoin rallied to Mid $10,500's
4. Signal 4 = 18th Feb 2020 = SUPER SHORT from $9,700's to a final extreme Low of $3,000, calling the CV-19 collapse
5. Signal 5 = 17th March 2020 = LONG from $5,400 no closure point yet
6. Signal 6 = 29th June 2020 = SUPER LONG reiterate from $10,700 no closure sell signal yet
7. Signal 7 = 17th May 2020 = LONG another accumulate LONG with no sell signal yet generated at Post H&S's low of $33,000
Note - This indicator only commences March 2019, as Bitcoin futures were a recent introduction and needed to settle for 6 months in both use and data, no signals were meaningful prior & data was light.
What is Provided. - Please note the need to also add the Hunt Bitcoin Historical Volatility Indicator for full understanding.
We provide 3 things with the 3 indicators.
'Insider' indications from Largest players in the futures market.
1. Bitcoin Macro Buy Signals.
a) The Bitcoin Commitment of Traders results see us focus solely on Largest 4 Short Open Interest & Largest 4 Long Open Interest aspects of the CoT Release data.
When the difference - is tight, a kind of pinch, these have been great Buy signals in Bitcoin.
We call this difference the Delta & When Delta is 5% or less Bitcoin is a Buy.
2. Bitcoin Macro Sells.
a) A sell signal is Triggered in Bitcoin at any point the Largest 4 short OI > or = to 70
3. AMPLIFIER Trade signals 'Super' Longs or Shorts -
Extreme low volatility events leads to highly impulsive & volatile subsequent moves, if either of 1 or 2 above occur, combined with extreme low volatility
a 'Super Long' or 'SUPER SELL' is generated. In the case of the short side, given Bitcoins general expansive and MACRO Bull trend since inception, we seek an additional component
that is an extreme differential/Delta reading between 4 biggest Longs & Shorts OI.
Namely CoT Delta also must be > 47.5%
We also have a Cautionary level, where it is not necessarily a good idea to accumulate Bitcon, as a better opportunity lower may avail itself, see conditions below.
So the required logic explicitly stated below for all Signals.
1. Long - Hunt Bitcoin CoT Delta < or = 5
2. SUPER Long - Hunt Bitcoin CoT Delta < or = 5; and 2 Day Historical Bitcoin Volatility = or < 20
3. Short - Largest 4 Sellers OI = or > 70
4. SUPER Short - Largest 4 Sellers OI = or > 70; AND..
Hunt Bitcoin CoT Delta = or > 47.5 AND 2 Day Historical BTC Volatility = or < 20
5. Caution - Largest 4 Sellers OI = or > 67.5 AND Hunt Bitcoin CoT Delta = or > 45
WARNING SEE Notes Below
Note 1 - = Largest 4 Open Interest Shorts
Note 2 - = Largest 4 Open Interest Longs
Note 3 - = Hunt Cot Delta = (Largest 4 sellers OI) -( Largest 4 Buyers OI)
Caution = Avoid new Bitcoin Accumulation Right Now, A sell signal might follow Enter on next Long
Note 4 - The Hunt Bitcoin COT Delta signal is a Largest 'Insider' Tracking tool based on a segment of Commitment of Traders data on Bitcoin Futures, released once a week on a Friday.
It is a Macro Timeframe signal , and should not be used for Day trading and Short Timeframe analysis , Entries may be optimised after a Hunt Bitcoin CoT Signal is generated by separate shorter Timeframe analysis.
Note 5 - The Historical Bitcoin Volatility is an additional 'Amplifier' component to the 'Hunt Bitcoin Cot Delta' Insider Signal
Note 6 - The Historical Bitcoin Volatility criteria varies by timeframe, the above levels are those applying on a Two Day TF Chart, select this custom timeframe in Trading View.
if additional criteria are met for LONG & SHORT insider signals, they may become 'Super Longs/Shorts', see conditions box above.

Hunt Bitcoin CoT Open Interest DeltaWhy Bother another CoT signal?
Its different & focused on the Insider's.
Performance -
This Indicator provided a
1. Signal 1 = 26th March 2019 = SUPER LONG at $4,500 that saw a near $14,000 run up
2. Signal 2 = 18th & 24th June 2019 = SHORT at the second & final level $11,700 after repeated attempts & failure in the $13K range, the mini Echo Bitcoin Bull of 2019
3. Signal 3 = 17th December 2019 = LONG $6,900, Bitcoin rallied to Mid $10,500's
4. Signal 4 = 18th Feb 2020 = SUPER SHORT from $9,700's to a final extreme Low of $3,000, calling the CV-19 collapse
5. Signal 5 = 17th March 2020 = LONG from $5,400 no closure point yet
6. Signal 6 = 29th June 2020 = SUPER LONG reiterate from $10,700 no closure sell signal yet
7. Signal 7 = 17th May 2020 = LONG another accumulate LONG with no sell signal yet generated at Post H&S's low of $33,000
Note - This indicator only commences March 2019, as Bitcoin futures were a recent introduction and needed to settle for 6 months in both use and data, no signals were meaningful prior & data was light.
What is Provided. - Please note the need to also add the Hunt Bitcoin Historical Volatility Indicator for full understanding.
We provide 3 things with the 3 indicators.
'Insider' indications from Largest players in the futures market.
1. Bitcoin Macro Buy Signals.
a) The Bitcoin Commitment of Traders results see us focus solely on Largest 4 Short Open Interest & Largest 4 Long Open Interest aspects of the CoT Release data.
When the difference - is tight, a kind of pinch, these have been great Buy signals in Bitcoin.
We call this difference the Delta & When Delta is 5% or less Bitcoin is a Buy.
2. Bitcoin Macro Sells.
a) A sell signal is Triggered in Bitcoin at any point the Largest 4 short OI > or = to 70
3. AMPLIFIER Trade signals 'Super' Longs or Shorts -
Extreme low volatility events leads to highly impulsive & volatile subsequent moves, if either of 1 or 2 above occur, combined with extreme low volatility
a 'Super Long' or 'SUPER SELL' is generated. In the case of the short side, given Bitcoins general expansive and MACRO Bull trend since inception, we seek an additional component
that is an extreme differential/Delta reading between 4 biggest Longs & Shorts OI.
Namely CoT Delta also must be > 47.5%
We also have a Cautionary level, where it is not necessarily a good idea to accumulate Bitcon, as a better opportunity lower may avail itself, see conditions below.
So the required logic explicitly stated below for all Signals.
1. Long - Hunt Bitcoin CoT Delta < or = 5
2. SUPER Long - Hunt Bitcoin CoT Delta < or = 5; and 2 Day Historical Bitcoin Volatility = or < 20
3. Short - Largest 4 Sellers OI = or > 70
4. SUPER Short - Largest 4 Sellers OI = or > 70; AND..
Hunt Bitcoin CoT Delta = or > 47.5 AND 2 Day Historical BTC Volatility = or < 20
5. Caution - Largest 4 Sellers OI = or > 67.5 AND Hunt Bitcoin CoT Delta = or > 45
WARNING SEE Notes Below
Note 1 - = Largest 4 Open Interest Shorts
Note 2 - = Largest 4 Open Interest Longs
Note 3 - = Hunt Cot Delta = (Largest 4 sellers OI) -( Largest 4 Buyers OI)
Caution = Avoid new Bitcoin Accumulation Right Now, A sell signal might follow Enter on next Long
Note 4 - The Hunt Bitcoin COT Delta signal is a Largest 'Insider' Tracking tool based on a segment of Commitment of Traders data on Bitcoin Futures, released once a week on a Friday.
It is a Macro Timeframe signal , and should not be used for Day trading and Short Timeframe analysis , Entries may be optimised after a Hunt Bitcoin CoT Signal is generated by separate shorter Timeframe analysis.
Note 5 - The Historical Bitcoin Volatility is an additional 'Amplifier' component to the 'Hunt Bitcoin Cot Delta' Insider Signal
Note 6 - The Historical Bitcoin Volatility criteria varies by timeframe, the above levels are those applying on a Two Day TF Chart, select this custom timeframe in Trading View.
if additional criteria are met for LONG & SHORT insider signals, they may become 'Super Longs/Shorts', see conditions box above.
[Unxi]McClellan Oscillator for TECDAX [modified]This version is for use with the German TecDax index only!
About McClellan Oscillator
Developed by Sherman and Marian McClellan, the McClellan Oscillator is a breadth indicator derived from Net Advances, the number of advancing issues less the number of declining issues. Subtracting the 39-day exponential moving average of Net Advances from the 19-day exponential moving average of Net Advances forms the oscillator.
As the formula reveals, the McClellan Oscillator is a momentum indicator that works similar to MACD .
McClellan Oscillator signals can be generated with breadth thrusts, centerline crossovers, overall levels and divergences.
About my version
This version here is a modification, though:
- It can only be used on the German TECDAX index
- It only considers the TECDAX stocks
- The data window will provide a summary about rising and declining stocks
- The data window will output the last change for each of the 30 stocks
The script is pretty slow because it has to calculate the change for each bar individually (instead of receiving a complete calculation from the stock exchange).
This script will work on any time period. Just use whatever timeperiod you are comfortable with, the indicator will automatically adjust accordingly. It is recommended to use it with timeperiod = 1d, though.
DISCLAIMER
This script was mainly written for educational purposes (training myself how to write custom indicatotors).
As you can see, the code is really messy. Feel free to provide your feedback in the comments!
Credits
Based on the simple version of aftabmk
You can find the original version by searching for McClellan Oscillator for nifty 50.
Also got some inspiration from lazybear's version and from danarn's "Crypto McClellan Oscillator".
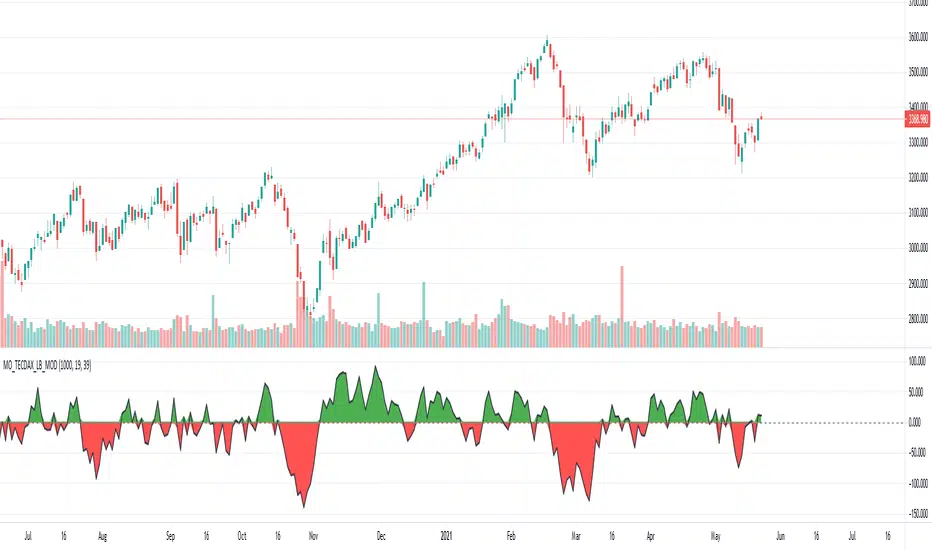
McClellan Oscillator for DAX (GER30) [aftabmk modified]About McClellan Oscillator
Developed by Sherman and Marian McClellan, the McClellan Oscillator is a breadth indicator derived from Net Advances, the number of advancing issues less the number of declining issues. Subtracting the 39-day exponential moving average of Net Advances from the 19-day exponential moving average of Net Advances forms the oscillator.
As the formula reveals, the McClellan Oscillator is a momentum indicator that works similar to MACD .
McClellan Oscillator signals can be generated with breadth thrusts, centerline crossovers, overall levels and divergences.
About my version
This version here is a modification, though:
- It can only be used on the DAX index (DAX 30 or GER 30)
- It only considers the DAX 30 stocks
- The data window will provide a summary about rising and declining stocks
- The data window will output the last change for each of the 30 stocks
BUG
I am only publishing this version because I am not sure if my current version is saved when I leave tradingview.com without publishing the script.
This version still contains a bug - the if/else clauses do not correctly recognize declining stocks. So the oscillator should not be used as it is.
Working on it these days. Feel free to provide feedback!
Stuff I am working on
- Coloring the area green/red according to the value
- Fixing this bug/making this script more efficient
DISCLAIMER
This script was mainly written for educational purposes (training myself how to write custom indicatotors).
As you can see, the code is really messy.
Credits
Based on the simple version of aftabmk
You can find the original version by searching for McClellan Oscillator for nifty 50.

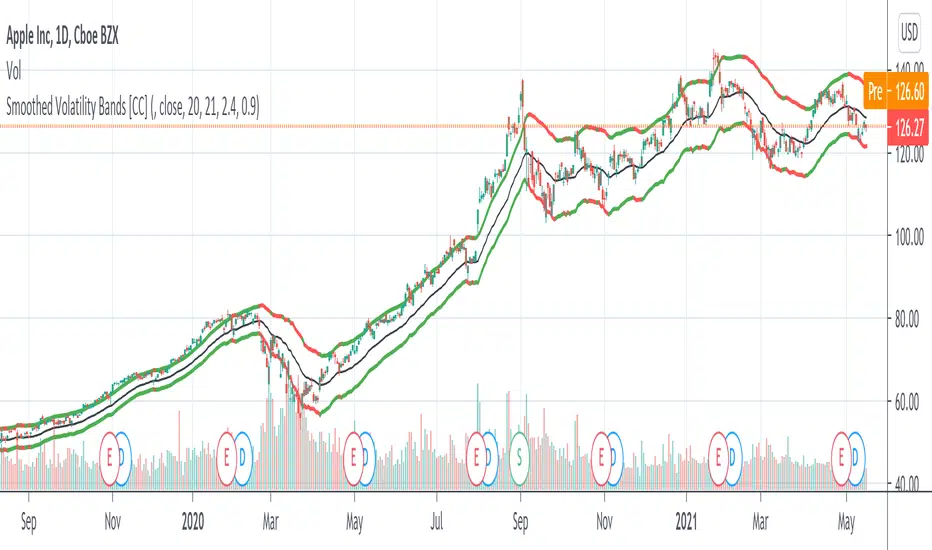
Smoothed Volatility Bands [CC]The Smoothed Volatility Bands were created by Sylvain Vervoort (Stocks and Commodities Sep 2020 pg 19) and this is a heavily customized version of regular Bollinger Bands that take volatility into account. Feel free to change the moving average since Vervoort recommended trying that out. Buy when the indicator line turns green and sell when it turns red.
Let me know if there are any other indicators you want me to publish!