Z-Score Probability IndicatorThis is the Z-Score Probability indicator. As many people like my original Z-Score indicator and have expressed more interest in the powers of the Z, I decided to make this indicator which shows additional powers of the Z-Score.
Z-Score is not only useful for measuring a ticker or any other variable’s distance from the mean, it is also useful to calculate general probability in a normal distribution set. Not only can it calculate probability in a dataset, but it can also calculate the variables within said dataset by using the Standard Deviation and the Mean of the dataset.
Using these 2 aspects of the Z-Score, you can, In principle, have an indicator that operates similar to Fibonacci retracement levels with the added bonus of being able to actually ascertain the realistic probability of said retracement.
Let’s take a look at an example:
This is a chart showing SPY on the daily timeframe. If we look at the current Z-Score level, we can see that SPY is pushing into the 2 to 3 Z-Score range. We can see two things from this:
1. We can see that a retracement to a Z-Score of 2 would correspond to a price of 425.26 based on the current dataset. And
2. We can see that the probability that SPY retraces to a Z-Score of 2 is around 0.9800 or 98%.
To take it one step further, we can look at the various other variables in the distribution. If we were to bet on SPY retracing back to -1 SDs, that would correspond to a price of around 397.15, with a probability of around 0.1600 or 16% (see image below):
Let’s say, we thought SPY would go to $440. Well, we can see that the probability SPY goes to 434.64 currently is pretty low. How do we know? Because the Z-Score table shows us the probability of values falling BELOW that Z-score level in the current distribution. So if we look at this example below:
We can see that 0.9998 or roughly 99% of values in the current SPY distribution will fall below 434.64. Thus, it may be unrealistic, at this point in time, to target said value.
So what is a Z-Score Table?
Well, I need to disclose/clarify that the Z-Score Table being displayed in this indicator does Z-Score probability a HUGE injustice. However, with the constraints what is realistic to fit into an indicator, I had to make it far more succinct. Let’s take a look at an actual Z-Score Table below:
Above is a look an the actual Z-Score table. How it works is you first identify you’re Z-Score and then find the corresponding value that relates to your score. The number displayed in the dataset represents the number of variables in the dataset/density distribution that fall BELOW that particular Z-score.
So, for example, if we have a Z-Score of -2.31, we can consult that table, go to the -2.3 then scroll across to the 0.01 to represent -2.31. We would see that this Z-Score corresponds to a 0.0104 probability zone (or essentially 1%) indicating that the majority of the variables in the distribution fall below that mean Z-score. In terms of tickers and stocks, that would mean it would theoretically be “overbought”.
So what does the indicator Z-Table tell us?
I have averaged out the data for the purposes of this indicator. However, you can also reference a manual Z-Table to get the exact probability for the current precise Z-Score. However, the reality is it doesn’t necessarily matter to be exact when it comes to tickers. The reason being, ticker’s are in constant flux, and by the time you identify that probability, the ticker will already be at a different level. So generalizations are okay in these circumstances, you just need to get the “gist” of where the distribution lies.
So how do I use the indicator?
Using the indicator is pretty straightforward. Once launched, you will see the current Z-Score of the ticker, the current levels based on the distribution and the summarized Z-Table.
The Z-Table will turn gray to indicate the zone the ticker is currently in. In this case, we can see that SPY currently is in the 2 SD Zone, meaning that 0.98 or 98% of the current dataset being shown falls below the price we are at:
When we launch the settings, we can see a few inputs.
Lookback Length: This determines the number of candles back we want to calculate the distribution for. It is defaulted to 75, but you can adjust it to whichever length you want.
SMA Length: The SMA is optional but defaults to on. If you want to see the smoothed trend of the Z-Score, this will do the trick. It does not need to be set to the same
length as the Z-Score lookback. Thus, if you want a more or less responsive SMA with, say, a larger dataset, then you can reduce the SMA length yourself.
Distribution Probability Fills: This simply colour codes the distribution zones / probability zones on the indicator.
Show Z-Table: This will display the summarized Z-Table.
Show SMA: As I indicated, the SMA is optional, you can toggle it on or off to see the overall Z-Score trend.
Concluding Remarks:
And that my friends is the Z-Score Probability Indicator.
I hope you all enjoy it and find it helpful. As always leave your comments, questions and suggestions below.
Safe trades to all and take care!
在腳本中搜尋"0.98的股票有哪些?"

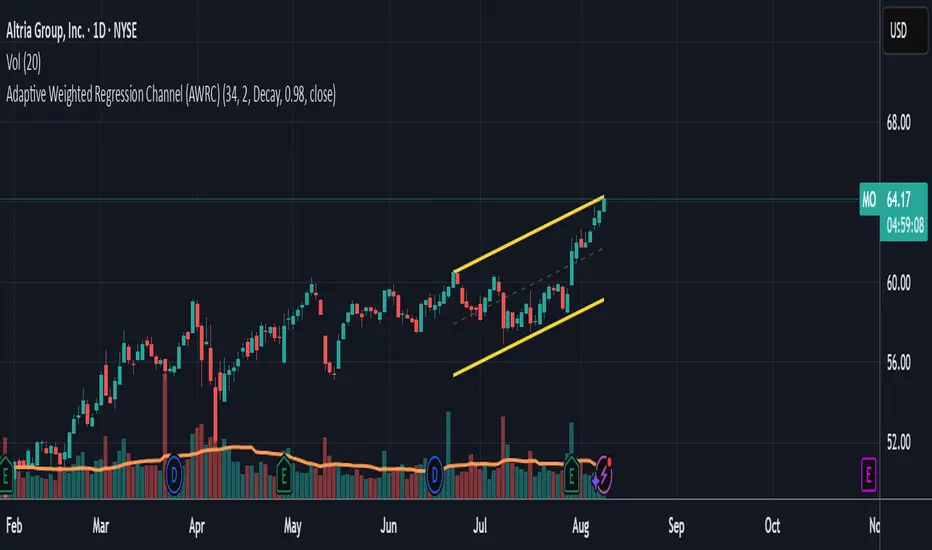
Adaptive Weighted Regression Channel (AWRC)Short Description:
The Adaptive Weighted Regression Channel (AWRC) is an advanced technical analysis tool that plots a dynamic regression channel based on the recent price action. The centerline is a linear regression (trendline) fitted to the selected price source over a rolling window. The channel boundaries are placed above and below the regression line by a user-selected multiple of the weighted standard deviation.
What makes AWRC unique is its ability to optionally weight each bar’s importance in the regression using Volume, ATR (Average True Range), or Recency Decay, offering a channel that can adapt to market volatility, participation, or trend acceleration.
Parameter Explanations:
length: Number of bars for the regression window (how many recent candles are included). Higher values = smoother, less sensitive channel.
StdDev Multiplier (mult): Controls the channel width. 2.0 is classic; higher = wider channels, lower = tighter.
Enable Weighting?: Turn ON to activate weighting of each bar. If OFF, all bars are equally weighted (classic regression channel).
Weight Type: Select what to use for weights (only active if Enable Weighting is ON):
"Volume": Higher volume bars have more influence on the regression.
"ATR": Bars with higher volatility (as measured by ATR) have more influence.
"Decay": More recent bars are given more weight (controlled by Decay parameter).
Decay: If Weight Type is "Decay", this controls the rate of recency decay. (e.g. 0.98 = slow decay; 0.90 = fast decay; values close to 1 mean a longer memory.)
Source for the calculation (src): Selects which price is regressed. Default is hl2 (average of high and low); you can choose close, open, etc.
Recommended Parameters:
For general use: length = 34, mult = 2.0, Enable Weighting = OFF, src = hl2
For volume-aware channel: Enable Weighting = ON, Weight Type = "Volume"
For volatility sensitivity: Enable Weighting = ON, Weight Type = "ATR"
For extra focus on recent price: Enable Weighting = ON, Weight Type = "Decay", Decay = 0.95 or 0.98
For swing trading: length = 21–55, mult = 1.5–2.5
For intraday/scalping: length = 10–20, mult = 1.0–1.5
Usage Tips:
The regression line shows the "best fit" trend for the selected window.
The channel captures the typical range; price breaking outside the channel can signal strength, exhaustion, or breakout.
Volume and ATR weighting help the channel adapt to market participation or volatility spikes.
Decay weighting locks onto the most recent trend direction quickly.
Adjust parameters to fit your timeframe and market volatility.
Use AWRC to spot trending moves, reversals, or overextensions.
Try different weighting and channel settings to match your trading style!
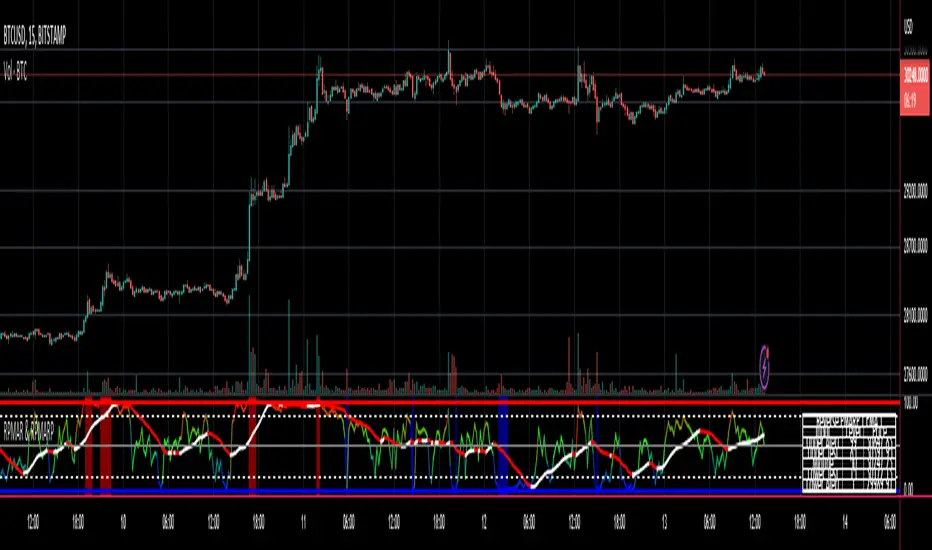
Reverse PMAR & PMARPIntroducing the Reverse PMAR & PMARP
Concept
The PMAR/PMARP is an indicator which calculates :
The ratio between a chosen source price and a user defined moving average ( Price Moving Average Ratio ).
The percentile of the PMAR over an adjustable lookback period ( Price Moving Average Ratio Percentile ).
Here I have reverse engineered the PMAR / PMARP formulas to derive several functions.
These functions calculate the chart price at which the PMAR/PMARP will cross a particular scale value.
I have employed those functions here to give the "crossover" price levels for :
Upper alert level
Upper test level
Mid-Line
Lower test level
Lower alert level
Knowing the price at which these various user defined PMARP levels will be crossed can be useful in setting price levels that trigger components of various strategies.
For example: using the reverse engineered upper test price level, to set take a take profit limit order on a long trade, which was entered when PMARP was low.
The indicator displays either the PMAR or PMARP as a line plot with optional signal moving average.
It also plots optional visual alert level lines, test level lines, background signal bars, and a display panel with reverse engineered prices.
Main Properties :
Price Source :- Choice of price values or external value from another indicator ( default *Close ).
Indicator :- Choice between PMAR or PMARP ( default *PMAR ).
Price Moving Average Ratio Properties :
PMAR Length :- User defined time period to be used in calculating the Moving Average for the Price Moving Average Ratio and the PMAR component of the PMARP ( default *21 ).
MA Type :- User defined type of Moving Average which creates the MA for the Price Moving Average Ratio and the PMAR component of the PMARP ( default *EMA ).
PMAR Multiplier :- User defined multiplier which moves the decimal place to the right in order to make the scale readable in PMAR mode ( default *x1 ).
Price Moving Average Ratio Percentile Properties :
PMARP Length :- The lookback period to be used in calculating the Price Moving Average Ratio Percentile ( default *350 ).
PMAR Levels :
Hi PMAR Alert :- High alert level ( default *1.02 ).
Hi PMAR Test :- High test level ( default *1.01 ).
Lo PMAR Test :- Low test level ( default *0.99 ).
Lo PMAR Alert :- Low alert level ( default *0.98 ).
PMARP Levels :
Hi PMARP Alert :- High alert level ( default *99 ).
Hi PMARP Test :- High test level ( default *70 ).
Lo PMARP Test :- Low test level ( default *30 ).
Lo PMARP Alert :- Low alert level ( default *1 ).
Line Plot Settings :
Color Type :- User choice from dropdown between "solid" or "spectrum" line coloring ( default *Solid ).
Solid Color :- Color selection box ( default *Yellow ).
Spectrum :- User choice from dropdown between "high to low", or "high to mid to low" spectrum line coloring ( default *high to mid to low ).
High Color :- Color selection box ( default *Red ).
Mid Color :- Color selection box ( default *Green ).
Low Color :- Color selection box ( default *Blue ).
Line Width :- Defines the width of the signal line from 1 - 4 ( default *1 ).
Signal Moving Average Settings :
Signal MA Length :- The time period to be used in calculating the signal Moving Average for the Line Plot ( default *20 ).
Signal MA Type :- The type of Moving Average which creates the signal Moving Average for the Line Plot ( default *EMA ).
Color Type :- User choice from dropdown between "single" or "dual" line color ( default *dual ).
Single Color :- Color selection box ( default *White ).
Dual Color :- Color selection box ( default *Red ). Note: Defines the color of the signal MA when the MA is falling in "dual" line coloring mode.
Line Width :- Defines the width of the signal line from 1 - 4 ( default *1 ).
Visual Alert Level Settings :
Checkboxes and color selection boxes for Upper/Lower alert lines, midline & test lines.
Signal Bars Transparency :- Sets the transparency of the vertical signal bars ( default *50 ).
Checkboxes and color selection boxes for Upper/Lower signal bars.
Panel Properties :
Checkboxes and color selection boxes for the various info. panel components.
Text Size :- User choice from dropdown between Tiny, Small, Normal and Large ( default *Normal ).
Decimal Places :- Sets the decimal places shown for the values in the info. panel ( default *2 ).
MACD Strategy- Script Example how to use % SL in your script ** Tired of Script showing a trade that you stopped out on but is still long on your script? Not any more**
I used Pine script to create realistic trading scenarios for SL users. Now your scripts will reflect what you see on the order book.
a=0.0
a := (*Insert buy condition*)? close: nz(a )
plot(0.98*a, color= green) //2%SL for BUY
b=0.0
b:= (*Insert Short condition*) ? close: nz(b )
plot(1.02*b, color= red) //2% SL for Short
Please check the script on how to implement this :)
