Bar Balance [LucF]Bar Balance extracts the number of up, down and neutral intrabars contained in each chart bar, revealing information on the strength of price movement. It can display stacked columns representing raw up/down/neutral intrabar counts, or an up/down balance line which can be calculated and visualized in many different ways.
WARNING: This is an analysis tool that works on historical bars only. It does not show any realtime information, and thus cannot be used to issue alerts or for automated trading. When realtime bars elapse, the indicator will require a browser refresh, a change to its Inputs or to the chart's timeframe/symbol to recalculate and display information on those elapsed bars. Once a trader understands this, the indicator can be used advantageously to make discretionary trading decisions.
Traders used to work with my Delta Volume Columns Pro will feel right at home in this indicator's Inputs . It has lots of options, allowing it to be used in many different ways. If you value the bar balance information this indicator mines, I hope you will find the time required to master the use of Bar Balance well worth the investment.
█ OVERVIEW
The indicator has two modes: Columns and Line .
Columns
• In Columns mode you can display stacked Up/Down/Neutral columns.
• The "Up" section represents the count of intrabars where `close > open`, "Down" where `close < open` and "Neutral" where `close = open`.
• The Up section always appears above the centerline, the Down section below. The Neutral section overlaps the centerline, split halfway above and below it.
The Up and Down sections start where the Neutral section ends, when there is one.
• The Up and Down sections can be colored independently using 7 different methods.
• The signal line plotted in Line mode can also be displayed in Columns mode.
Line
• Displays a single balance line using a zero centerline.
• A variable number of independent methods can be used to calculate the line (6), determine its color (5), and color the fill (5).
You can thus evaluate the state of 3 different components with this single line.
• A "Divergence Levels" feature will use the line to automatically draw expanding levels on divergence events.
Features available in both modes
• The color of all components can be selected from 15 base colors, with 16 gradient levels used for each base color in the indicator's gradients.
• A zero line can show a 6-state aggregate value of the three main volume balance modes.
• The background can be colored using any of 5 different methods.
• Chart bars can be colored using 5 different methods.
• Divergence and large neutral count ratio events can be shown in either Columns or Line mode, calculated in one of 4 different methods.
• Markers on 6 different conditions can be displayed.
█ CONCEPTS
Intrabar inspection
Intrabar inspection means the indicator looks at lower timeframe bars ( intrabars ) making up a given chart bar to gather its information. If your chart is on a 1-hour timeframe and the intrabar resolution determined by the indicator is 5 minutes, then 12 intrabars will be analyzed for each chart bar and the count of up/down/neutral intrabars among those will be tallied.
Bar Balances and calculation methods
The indicator uses a variety of methods to evaluate bar balance and to derive other calculations from them:
1. Balance on Bar : Uses the relative importance of instant Up and Down counts on the bar.
2. Balance Averages : Uses the difference between the EMAs of Up and Down counts.
3. Balance Momentum : Starts by calculating, separately for both Up and Down counts, the difference between the same EMAs used in Balance Averages and an SMA of double the period used for the EMAs. These differences are then aggregated and finally, a bounded momentum of that aggregate is calculated using RSI.
4. Markers Bias : It sums the bull/bear occurrences of the four previous markers over a user-defined period (the default is 14).
5. Combined Balances : This is the aggregate of the instant bull/bear bias of the three main bar balances.
6. Dual Up/Down Averages : This is a display mode showing the EMA calculated for each of the Up and Down counts.
Interpretation of neutral intrabars
What do neutral intrabars mean? When price does not change during a bar, it can be because there is simply no interest in the market, or because of a perfect balance between buyers and sellers. The latter being more improbable, Bar Balance assumes that neutral bars reveal a lack of interest, which entails uncertainty. That is the reason why the option is provided to interpret ratios of neutral intrabars greater than 50% as divergences. It is also the rationale behind the option to dampen signal lines on the inverse ratio of neutral intrabars, so that zero intrabars do not affect the signal, and progressively larger proportions of neutral intrabars will reduce the signal's amplitude, as the balance calcs using the up/down counts lose significance. The impact of the dampening will vary with markets. Weaker markets such as cryptos will often contain greater numbers of neutral intrabars, so dampening the Line in that sector will have a greater impact than in more liquid markets.
█ FEATURES
1 — Columns
• While the size of the Up/Down columns always represents their respective importance on the bar, their coloring mode is independent. The default setup uses a standard coloring mode where the Up/Down columns over/under the zero line are always in the bull/bear color with a higher intensity for the winning side. Six other coloring modes allow you to pack more information in the columns. When choosing to color the top columns using a bull/bear gradient on Balance Averages, for example, you will end up with bull/bear colored tops. In order for the color of the bottom columns to continue to show the instant bar balance, you can then choose the "Up/Down Ratio on Bar — Dual Solid Colors" coloring mode to make those bars the color of the winning side for that bar.
• Line mode shows only the line, but Columns mode allows displaying the line along with it. If the scale of the line is different than that of the scale of the columns, the line will often appear flat. Traders may find even a flat line useful as its bull/bear colors will be easily distinguishable.
2 — Line
• The default setup for Line mode uses a calculation on "Balance Momentum", with a fill on the longer-term "Balance Averages" and a line color based on the "Markers Bias". With the background set on "Line vs Divergence Levels" and the zero line on the hard-coded "Combined Bar Balances", you have access to five distinct sources of information at a glance, to which you can add divergences, divergences levels and chart bar coloring. This provides powerful potential in displaying bar balance information.
• When no columns are displayed, Line mode can show the full scale of whichever line you choose to calculate because the columns' scale no longer interferes with the line's scale.
• Note that when "Balance on Bar" is selected, the Neutral count is also displayed as a ratio of the balance line. This is the only instance where the Neutral count is displayed in Line mode.
• The "Dual Up/Down Averages" is an exception as it displays two lines: one average for the Up counts and another for the Down counts. This mode will be most useful when Columns are also displayed, as it provides a reference for the top and bottom columns.
3 — Zero Line
The zero line can be colored using two methods, both based on the Combined Balances, i.e., the aggregate of the instant bull/bear bias of the three main bar balances.
• In "Six-state Dual Color Gradient" mode, a dot appears on every bar. Its color reflects the bull/bear state of the Combined Balances, and the dot's brightness reflects the tally of balance biases.
• In "Dual Solid Colors (All Bull/All Bear Only)" a dot only appears when all three balances are either bullish or bearish. The resulting pattern is identical to that of Marker 1.
4 — Divergences
• Divergences are displayed as a small circle at the top of the scale. Four different types of divergence events can be detected. Divergences occur whenever the bull/bear bias of the method used diverges with the bar's price direction.
• An option allows you to include in divergence events instances where the count of neutral intrabars exceeds 50% of the total intrabar count.
• The divergence levels are dynamic levels that automatically build from the line's values on divergence events. On consecutive divergences, the levels will expand, creating a channel. This implementation of the divergence levels corresponds to my view that divergences indicate anomalies, hesitations, points of uncertainty if you will. It excludes any association of a pre-determined bullish/bearish bias to divergences. Accordingly, the levels merely take note of divergence events and mark those points in time with levels. Traders then have a reference point from which they can evaluate further movement. The bull/bear/neutral colors used to plot the levels are also congruent with this view in that they are determined by price's position relative to the levels, which is how I think divergences can be put to the most effective use.
5 — Background
• The background can show a bull/bear gradient on four different calculations. You can adjust its brightness to make its visual importance proportional to how you use it in your analysis.
6 — Chart bars
• Chart bars can be colored using five different methods.
• You have the option of emptying the body of bars where volume does not increase, as does my TLD indicator, the idea behind this being that movement on bars where volume does not increase is less relevant.
7 — Intrabar Resolution
You can choose between three modes. Two of them are automatic and one is manual:
a) Fast, Longer history, Auto-Steps (~12 intrabars) : Optimized for speed and deeper history. Uses an average minimum of 12 intrabars.
b) More Precise, Shorter History Auto-Steps (~24 intrabars) : Uses finer intrabar resolution. It is slower and provides less history. Uses an average minimum of 24 intrabars.
c) Fixed : Uses the fixed resolution of your choice.
Auto-Steps calculations vary for 24/7 and conventional markets in order to achieve the proper target of minimum intrabars.
You can choose to view the intrabar resolution currently used to calculate delta volume. It is the default.
The proper selection of the intrabar resolution is important. It must achieve maximal granularity to produce precise results while not unduly slowing down calculations, or worse, causing runtime errors.
8 — Markers
Six markers are available:
1. Combined Balances Agreement : All three Bar Balances are either bullish or bearish.
2. Up or Down % Agrees With Bar : An up marker will appear when the percentage of up intrabars in an up chart bar is greater than the specified percentage. Conditions mirror to down bars.
3. Divergence confirmations By Price : One of the four types of balance calculations can be used to detect divergences with price. Confirmations occur when the bar following the divergence confirms the balance bias. Note that the divergence events used here do not include neutral intrabar events.
4. Balance Transitions : Bull/bear transitions of the selected balance.
5. Markers Bias Transitions : Bull/bear transitions of the Markers Bias.
6. Divergence Confirmations By Line : Marks points where the line first breaches a divergence level.
Markers appear when the condition is detected, without delay. Since nothing is plotted in realtime, markers do not appear on the realtime bar.
9 — Settings
• Two modes can be selected to dampen the line on the ratio of neutral intrabars.
• A distinct weight can be attributed to the count of the latter half of intrabars, on the assumption that later intrabars may be more important in determining the outcome of chart bars.
• Allows control over the periods of the different moving averages used in calculations.
• The default periods used for the various calculations define the following hierarchy from slow to fast:
Balance Averages: 50,
Balance Momentum: 20,
Dual Up/Down Averages: 20,
Marker Bias: 10.
█ LIMITATIONS
• This script uses a special characteristic of the `security()` function allowing the inspection of intrabars—which is not officially supported by TradingView.
• The method used does not work on the realtime bar—only on historical bars.
• The indicator only works on some chart resolutions: 3, 5, 10, 15 and 30 minutes, 1, 2, 4, 6, and 12 hours, 1 day, 1 week and 1 month. The script’s code can be modified to run on other resolutions, but chart resolutions must be divisible by the lower resolution used for intrabars and the stepping mechanism could require adaptation.
• When using the "Line vs Divergence Levels — Dual Color Gradient" color mode to fill the line, background or chart bars, keep in mind that a line calculation mode must be defined for it to work, as it determines gradients on the movement of the line relative to divergence levels. If the line is hidden, it will not work.
• When the difference between the chart’s resolution and the intrabar resolution is too great, runtime errors will occur. The Auto-Steps selection mechanisms should avoid this.
• Alerts do not work reliably when `security()` is used at intrabar resolutions. Accordingly, no alerts are configured in the indicator.
• The color model used in the indicator provides for fancy visuals that come at a price; when you change values in Inputs , it can take 20 seconds for the changes to materialize. Luckily, once your color setup is complete, the color model does not have a large performance impact, as in normal operation the `security()` calls will become the most important factor in determining response time. Also, once in a while a runtime error will occur when you change inputs. Just making another change will usually bring the indicator back up.
█ RAMBLINGS
Is this thing useful?
I'll let you decide. Bar Balance acts somewhat like an X-Ray on bars. The intrabars it analyzes are no secret; one can simply change the chart's resolution to see the same intrabars the indicator uses. What the indicator brings to traders is the precise count of up/down/neutral intrabars and, more importantly, the calculations it derives from them to present the information in a way that can make it easier to use in trading decisions.
How reliable is Bar Balance information?
By the same token that an up bar does not guarantee that more up bars will follow, future price movements cannot be inferred from the mere count of up/down/neutral intrabars. Price movement during any chart bar for which, let's say, 12 intrabars are analyzed, could be due to only one of those intrabars. One can thus easily see how only relying on bar balance information could be very misleading. The rationale behind Bar Balance is that when the information mined for multiple chart bars is aggregated, it can provide insight into the history behind chart bars, and thus some bias as to the strength of movements. An up chart bar where 11/12 intrabars are also up is assumed to be stronger than the same up bar where only 2/12 intrabars are up. This logic is not bulletproof, and sometimes Bar Balance will stray. Also, keep in mind that balance lines do not represent price momentum as RSI would. Bar Balance calculations have no idea where price is. Their perspective, like that of any historian, is very limited, constrained that it is to the narrow universe of up/down/neutral intrabar counts. You will thus see instances where price is moving up while Balance Momentum, for example, is moving down. When Bar Balance performs as intended, this indicates that the rally is weakening, which does necessarily imply that price will reverse. Occasionally, price will merrily continue to advance on weakening strength.
Divergences
Most of the divergence detection methods used here rely on a difference between the bias of a calculation involving a multi-bar average and a given bar's price direction. When using "Bar Balance on Bar" however, only the bar's balance and price movement are used. This is the default mode.
As usual, divergences are points of interest because they reveal imbalances, which may or may not become turning points. I do not share the overwhelming enthusiasm traders have for the purported ability of bullish/bearish divergences to indicate imminent reversals.
Superfluity
In "The Bed of Procrustes", Nassim Nicholas Taleb writes: To bankrupt a fool, give him information . Bar Balance can display lots of information. While learning to use a new indicator inevitably requires an adaptation period where we put it through its paces and try out all its options, once you have become used to Bar Balance and decide to adopt it, rigorously eliminate the components you don't use and configure the remaining ones so their visual prominence reflects their relative importance in your analysis. I tried to provide flexible options for traders to control this indicator's visuals for that exact reason—not for window dressing.
█ NOTES
For traders
• To avoid misleading traders who don't read script descriptions, the indicator shows nothing in the realtime bar.
• The Data Window shows key values for the indicator.
• All gradients used in this indicator determine their brightness intensities using advances/declines in the signal—not their relative position in a fixed scale.
• Note that because of the way gradients are optimized internally, changing their brightness will sometimes require bringing down the value a few steps before you see an impact.
• Because this indicator does not use volume, it will work on all markets.
For coders
• For those interested in gradients, this script uses an advanced version of the Advance/Decline gradient function from the PineCoders Color Gradient (16 colors) Framework . It allows more precise control over the range, steps and min/max values of the gradients.
• I use the PineCoders Coding Conventions for Pine to write my scripts.
• I used functions modified from the PineCoders MTF Selection Framework for the selection of timeframes.
█ THANKS TO:
— alexgrover who helped me think through the dampening method used to attenuate signal lines on high ratios of neutral intrabars.
— A guy called Kuan who commented on a Backtest Rookies presentation of their Volume Profile indicator . The technique I use to inspect intrabars is derived from Kuan's code.
— theheirophant , my partner in the exploration of the sometimes weird abysses of `security()`’s behavior at intrabar resolutions.
— midtownsk8rguy , my brilliant companion in mining the depths of Pine graphics. He is also the co-author of the PineCoders Color Gradient Frameworks .
在腳本中搜尋"11月1日是什么星座"

Trend Exhaustion IndicatorThe Trend Exhaustion Indicator is a custom indicator of mine that is loosely based on the Trend Exhaustion Index created by Clifford L. Creel Ph.D. (Stocks & Commodities V. 9:1 (9-11))
This indicator will let you know the trend reversal points and when it falls below the signal line then the trend is ending vice versa. Buy when the indicator crosses above the signal line and sell when it falls below the signal line.
Let me know if you would like to see me write any other scripts!

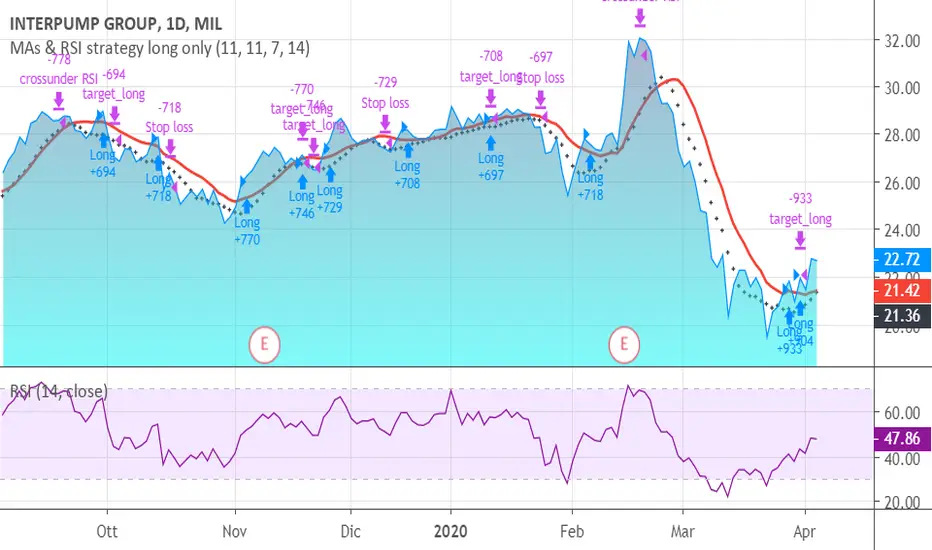
MAs & RSI strategy long onlyThis system originates from many articles by Enrico Malverti, Trading System, 2015.
Many trading systems are more stable if you use simple and not so innovative indicators, like exponential moving averages and Relative Strengthe index.
Differently by the original article:
- there is no ATR Filter, but we have introduced a Schaff Indicator. If you have multiple shares/commodities to choose, prefer what has a better value of Schaff;
- there is no fixed stop loss but a second moving average (fast), used as target. There are also Simple Mov Averages on lows (trailing stop loss for long) and a SMA on highs (trailing stop loss for short position).
Be careful, in the system only long case, because being short is not the reverse of being long (as stated in my blog)
SMA on highs are therefore only graphically put.
In this version, I’ve changed the “religious” use of EMAs (“sponsored by” Alexander Elder) to “ordinary” MAs: this because since simple moving averages measure all the factor in addition egual each one, this involve a sort of “offset” in the graph, while EMAs give a major “importance” to the last value (last close itself, you’re already considering): therefore this calculation may be counterproductive.
HOW TO OPERATE
BUY when prices crosses over SMAon long period (we suggest, however, sma long = Sma fast period = no. 11 for italian and european shares)
SELL when
prices go under SMA on lows (7 period), or under on SMA fast!
RSI crosses under level 70 or is higher than 75 (or 80, but in code there is 75)
6 Moving Averages with MTF v1.0This indicator is a collection of 6 different period Moving Averages. It has support for different time-frame resolution for all of them individually.
Also, it has 11 different type of Moving Average calculation functions:
1. Simple Moving Average (SMA)
2. Exponential Moving Average (EMA)
3. Weighted Moving Average (WMA)
4. Volume Weighted Moving Average (VWMA)
5. Smoothed Moving Average (SMMA)
6. Double Exponential Moving Average (DEMA)
7. Triple Exponential Moving Average (TEMA)
8. Hull WMA Moving Average (HullMA)
9. Triangular Moving Average (TMA)
10. Super Smoother Moving Average (SSMA)
11. Zero Lag Exponential Moving Average (ZEMA)
Note: The Moving Average calculation function is adapted from @JustUncleL
Happy trading 😉
Thank you.

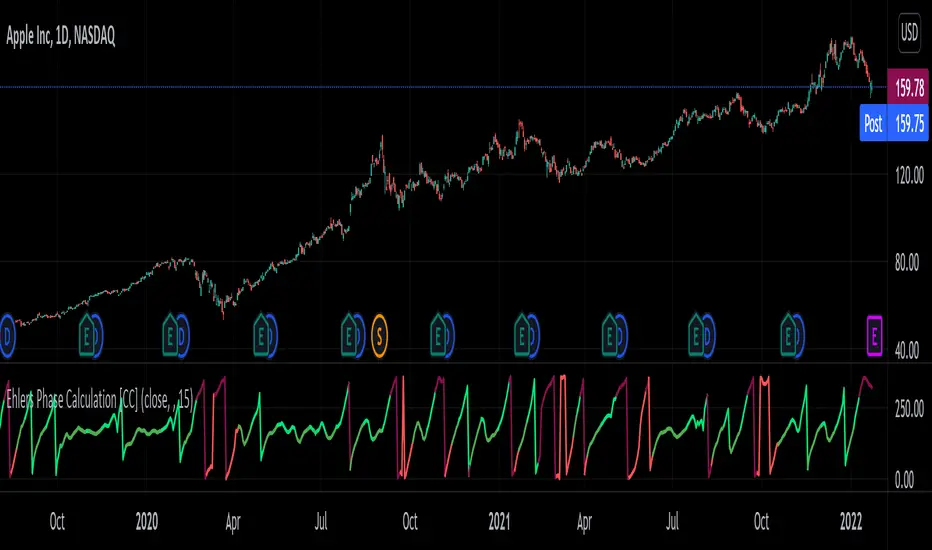
Phase CalculationPhase Calculation was authored by John F. Elders in the Stocks and Commodities Magazine 11/1996
This indicator will tell you if the stock is in a uptrend or downtrend. A phase number with a low number means it is in a uptrend and a phase number with a high number means it is in a downtrend.
Let me know if you want to see me write code for different indicators!

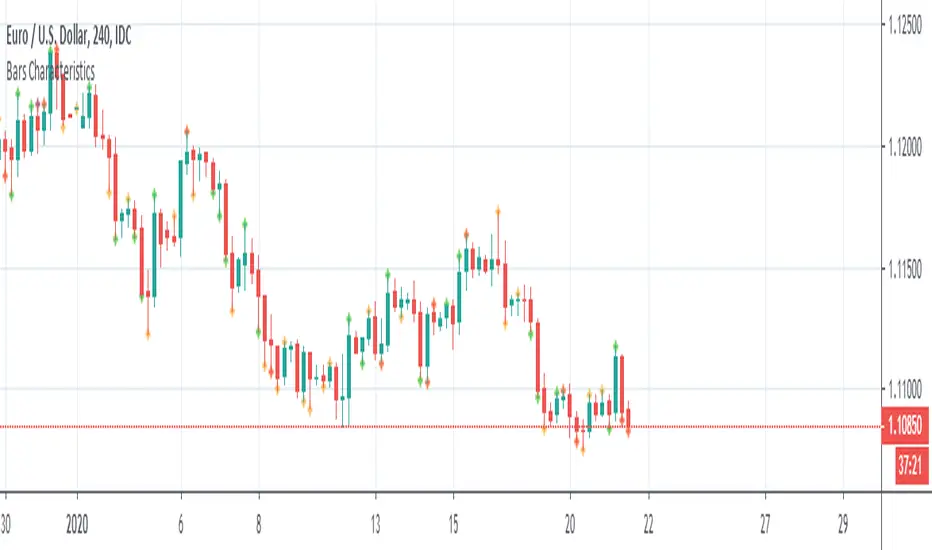
Bars CharacteristicsThis code is for defining or explaining market conditions via micro trend and the characterized bars.
lines 5,6: show the conditions for a normal trend, means market can go in the direction that it has in the past.
lines 11,12: show the conditions for kind of the trend having cumulative energy itself, mean market can go in the same direction.
lines 18,19: show the conditions for kind of the trend having overbought/sold concept, means it's better exit from the market or to look for the other clues.
lines 24,25: show some kind of noise not a stable trend, it's better not to enter the market.
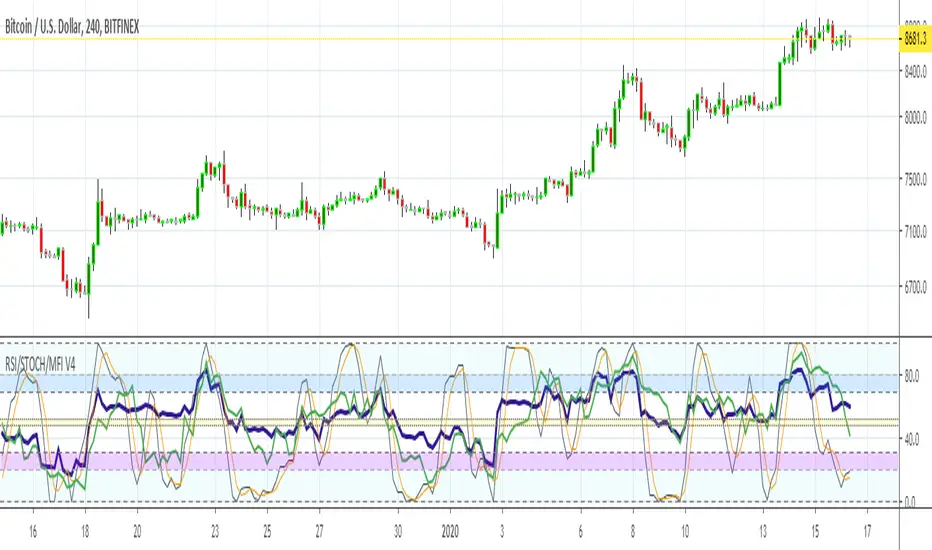
MFI RSI w STOCH OVERLAY V3Combines: Relative Strength (purple) and RSI Stoch (Orange/gray), Money Flow (green) all in one indicator window.
On screen indicator text identifier will read in this order: "RSI/STOCH/MFI V3"
// Changes from original version \\
It was important to bring forth the RSI indicator as the most visually important line and its relationship to the background.
A: Major visual changes from my first published one..as default now
1: Increased RSI line to size 3
2: Increased MFI line to size 2
3: Separated all Bar Line Fields in the background for custom editing, total of 5 now. Much easier to distinguish when the RSI enters these fields.
B: Other major changes as default now
1: Sped up the indicators from 14 to 11, for quicker response. (user can adjust back to 14 or another number)
2: Increased user friendly inputs to adjust colors, lines, data, etc.
3: (darken / lighten and change background colors, increase/decrease line strengths and colors, adjust field data inputs)
Enjoy and Good Luck Trading.
Trading Public School ST1This is a derivative of Trading Public School "TTM Squeeze" volatility indicator, as discussed in his book "Mastering the Trade" (chapter 11).
Black crosses on the midline show that the market just entered a squeeze ( Bollinger Bands are with in Keltner Channel). This signifies low volatility , market preparing itself for an explosive move (up or down). Gray crosses signify "Squeeze release".
Mr.Carter suggests waiting till the first gray after a black cross, and taking a position in the direction of the momentum (for ex., if momentum value is above zero, go long). Exit the position when the momentum changes (increase or decrease --- signified by a color change). My (limited) experience with this shows, an additional indicator like ADX / WaveTrend, is needed to not miss good entry points. Also, Mr.Carter uses simple momentum indicator , while I have used a different method (linreg based) to plot the histogram. 100% Profit & loss 10% Only

Squeeze Momentum Strategy based on Indicator [LazyBear][Bitduke]I improved Squeeze Momentum Indicator by LazyBear (momentum filter, changed data source to ohlc4) and transformed it into a strategy, adding a risk management system + ability to customize time frames for backtest.
Shortly about Squeeze Momentum Indicator:
This is a derivative of John Carter's "TTM Squeeze" volatility indicator, as discussed in his book "Mastering the Trade" (chapter 11).
Backtested on XBTUSD, ETHUSD (Bitmex). As you may notice it shows good results on 1h - 4h timeframes on these timeframes among these pairs. Relatively low drawdown ~ 12% (to date).

BitMEX pump catcher - MACDThis is a modified version of the BitMEX pump catcher by Jomy .
I have tweaked the algorithm to use the difference in MACD to get the correct direction of entries rather than using direction of candles which are not always indicative of trend direction. These changes increase net profit, profitable trades, while reducing drawdown.
Below is a copy and paste of Jomy's explanation of the algorithm.
What is going on here? This strategy is pretty simple. We start by measuring a very long chunk of volume history on BitMEX:XBTUSD 1 hour chart to find out if the current volume is high or low. At 1.0 the indicator is showing we are at 100% of normal historical volume . The blue line is a measure of recent volume! This indicator gets interested when the volume drops below 90% of the regular volume (0.9), and then comes back up over 90%. There's usually a pump of increased price activity during this time. When the 0.9 line is crossed by the blue line, the indicator surveys the last 2 bars of price action to figure out which way we're going, long or short. Green is long. Red is short. To exit the trade we use a 7 period fast ema of the volume crossing under an 11 ema slower period which shows declining interest in the market signifying an end to the pump or dump. The profit factor is quite high with 5x leverage, but historically we see 50% drawdown -- very risky. 1x leverage looks nice and tight with very low drawdown. Play with the inputs to see what matches your own risk profile. I would not recommend taking this into much lower timeframes as trading fees are not included in the profit calculations. Please don't get burned trading on stupid high leverage. This indicator is probably not going to work well on alts, as Bitcoin FOMO build up and behavior is different. This whole indicator is tuned to Bitcoin , and attempts to trade only the meatiest part of the market moves.
Jomy should get full credit to this indicator

BitMEX pump catcherWhat is going on here? This strategy is pretty simple. We start by measuring a very long chunk of volume history on BitMEX:XBTUSD 1 hour chart to find out if the current volume is high or low. At 1.0 the indicator is showing we are at 100% of normal historical volume. The blue line is a measure of recent volume! This indicator gets interested when the volume drops below 90% of the regular volume (0.9), and then comes back up over 90%. There's usually a pump of increased price activity during this time. When the 0.9 line is crossed by the blue line, the indicator surveys the last 2 bars of price action to figure out which way we're going, long or short. Green is long. Red is short. To exit the trade we use a 7 period fast ema of the volume crossing under an 11 ema slower period which shows declining interest in the market signifying an end to the pump or dump. The profit factor is quite high with 5x leverage, but historically we see 50% drawdown -- very risky. 1x leverage looks nice and tight with very low drawdown. Play with the inputs to see what matches your own risk profile. I would not recommend taking this into much lower timeframes as trading fees are not included in the profit calculations. Please don't get burned trading on stupid high leverage. This indicator is probably not going to work well on alts, as Bitcoin FOMO build up and behavior is different. This whole indicator is tuned to Bitcoin, and attempts to trade only the meatiest part of the market moves.
Weaknesses: it can sometimes pick to trade the wrong direction if if hits support or resistance and changes direction after a trade is entered. Use a stoploss.
Strengths: It usually gets things right. Historically over 57% right.
Use at your own risk!

6 Figures Scalping 2x MACD10-11-2019
This script plots a double MACD in a new indicator pane
The default settings:
Pink = STD MACD , settings 12-26-9
Green - Fast MACD, settings 5-15-1
The MACD settings can be changed in the indicators setting window

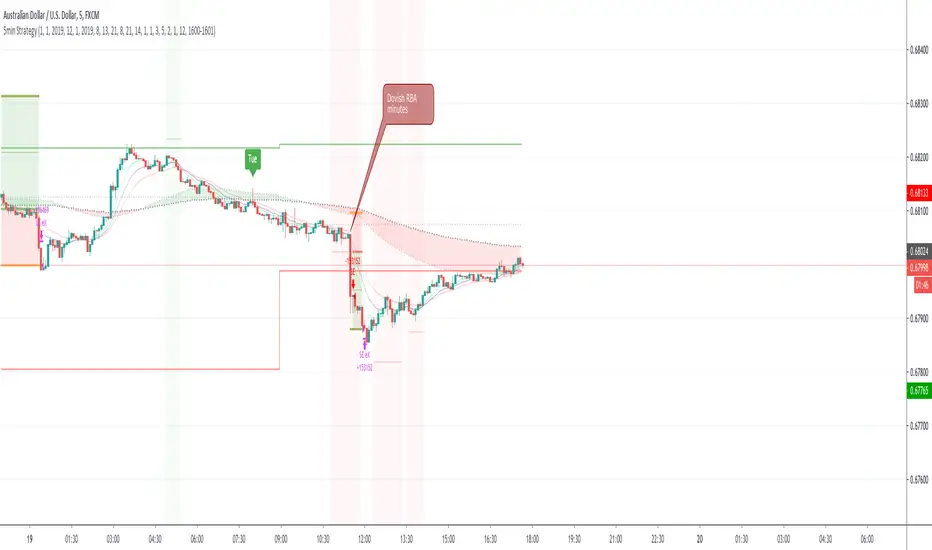
First time coding - a 5min forex Scalping strategy This is my first attempt at producing a strategy in Pine Script.
I am NOT a professional coder. I'm not even a good coder at that. I've only started Pine Script coding since September 2019. I am teaching myself.
This script is far from finished. I need to tweak a number of things about this script. Namely:
Add a validity window to the 'trigger bar' condition. Ie, I want to shut down the condition when the price closes above EMA21
Change the order entry so they are stop orders, using the stop entry price derived from the signals
Make changes to lot sizing
Add a trailing stop condition
Comments welcome, but do not expect me to reply to any questions or requests. In fact, don't expect any replies from me. I consider myself notoriously bad at replies.
I do welcome any feedback from any seasoned coders out there, as I am still a novice coder, and have so much to learn!
As to anyone who wants to criticise me - constructive and helpful criticism are most welcome, criticism to make yourself feel superior to me - you kind can eat a dk.
For the strategy rules, google the user ForexSignals TV account and look for the video "SIMPLE and PROFITABLE Forex Scalping Strategy".
Share, learn, prosper
Peace to y'all
Serialhenry
6/11/19
Easy to Use Stochastic + RSI StrategyA simple strategy that yields some great results.
CODE VARIABLES
LINE 2 - Here you can change your currency and amount you want to invest on each entry.
LINE 10/11/12 - Here we establish what date we want to start backtesting from. Simply change the defval on each line to change the date (In the code below we start on Jan 1st, 2014).
LINES 19 through 27 - Here we set our Stochastic and RSI sensitivity (Currently %K = 14, %D = 3, RSI = 14). Change these to your preference.
LINE 39/41 - Here we execute our orders (Currently set when %K crosses %D under the 20 value and RSI is less than 50 to BUY, %K crosses %D above the 80 value and RSI is greater than 60 to SELL). Change these to your preference.
NOTE: As a beginner you may not want to short stock, therefore LINE 6 was added to only allow long positions.
I didn't overlay the RSI value over the Stochastics because it was too cluttered. Just add the RSI indictor seperately to your layout.
As always, couple this with trend following and exit/entry rules to make the profitability even higher!
Cheers!

MAC-Z [ChuckBanger]Here I show the relationship between the MACD and Z-Score in a indicator called MAC-Z. MACD is short for moving average convergence/divergence and is in it self showing the relationship between two EMA. The Z-Score in contrast is related to Bollinger Bands and in MAC-Z the Z-score is the difference between the current price and a moving average divided by the standard deviation of price over the same time period.
MAC-Z has its best use in the short term time frames in my opinion compared to MACD. Here i show from current time of writing how effective it is.
More info on MAC-Z:
cssanalytics.wordpress.com
Also take a look at MACD Leader:

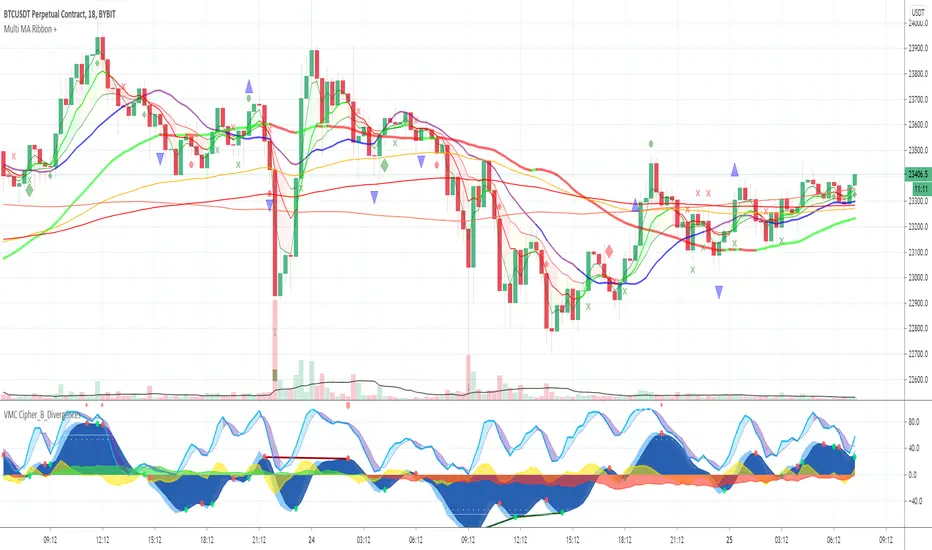
Multi MA Ribbon +Draws an MA Ribbon that highlights major MA's and for easier visibility separates them into different groups including Custom MA's, Baseline MA's, T Line MA's, Short Term MA's and Long Term MA's.
Choose between 11 different types of MA's thanks to JustUncleL and John F. Ehlers super smoother.
The + is for various signals and alerts derived from Market Cipher / Wave Trend indicators and TCG etc.
Happy Trading and remember just follow the flow of the river!
Currency Strength Gold MethodolgyThis script was written by, and used with the express permission of, Eduardo Andrade. The purpose of the script is easily determine respective currencies strength and weakness as utilized in The Gold Methodology - Ichimoku.
Tradingview members can use this script to see how each currency pair performed the day before as the reading is based is based upon the 11:00 p.m. GMT 60 minute candle (just before the Tokyo open).
Each currency is ranked in order of descending Strength and are designated by the following colors:
Orange = AUD
Green = CAD
Aqua = CHF
Purple = EUR
Red = GBP
Yellow = JPY
Black = NZD
Blue = USD
I hope you find he script beneficial and if you have any questions, please comment or send me a message.
have a great weekend!!
Allen

Saturn–Pluto Cycle
Indicator colors background of the chart in the following way:
Saturn - Pluto Cycle in conjunction: Blue
Saturn - Pluto Cycle in opposition: Yellow
While opposition periods are indicated according to the actual date ranges an opposition occurs, conjunctions last only for one day.
Conjunctions indicated with this indicator mark a period around the actual conjunction date.
The actual date a conjunction occurs is indicated in the script.
Following the dates which were considered for this indicator:
Dates of Saturn–Pluto Conjunctions
October 5, 1914 at 2° Cancer (recurrence on May 20, 1915)
August 11, 1947 at 13° Leo
November 8, 1982 at 27° Libra
January 12, 2020 at 22° Capricorn
Dates of Saturn–Pluto Oppositions
February 17, 1931 – December 13, 1931 at 19°–21° Capricorn–Cancer (conjunct their respective North and South Nodes)
April 23, 1965 – February 20, 1966 at 14°–17° Pisces–Virgo
August 5, 2001 – May 26, 2002 at 12°–16° Gemini–Sagittarius (conjunct the lunar nodes)


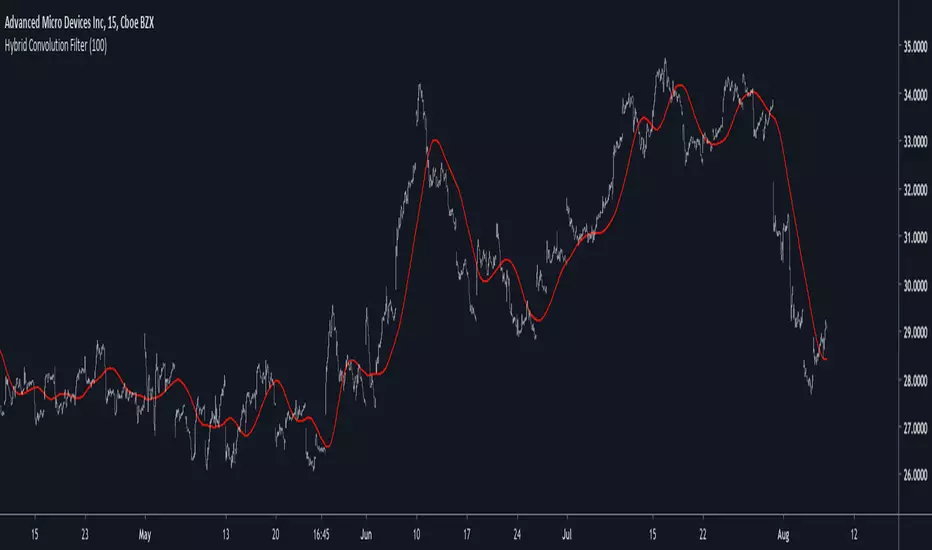
Hybrid Convolution FilterIntroduction
Today i propose an hybrid filter that use a classical FIR architecture while using recursion. The proposed method aim to reduce the lag generated by fir filters. This particular filter is a sine weighted moving average, but you can change it since the indicator is built with the custom filter template (1). Even if it use recursion it still is a FIR filter since the impulse response is finite.
The Indicator
In red the hybrid swma and in blue the classic swma of both the same period. The difference can be seen.
The switch between the input price and the past values of the previous convolution values is made by using exponential averaging, the window function is the same as f(x) in the code.
Any filter can use this architecture, the indicator is built around the custom fir template, see (1)
Conclusion
I presented a FIR filter using recursion in its calculation, the integration is made with respect to the proposed template, therefore any user can simply modify f(x) to have different filter without the need to make any change. However curious users might want to change the window function of the exponential averager, in order to do so change sgn = f(i/length) in line 11 for sgn = fun(i/length) where fun is your custom function, make sure to add it at the start of the script where all the other functions declarations are.
Thanks for reading !
(1)
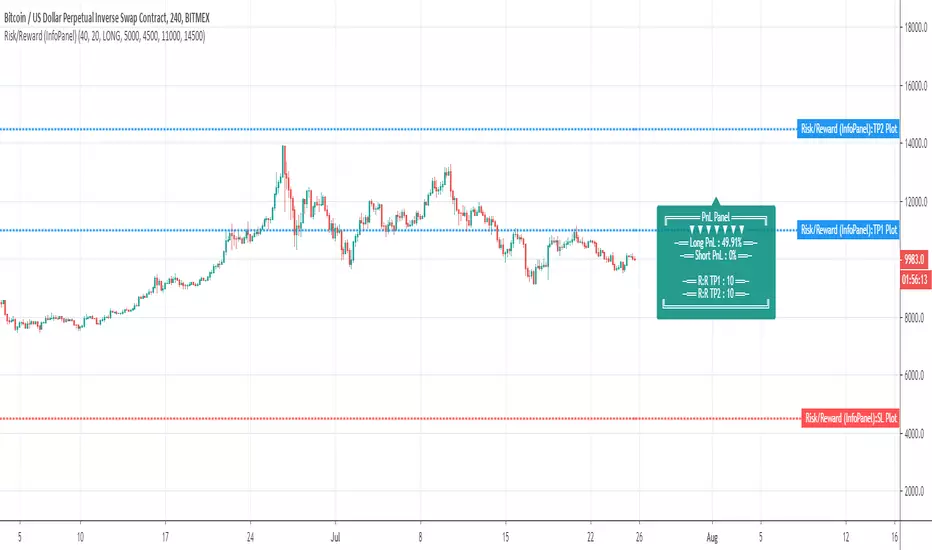
Risk/Reward (InfoPanel)Hello ladies (if any in my followers ?) and gentlemen
Here's your indicator of the day and once again given for FREE. What I'm going to say to my landlord if I can't pay rent because I'm not asking for $$ ?
I'll probably send the next indicators from below the town brige. Even then... I will still comply with my challenge to share 1 original indicator a day and not a copy of what already exists
The today indicator is to show you the great possibilites behind the TradingView Label object : Label
Profit And Loss LABEL
I thought about that one for a while and wanted to share how we can calculate dynamically a Risk to Reward ratio .
This indicator is not based on the price on the chart. I repeat before getting the question asked me privately 10 times This indicator is not based on the price on the chart.
"Then it's not useful dude, you're dumb". I agree and.... I agree... BUT you can now calculate your Risk to Reward ratio on TradingView directly rather than using an external Excel file. Who's dumb now :) ?
For those curious about it, I used this formula for the R:R ratio formula Calculating-risk-reward.asp
It will also display the Profit and Loss data based on your inputs only
ERRORS LABEL
I also added some basic errors management. If any error occur when you'll type your inputs, then a very mean Error label will appear and you'll have to fix the issues in less than a few seconds.
Otherwise your computer will explode (KABOOOOM) and your trading capital will be redirected to my own insurance fund (I have a family to feed, thanks for your sacrifices)
(end of joke)
In more seriousness, the engine will check if the TP1/TP2/Stop Loss/Entry price combinaisons makes sense. If not, you''ll be punished with an error label.
You can use this methodology for your own indicators in the futur to display dynamic messages based on users' inputs and/or current price on the chart
The educational video giving more details is coming right up.
You can watch it and should be located under "IDEAS"
Wshing you all a very fruitful end of your day and see you tomorrow for the last indicator of the week (baby David is tired and need his rest)
Dave