MACD Color Trawler (by ChartArt)This version of the MACD indicator is 'trawling' (checking) if the MACD histogram and the zero line crossing with the MACD line are both positive or negative. The idea behind this is to show areas with higher or lower risk.
Features:
1. Enable the bar color
2. Enable the background color
3. Change zero line value
FYI:
"The MACD-Histogram is an indicator of an indicator. In fact, MACD is also an indicator of an indicator. This means that the MACD-Histogram is the fourth derivative of price."
First derivative: 12-day EMA and 26-day EMA
Second derivative: MACD (12-day EMA less the 26-day EMA)
Third derivative: MACD signal line (9-day EMA of MACD)
Fourth derivative: MACD-Histogram (MACD less MACD signal line)
Source: stockcharts.com
在腳本中搜尋"12月4号是什么星座"

6 EMA - 6 SMA This indicator will allow you to place on the chart at the same time 6 EMAs and 6 SMAs if you want — a total of 12 EMAs/SMAs!

Momentum Grid 2.1 + Top Stocks📊 MOMENTUM GRID 2.1 + TOP STOCKS
Overview
A multi-timeframe confirmation system specifically designed for NIFTY 50 and BANK NIFTY index options trading. This script combines 8 independent technical indicators into a weighted scoring model to generate high-probability CE (Call) and PE (Put) signals, while simultaneously tracking the top 5 constituent stocks for sector-wide momentum validation.
________________________________________
🎯 Core Methodology
1. 8-Factor Confirmation System
Unlike traditional single-indicator approaches, this script requires multiple confirmations before generating signals. Each factor votes independently:
Trend Alignment (3 votes):
• C1: Price above/below EMA 9 (immediate trend)
• C2: EMA 9 above/below EMA 20 (short-term momentum)
• C3: EMA 20 above/below EMA 50 (intermediate trend)
Oscillator Confirmation (3 votes):
• C4: RSI above/below 50 (momentum strength)
• C5: Stochastic K above/below D (entry timing)
• C6: MACD Histogram positive/negative (momentum direction)
Advanced Momentum (2 votes):
• C7: Parabolic SAR position (trend continuation)
• C8: Squeeze Momentum direction (volatility expansion)
Mathematical Logic:
Bullish Score = C1 + C2 + C3 + C4 + C5 + C6 + C7 + C8
Signal Triggered when Score ≥ Threshold (default: 5/8)
Why This Works: By requiring 5+ confirmations, the script filters out false signals that occur when only 1-2 indicators align by chance. This dramatically reduces whipsaws in choppy markets.
________________________________________
📈 Constituent Stock Analysis System
Real-Time Top 5 Stocks Tracking
The script fetches live data from the most heavily-weighted stocks in the selected index:
NIFTY 50 Constituents:
• Reliance Industries
• HDFC Bank
• Infosys
• ICICI Bank
• TCS
BANK NIFTY Constituents:
• HDFC Bank
• ICICI Bank
• Kotak Mahindra Bank
• State Bank of India
• Axis Bank
Stock Scoring Algorithm (0-6 Scale):
For each stock, the script calculates a momentum score based on:
1. Price vs EMA 9 position
2. EMA 9 vs EMA 20 relationship
3. EMA 20 vs EMA 50 hierarchy
4. RSI above/below 50
5. MACD histogram direction
6. Intraday price change direction
Signal Interpretation:
• 🚀🔥 Strong Bullish: Score ≥5 + Day Change >0.5%
• ⚠️❄️ Strong Bearish: Score ≤1 + Day Change <-0.5%
• 📈 Moderate Bullish: Score ≥3 + Positive change
• 📉 Moderate Bearish: Score ≤3 + Negative change
Why Track Constituents?
Index options are a weighted average of their components. When 4 out of 5 top stocks show strong bullish signals but the index signal is neutral, it indicates:
• Sector rotation is happening
• Underlying strength not yet reflected in index
• Early warning for potential index breakout
________________________________________
🎨 Visual Dashboard System
1. Main Momentum Grid (Middle Right)
Real-time status of all 8 confirmation factors:
• Individual indicator values
• Bullish/Bearish status per indicator
• Cumulative Bull Score and Bear Score
• Visual color coding (Green = Bullish, Red = Bearish)
2. Top Stocks Status Panel (Top Right)
Live tracking table showing:
• LTP (Last Traded Price): Current stock price
• Day Change %: Intraday movement from open
• Status: Overall bullish/bearish trend
• EMA Status: Position relative to EMA 9
• Signal Emoji: Visual strength indicator
3. Scenario Guide (Bottom Right)
Auto-calculates trade parameters based on current signal:
• Side: CE (Call) or PE (Put) recommendation
• Strike Reference: Current index price
• Trigger Level: Entry confirmation level (high/low of signal bar)
• Risk Limit: Stop loss using 1.5x ATR
• Price Objective: Target using 2.5x ATR
ATR-Based Risk Management: Average True Range (14-period) adapts stop-loss and targets to current volatility, ensuring consistent risk-reward ratios across different market conditions.
________________________________________
🚨 Signal Generation Logic
CE (Call) Signal Triggers When:
1. Bullish Score ≥ Threshold (5/8 default)
2. Previous bar Bullish Score < Threshold
3. Confirmation candle closes above EMA 9
4. Background turns light green
PE (Put) Signal Triggers When:
1. Bearish Score ≥ Threshold (5/8 default)
2. Previous bar Bearish Score < Threshold
3. Confirmation candle closes below EMA 9
4. Background turns light red
Signal Validation: Labels appear only when a new qualifying bar completes, preventing repainting. The tooltip shows the exact score and entry price for record-keeping.
________________________________________
🔧 Customization Options
Parameter Purpose Recommendation
Index Selection Choose NIFTY 50 or BANK NIFTY Match to your trading instrument
EMA Periods Adjust trend sensitivity Default (9/20/50/100) suits 5-15 min
Signal Threshold Min confirmations required 5/8 (balanced), 6/8 (conservative)
RSI Length Momentum calculation period 14 (standard), 21 (smoother)
MACD Settings Fast/Slow/Signal periods 12/26/9 (industry standard)
________________________________________
📊 Technical Indicator Details
Exponential Moving Averages (EMA)
• Why EMA vs SMA: Exponential weighting gives more importance to recent price action, making it more responsive to trend changes in fast-moving index options.
Relative Strength Index (RSI)
• Measures momentum on 0-100 scale
• 50 level acts as bull/bear dividing line
• Used for confirmation, not overbought/oversold
Stochastic Oscillator
• Compares closing price to recent range
• K line crossing above D line = bullish momentum shift
• Sensitive to short-term reversals
MACD (Moving Average Convergence Divergence)
• Histogram shows momentum acceleration/deceleration
• Positive histogram = increasing bullish momentum
• Used as tiebreaker when other signals conflict
Parabolic SAR
• Tracks stop-and-reverse points
• Dots below price = uptrend, above = downtrend
• Adds trend-following confirmation
Squeeze Momentum
• Identifies periods of low volatility (consolidation)
• Bollinger Bands inside Keltner Channels = "squeeze"
• Positive momentum during squeeze = bullish breakout setup
________________________________________
💡 What Makes This Script Unique
1. Index-Specific Design: Unlike generic multi-timeframe indicators, this is purpose-built for NIFTY/BANKNIFTY options with constituent stock correlation analysis.
2. Multi-Layer Validation: Combines price action (EMAs), momentum (RSI/Stoch/MACD), and volatility (Squeeze) for comprehensive market assessment.
3. Smart Constituent Tracking: Automatically switches stock universe based on selected index, providing sector-level context that single-chart indicators miss.
4. Adaptive Risk Management: ATR-based stop-loss and targets adjust to market volatility automatically, unlike fixed-point systems.
5. No Repainting: All calculations use confirmed bars with lookahead=barmerge.lookahead_off parameter, ensuring historical backtesting accuracy.
________________________________________
📚 Best Practices
Timeframe Selection:
• 5 min: Scalping (high frequency, tight stops)
• 15 min: Intraday swing trades (balanced)
• 1 hour: Positional option trades (overnight holds)
Trade Execution:
1. Wait for CE/PE label to appear
2. Check Top Stocks Status - look for 3+ stocks confirming index direction
3. Verify Scenario Guide shows acceptable risk-reward (min 1:1.5)
4. Enter on next candle open or use trigger level for limit orders
5. Place stop-loss at "Risk Limit" level
6. Scale out at "Price Objective" or trail with Parabolic SAR
False Signal Filters:
• Avoid signals during first 15 minutes of market open (high volatility)
• Skip signals when Top Stocks show conflicting directions (3 bull, 2 bear)
• Increase threshold to 6/8 during major news events
• Disable trading 30 minutes before important announcements
________________________________________
⚠️ Limitations & Considerations
• Index Options Specific: Optimized for NIFTY/BANKNIFTY - may need recalibration for other instruments
• Not Suitable for Trending Markets: Works best in swing/range conditions; reduce threshold in strong trends
• Constituent Data Dependency: Relies on accurate real-time stock data; verify broker data quality
• Options Greeks Ignored: Script doesn't account for theta decay, IV changes - user must manage option selection
________________________________________
🔔 Built-In Alerts
Set alerts for:
• CE Signal Generated: Bullish score crosses threshold
• PE Signal Generated: Bearish score crosses threshold
Alert messages include ticker symbol and entry price for quick execution.
________________________________________
📈 Performance Optimization Tips
1. Score Correlation Check: If Bull Score and Bear Score are both high (6+/8), market is conflicted - wait for resolution.
2. Stock Divergence Strategy: When 4/5 stocks are bullish but index shows PE signal, it often indicates a false breakdown - counter-trend opportunity.
3. Squeeze Breakout Combo: Strongest signals occur when Squeeze changes from "ON" to "OFF" simultaneously with CE/PE trigger.
4. EMA Stacking: Maximum confidence signals have all three EMAs in proper order (9>20>50 for bull, reverse for bear).
________________________________________
🎓 Educational Context
This methodology synthesizes:
• Multi-Timeframe Analysis: EMAs represent different trend horizons
• Oscillator Convergence: Multiple momentum tools reduce false positives
• Index Arbitrage Concepts: Constituent tracking exploits pricing inefficiencies
• Adaptive Volatility: ATR-based risk scales with market conditions
The 8-factor system mirrors institutional decision frameworks where analysts require consensus across multiple models before position changes.
________________________________________
📋 Quick Reference
Bullish Setup Checklist: ✅ Bull Score ≥ 5/8
✅ Green background color
✅ 3+ top stocks showing 📈 or 🚀
✅ Price above EMA 9
✅ MACD Histogram positive
Bearish Setup Checklist: ✅ Bear Score ≥ 5/8
✅ Red background color
✅ 3+ top stocks showing 📉 or ⚠️
✅ Price below EMA 9
✅ MACD Histogram negative
________________________________________
⚖️ Disclaimer
This indicator is a decision support tool, not an automated trading system. Index options involve substantial risk and can result in total loss of premium paid. The constituent stock analysis provides context but does not guarantee index price movement. Users must:
• Understand options Greeks (delta, theta, vega)
• Use proper position sizing (max 2-3% capital per trade)
• Never trade based on signals alone without market context
• Comply with SEBI regulations and broker policies
Past performance of signals does not guarantee future results.
________________________________________
Version: Pine Script v6
Supported Indices: NIFTY 50, BANK NIFTY
Resource Usage: Moderate (Multi-security data requests)
Update Frequency: Real-time on current timeframe
________________________________________
For support or suggestions, please comment below. If this script helps your trading, please like and follow for updates! 🚀📊

Smart Money COTThis indicator implements the method of analysing COT data as defined by Michael Huddleston (I.E. The Inner Circle Trader). It removes all superfluous information contained in the standard COT reports and focusses only on Commercial speculators using the overall Long-Short positions.
Features
The unique feature of this indicator is its ability to look back over time and provide the following information:
Calculation of the range high and low of the specified lookback range.
Calculation of equilibrium of that range.
Automatic colour coding of net long and net short positions when the Long-Short COT calculation is above or below equilibrium of the lookback range.
Instructions
Use the Daily Timeframe only. You may get unexpected results on other timeframes.
Ensure the asset has COT data available. Script is mainly focused on commodity futures, such as ES, NQ, YM. It has not been tested against Forex.
You will need to define the "Lookback" setting in the script settings. Use the total number of trading days required for your analysis. E.g. if you want a 6 month COT analysis, use the measurement tool to count the quantity of daily candles between now and 6 months ago - use this as your Lookback setting. Adjust as needed for other lookback periods, e.g. 3 months, 12 months etc.
Other Info
The script provides the ability to customise colours in its settings.
Range High and Range Low plots can be disabled in settings.

Stochastic Hash Strat [Hash Capital Research]# Stochastic Hash Strategy by Hash Capital Research
## 🎯 What Is This Strategy?
The **Stochastic Slow Strategy** is a momentum-based trading system that identifies oversold and overbought market conditions to capture mean-reversion opportunities. Think of it as a "buy low, sell high" approach with smart mathematical filters that remove emotion from your trading decisions.
Unlike fast-moving indicators that generate excessive noise, this strategy uses **smoothed stochastic oscillators** to identify only the highest-probability setups when momentum truly shifts.
---
## 💡 Why This Strategy Works
Most traders fail because they:
- **Chase prices** after big moves (buying high, selling low)
- **Overtrade** in choppy, directionless markets
- **Exit too early** or hold losses too long
This strategy solves all three problems:
1. **Entry Discipline**: Only trades when the stochastic oscillator crosses in extreme zones (oversold for longs, overbought for shorts)
2. **Cooldown Filter**: Prevents revenge trading by forcing a waiting period after each trade
3. **Fixed Risk/Reward**: Pre-defined stop-loss and take-profit levels ensure consistent risk management
**The Math Behind It**: The stochastic oscillator measures where the current price sits relative to its recent high-low range. When it's below 25, the market is oversold (time to buy). When above 70, it's overbought (time to sell). The crossover with its moving average confirms momentum is shifting.
---
## 📊 Best Markets & Timeframes
### ⭐ OPTIMAL PERFORMANCE:
**Crude Oil (WTI) - 12H Timeframe**
- **Why it works**: Oil markets have predictable volatility patterns and respect technical levels
**AAVE/USD - 4H to 12H Timeframe**
- **Why it works**: DeFi tokens exhibit strong momentum cycles with clear extremes
### ✅ Also Works Well On:
- **BTC/USD** (12H, Daily) - Lower frequency but high win rate
- **ETH/USD** (8H, 12H) - Balanced volatility and liquidity
- **Gold (XAU/USD)** (Daily) - Classic mean-reversion asset
- **EUR/USD** (4H, 8H) - Lower volatility, requires patience
### ❌ Avoid Using On:
- Timeframes below 4H (too much noise)
- Low-liquidity altcoins (wide spreads kill performance)
- Strongly trending markets without pullbacks (Bitcoin in 2021)
- News-driven instruments during major events
---
## 🎛️ Understanding The Settings
### Core Stochastic Parameters
**Stochastic Length (Default: 16)**
- Controls the lookback period for price comparison
- Lower = faster reactions, more signals (10-14 for volatile markets)
- Higher = smoother signals, fewer trades (16-21 for stable markets)
- **Pro tip**: Use 10 for crypto 4H, 16 for commodities 12H
**Overbought Level (Default: 70)**
- Threshold for short entries
- Lower values (65-70) = more trades, earlier entries
- Higher values (75-80) = fewer but higher-conviction trades
- **Sweet spot**: 70 works for most assets
**Oversold Level (Default: 25)**
- Threshold for long entries
- Higher values (25-30) = more trades, earlier entries
- Lower values (15-20) = fewer but stronger bounce setups
- **Sweet spot**: 20-25 depending on market conditions
**Smooth K & Smooth D (Default: 7 & 3)**
- Additional smoothing to filter out whipsaws
- K=7 makes the indicator slower and more reliable
- D=3 is the signal line that confirms the trend
- **Don't change these unless you know what you're doing**
---
### Risk Management
**Stop Loss % (Default: 2.2%)**
- Automatically exits losing trades
- Should be 1.5x to 2x your average market volatility
- Too tight = death by a thousand cuts
- Too wide = uncontrolled losses
- **Calibration**: Check ATR indicator and set SL slightly above it
**Take Profit % (Default: 7%)**
- Automatically exits winning trades
- Should be 2.5x to 3x your stop loss (reward-to-risk ratio)
- This default gives 7% / 2.2% = 3.18:1 R:R
- **The golden rule**: Never have R:R below 2:1
---
### Trade Filters
**Bar Cooldown Filter (Default: ON, 3 bars)**
- **What it does**: Forces you to wait X bars after closing a trade before entering a new one
- **Why it matters**: Prevents emotional revenge trading and overtrading in choppy markets
- **Settings guide**:
- 3 bars = Standard (good for most cases)
- 5-7 bars = Conservative (oil, slow-moving assets)
- 1-2 bars = Aggressive (only for experienced traders)
**Exit on Opposite Extreme (Default: ON)**
- Closes your long when stochastic hits overbought (and vice versa)
- Acts as an early profit-taking mechanism
- **Leave this ON** unless you're testing other exit strategies
**Divergence Filter (Default: OFF)**
- Looks for price/momentum divergences for additional confirmation
- **When to enable**: Trending markets where you want fewer but higher-quality trades
- **Keep OFF for**: Mean-reverting markets (oil, forex, most of the time)
---
## 🚀 Quick Start Guide
### Step 1: Set Up in TradingView
1. Open TradingView and navigate to your chart
2. Click "Pine Editor" at the bottom
3. Copy and paste the strategy code
4. Click "Add to Chart"
5. The strategy will appear in a separate pane below your price chart
### Step 2: Choose Your Market
**If you're trading Crude Oil:**
- Timeframe: 12H
- Keep all default settings
- Watch for signals during London/NY overlap (8am-11am EST)
**If you're trading AAVE or crypto:**
- Timeframe: 4H or 12H
- Consider these adjustments:
- Stochastic Length: 10-14 (faster)
- Oversold: 20 (more aggressive)
- Take Profit: 8-10% (higher targets)
### Step 3: Wait for Your First Signal
**LONG Entry** (Green circle appears):
- Stochastic crosses up below oversold level (25)
- Price likely near recent lows
- System places limit order at take profit and stop loss
**SHORT Entry** (Red circle appears):
- Stochastic crosses down above overbought level (70)
- Price likely near recent highs
- System places limit order at take profit and stop loss
**EXIT** (Orange circle):
- Position closes either at stop, target, or opposite extreme
- Cooldown period begins
### Step 4: Let It Run
The biggest mistake? **Interfering with the system.**
- Don't close trades early because you're scared
- Don't skip signals because you "have a feeling"
- Don't increase position size after a big win
- Don't revenge trade after a loss
**Follow the system or don't use it at all.**
---
### Important Risks:
1. **Drawdown Pain**: You WILL experience losing streaks of 5-7 trades. This is mathematically normal.
2. **Whipsaw Markets**: Choppy, range-bound conditions can trigger multiple small losses.
3. **Gap Risk**: Overnight gaps can cause your actual fill to be worse than the stop loss.
4. **Slippage**: Real execution prices differ from backtested prices (factor in 0.1-0.2% slippage).
---
## 🔧 Optimization Guide
### When to Adjust Settings:
**Market Volatility Increased?**
- Widen stop loss by 0.5-1%
- Increase take profit proportionally
- Consider increasing cooldown to 5-7 bars
**Getting Too Few Signals?**
- Decrease stochastic length to 10-12
- Increase oversold to 30, decrease overbought to 65
- Reduce cooldown to 2 bars
**Getting Too Many Losses?**
- Increase stochastic length to 18-21 (slower, smoother)
- Enable divergence filter
- Increase cooldown to 5+ bars
- Verify you're on the right timeframe
### A/B Testing Method:
1. **Run default settings for 50 trades** on your chosen market
2. Document: Win rate, profit factor, max drawdown, emotional tolerance
3. **Change ONE variable** (e.g., oversold from 25 to 20)
4. Run another 50 trades
5. Compare results
6. Keep the better version
**Never change multiple settings at once** or you won't know what worked.
---
## 📚 Educational Resources
### Key Concepts to Learn:
**Stochastic Oscillator**
- Developed by George Lane in the 1950s
- Measures momentum by comparing closing price to price range
- Formula: %K = (Close - Low) / (High - Low) × 100
- Similar to RSI but more sensitive to price movements
**Mean Reversion vs. Trend Following**
- This is a **mean reversion** strategy (price returns to average)
- Works best in ranging markets with defined support/resistance
- Fails in strong trending markets (2017 Bitcoin, 2020 Tech stocks)
- Complement with trend filters for better results
**Risk:Reward Ratio**
- The cornerstone of profitable trading
- Winning 40% of trades with 3:1 R:R = profitable
- Winning 60% of trades with 1:1 R:R = breakeven (after fees)
- **This strategy aims for 45% win rate with 2.5-3:1 R:R**
### Recommended Reading:
- *"Trading Systems and Methods"* by Perry Kaufman (Chapter on Oscillators)
- *"Mean Reversion Trading Systems"* by Howard Bandy
- *"The New Trading for a Living"* by Dr. Alexander Elder
---
## 🛠️ Troubleshooting
### "I'm not seeing any signals!"
**Check:**
- Is your timeframe 4H or higher?
- Is the stochastic actually reaching extreme levels (check if your asset is stuck in middle range)?
- Is cooldown still active from a previous trade?
- Are you on a low-liquidity pair?
**Solution**: Switch to a more volatile asset or lower the overbought/oversold thresholds.
---
### "The strategy keeps losing money!"
**Check:**
- What's your win rate? (Below 35% is concerning)
- What's your profit factor? (Below 0.8 means serious issues)
- Are you trading during major news events?
- Is the market in a strong trend?
**Solution**:
1. Verify you're using recommended markets/timeframes
2. Increase cooldown period to avoid choppy markets
3. Reduce position size to 5% while you diagnose
4. Consider switching to daily timeframe for less noise
---
### "My stop losses keep getting hit!"
**Check:**
- Is your stop loss tighter than the average ATR?
- Are you trading during high-volatility sessions?
- Is slippage eating into your buffer?
**Solution**:
1. Calculate the 14-period ATR
2. Set stop loss to 1.5x the ATR value
3. Avoid trading right after market open or major news
4. Factor in 0.2% slippage for crypto, 0.1% for oil
---
## 💪 Pro Tips from the Trenches
### Psychological Discipline
**The Three Deadly Sins:**
1. **Skipping signals** - "This one doesn't feel right"
2. **Early exits** - "I'll just take profit here to be safe"
3. **Revenge trading** - "I need to make back that loss NOW"
**The Solution:** Treat your strategy like a business system. Would McDonald's skip making fries because the cashier "doesn't feel like it today"? No. Systems work because of consistency.
---
### Position Management
**Scaling In/Out** (Advanced)
- Enter 50% position at signal
- Add 50% if stochastic reaches 10 (oversold) or 90 (overbought)
- Exit 50% at 1.5x take profit, let the rest run
**This is NOT for beginners.** Master the basic system first.
---
### Market Awareness
**Oil Traders:**
- OPEC meetings = volatility spikes (avoid or widen stops)
- US inventory reports (Wed 10:30am EST) = avoid trading 2 hours before/after
- Summer driving season = different patterns than winter
**Crypto Traders:**
- Monday-Tuesday = typically lower volatility (fewer signals)
- Thursday-Sunday = higher volatility (more signals)
- Avoid trading during exchange maintenance windows
---
## ⚖️ Legal Disclaimer
This trading strategy is provided for **educational purposes only**.
- Past performance does not guarantee future results
- Trading involves substantial risk of loss
- Only trade with capital you can afford to lose
- No one associated with this strategy is a licensed financial advisor
- You are solely responsible for your trading decisions
**By using this strategy, you acknowledge that you understand and accept these risks.**
---
## 🙏 Acknowledgments
Strategy development inspired by:
- George Lane's original Stochastic Oscillator work
- Modern quantitative trading research
- Community feedback from hundreds of backtests
Built with ❤️ for retail traders who want systematic, disciplined approaches to the markets.
---
**Good luck, stay disciplined, and trade the system, not your emotions.**

Trinity KST (known sure thing) ProThis version is the **modern, low-lag evolution** of Martin Pring’s original 1990s KST.
Key differences from the classic KST
- Original uses only simple moving averages (SMA) on the four ROCs → quite a bit of lag.
- This version lets you replace every SMA with **ALMA, HEMA, TEMA, or EMA** → dramatically reduces lag while keeping the signal smooth and reliable.
- ALMA + progressive offset (0.90–0.97) is especially powerful because longer-term ROCs react almost as fast as the short ones without getting noisy.
- Histogram, clean labels inside the oscillator pane, alerts, background tint — all the quality-of-life stuff the original never had.
How traders actually use it in >2026
1. Primary signal: KST crosses above/below the red signal line = momentum shift (bullish/bearish).
2. Zero-line cross = confirmation of trend change (especially strong on daily/weekly).
3. Divergences between price and KST = high-probability reversals (works great on BTC, SPX, NAS100).
4. Histogram turning from red to green (or vice-versa) = early warning before the actual line cross.
Best settings I and many others run live right now (no table, just the winners)
- Crypto & Nasdaq: **ALMA + aggressiveness 0.93–0.96** → fastest valid signals.
- Forex pairs & Gold: **HEMA** (zero-lag Hull) → super clean, almost no whipsaw.
- Broad stock indices (SPX, DAX, etc.): **ALMA 0.91–0.93** or **TEMA** → perfect middle ground.
- Classic conservative daily/weekly swings: leave it on **SMA** (original Pring) or ALMA 0.88–0.90.
In short: same reliable KST logic you already know, but now it reacts 6–12 bars earlier and with far fewer fakeouts — exactly what you need in today’s fast markets.

Hash Supertrend [Hash Capital Research]Hash Supertrend Strategy by Hash Capital Research
Overview
Hash Supertrend is a professional-grade trend-following strategy that combines the proven Supertrend indicator with institutional visual design and flexible time filtering.
The strategy uses ATR-based volatility bands to identify trend direction and executes position reversals when the trend flips.This implementation features a distinctive fluorescent color system with customizable glow effects, making trend changes immediately visible while maintaining the clean, professional aesthetic expected in quantitative trading environments.
Entry Signals:
Long Entry: Price crosses above the Supertrend line (trend flips bullish)
Short Entry: Price crosses below the Supertrend line (trend flips bearish)
Controls the lookback period for volatility calculation
Lower values (7-10): More sensitive to price changes, generates more signals
Higher values (12-14): Smoother response, fewer signals but potentially delayed entries
Recommended range: 7-14 depending on market volatility
Factor (Default: 3.0)
Restricts trading to specific hours
Useful for avoiding low-liquidity sessions, overnight gaps, or known choppy periods
When disabled, strategy trades 24/7
Start Hour (Default: 9) & Start Minute (Default: 30)
Define when the trading session begins
Uses exchange timezone in 24-hour format
Example: 9:30 = 9:30 AM
End Hour (Default: 16) & End Minute (Default: 0)
Controls the vibrancy of the fluorescent color system
1-3: Subtle, muted colors
4-6: Balanced, moderate saturation
7-10: Bright, highly saturated fluorescent appearance
Affects both the Supertrend line and trend zones
Glow Effect (Default: On)
Adds luminous halo around the Supertrend line
Creates a multi-layered visual with depth
Particularly effective during strong trends
Glow Intensity (Default: 5.0)
Displays tiny fluorescent dots at entry points
Green dot below bar: Long entry
Red dot above bar: Short entry
Provides clear visual confirmation of executed trades
Show Trend Zone (Default: On)
Strong trending markets (2020-style bull runs, sustained bear markets)
Markets with clear directional bias
Instruments with consistent volatility patterns
Timeframes: 15m to Daily (optimal on 1H-4H)
Challenging Conditions:
Choppy, range-bound markets
Low volatility consolidation periods
Highly news-driven instruments with frequent gaps
Very low timeframes (1m-5m) prone to noise
Recommended AssetsCryptocurrency:

Vital Wave 20-50Simplicity is almost always the most effective approach, and here I’m giving you a trend-following system that exploits the bullish bias of traditional markets and their trending nature, with very basic rules.
Rules (long entries only)
• Market entry: When the EMA 20 crosses above the EMA 50 (from below)
• Main market exit: When the EMA 20 crosses below the EMA 50 (from above)
• Fixed Stop Loss: Placed at the price level of the Lower Bollinger Band at the moment the trade is entered.
In my strategy, the primary exit is when the EMA 20 crosses below the EMA 50. However, this crossover can sometimes take a while to occur, and in the meantime the price may have already dropped significantly. The Stop Loss based on the Lower Bollinger Band is designed to limit losses in case the market moves sharply against the position without giving the bearish crossover signal in time. Having two exit conditions makes the strategy much more robust in terms of risk management.
Risk Management:
• Initial capital: $10,000
• Position size: 10% of available capital per trade
• Commissions: 0.1% on traded volume
• Stop Loss: Based on the Lower Bollinger Band
• Take Profit / Exit: When EMA 20 crosses below EMA 50
Recommended Markets:
XAUUSD (OANDA) (Daily)
Period: January 3, 1833 – November 23, 2025
Total Profit & Loss: +$6,030.62 USD (+57.57%)
Maximum Drawdown: $541.53 USD (3.83%)
Total Trades: 136
Winning Trades (Win Rate): 36.03% (49/136)
Profit Factor: 2.483
XAUUSD (OANDA) (12-hour)
Period: March 19, 2006 – November 23, 2025
Total Profit & Loss: +$1,209.56 USD (+11.89%)
Maximum Drawdown: $384.58 USD (3.61%)
Total Trades: 97
Winning Trades (Win Rate): 35.05% (34/97)
Profit Factor: 1.676
XAUUSD (OANDA) (8-hour)
Period: March 19, 2006 – November 23, 2025
Total Profit & Loss: +$1,179.36 USD (+11.81%)
Maximum Drawdown: $246.88 USD (2.32%)
Total Trades: 147
Winning Trades (Win Rate): 31.97% (47/147)
Profit Factor: 1.626
Tesla (NASDAQ) (4-hour)
Period: June 29, 2010 – November 23, 2025
Total Profit & Loss (Absolute): +$11,687.90 USD (+116.88%)
Maximum Drawdown: $922.05 USD (6.50%)
Total Trades: 68
Winning Trades (Win Rate): 39.71% (27/68)
Profit Factor: 4.156
Tesla (NASDAQ) (3-hour)
Total Profit & Loss: +$11,522.33 USD (+115.22%)
Maximum Drawdown: $1,247.60 USD (8.80%)
Total Trades: 114
Winning Trades: 33.33% (38/114)
Profit Factor: 2.811
Additional Recommendations
(These assets have shown good trending behavior with the same strategy across multiple timeframes):
• NVDA (15 min, 30 min, 1h, 2h, 3h, 4h, 6h, 8h, 12h, Daily)
• NFLX (1h, 2h, 3h, 4h, 6h, 8h, 12h, Daily)
• MA (1h, 2h, 3h, 4h, 6h, 8h, 12h, Daily)
• META (1h, 2h, 3h, 4h, 6h, 8h, 12h, Daily)
• AAPL (1h, 2h, 3h, 4h, 6h, 8h, 12h, Daily)
• SPY (12h, Daily)
About the Code
The user can modify:
• EMA periods (20 and 50 by default)
• Bollinger Bands length (20 periods)
• Standard deviation (2.0)
Visualization
• EMA 20: Blue line
• EMA 50: Red line
• Green background when EMA20 > EMA50 (bullish trend)
• Red background when EMA20 < EMA50 (bearish trend)
Important Note:
We can significantly increase the profit factor and overall profitability by risking a fixed percentage per trade instead of a fixed amount. This would prevent losses from fluctuating with changes in volatility.
This could be implemented by reducing position size or adjusting leverage based on the volatility percentage required for each trade, but I’m not sure if this is fully possible in Pine Script. In my other script, “ Golden Cross 50/200 EMA ,” I go deeper into this topic and provide examples.
I hope you enjoy this contribution. Best regards!

RSI Hybrid + EMA Cloud + Swings(15m/2H)RSI Hybrid + EMA Cloud (15m Trend + 2H Momentum)
A dual-timeframe trading system combining fast 15-minute trend structure with higher-timeframe 2-Hour momentum, volume and structural levels.
🧩 What This Indicator Does
This tool blends:
🔹 15m Trend (EMA Cloud) – 2 Points
EMA 7 vs 21 → Short trend
EMA 30 vs 74 → Long trend
Cloud shading highlights bullish/bearish alignment
Faster, intraday trend sensitivity
🔹 2H Momentum (RSI Hybrid) – 3 Points
RSI > 50
RSI > SMA(4)
RSI > SMA(12)
Gives short / medium / long momentum confirmation from the higher timeframe.
🔹 2H Volume Pressure – 1 Point
Volume vs 20-SMA
Mild / Moderate / Strong Bull/Bear
Confirms true participation behind price moves
⭐ Score System (0–6 Total)
Component Points
15m EMA Trend 2
2H RSI Hybrid 3
2H Volume Power 1
Total 6
Interpretation:
5–6 → High-confluence direction
3–4 → Partial confluence
1–2 → Weak bias
0 → No reliable direction
Designed for discretionary and semi-systematic intraday traders.
📊 15m Structural Levels
Includes:
✔ Last confirmed 15m Swing High / Swing Low
Based on close-price pivots, not highs/lows.
✔ Live Running High since last Swing LOW
Tracks how far price has extended upward.
✔ Live Running Low since last Swing HIGH
Tracks downward extension after a swing high.
✔ ATR(15m)
Volatility reference for SL/TP or risk modeling.
These levels help in timing entries, managing stops, and identifying breakout/breakdown zones.
🖥 On-Chart Info Table
Summarizes:
15m EMA short & long trend
2H RSI short/medium/long momentum
RSI vs 50
2H volume power
Bull & Bear score (with breakdown)
Last 15m swing highs/lows
ATR(15m)
Color-coded for clarity
💡 Why Use This Indicator
High-speed 15m trend detection
Higher-TF 2H momentum & volume confirmation
Multi-layered bias presented in a simple score
Built-in structure for more intelligent entries/exits
Works on indices, stocks, FX, crypto
Ideal for intraday traders who want speed + reliability

Super momentum DBSISuper momentum DBSI: The Ultimate Guide
1. What is this Indicator?
The Super momentum DBSI is a "Consensus Engine." Instead of relying on a single line (like an RSI) to tell you where the market is going, this tool calculates 33 distinct technical indicators simultaneously for every single candle.
It treats the market like a democracy. It asks 33 mathematical "voters" (Momentum, Trend, Volume, Volatility) if they are Bullish or Bearish.
If 30 out of 33 say "Buy," the score is high (Yellow), and the trend is extremely strong.
If only 15 say "Buy," the score is low (Teal), and the trend is weak or choppy.
2. Visual Guide: How to Read the Numbers
The Scores
Top Number (Bears): Represents Selling Pressure.
Bottom Number (Bulls): Represents Buying Pressure.
The Colors (The Traffic Lights)
The colors are your primary signal. They tell you who is currently winning the war.
🟡 YELLOW (Dominance):
This indicates the Winning Side.
If the Bottom Number is Yellow, Bulls are in control.
If the Top Number is Yellow, Bears are in control.
🔴 RED (Weakness):
This appears on the Top. It means Bears are present but losing.
🔵 TEAL (Weakness):
This appears on the Bottom. It means Bulls are present but losing.
3. Trading Strategy
Scenario A: The "Strong Buy" (Long Entry)
The Setup: You are looking for a shift in momentum where Buyers overwhelm Sellers.
Watch the Bottom Number: Wait for it to turn Yellow.
Confirm Strength: Ensure the score is above 15 and rising (e.g., 12 → 18 → 22).
Check the Top: The Top Number should be Red and low (below 10).
Trigger: Enter on the candle close.
Scenario B: The "Strong Sell" (Short Entry)
The Setup: You are looking for Sellers to crush the Buyers.
Watch the Top Number: Wait for it to turn Yellow.
Confirm Strength: Ensure the score is above 15 and rising.
Check the Bottom: The Bottom Number should be Teal and low.
Trigger: Enter on the candle close.
Scenario C: The "No Trade Zone" (Choppy Market)
The Setup: The market is confused.
Visual: Top is Red, Bottom is Teal.
Meaning: NOBODY IS WINNING. There is no Yellow number.
Action: Do not trade. This usually happens during lunch hours, weekends, or right before big news. This filter alone will save you from many false breakouts.
4. What is Inside? (The 33 Indicators)
To give you confidence in the signals, here is exactly what the script is checking:
Group 1: Momentum (Oscillators)
Detects if price is moving fast.
RSI (Relative Strength Index)
CCI (Commodity Channel Index)
Stochastic
Williams %R
Momentum
Rate of Change (ROC)
Ultimate Oscillator
Awesome Oscillator
True Strength Index (TSI)
Stoch RSI
TRIX
Chande Momentum Oscillator
Group 2: Trend Direction
Detects the general path of the market.
13. MACD
14. Parabolic SAR
15. SuperTrend
16. ALMA (Moving Average)
17. Aroon
18. ADX (Directional Movement)
19. Coppock Curve
20. Ichimoku Conversion Line
21. Hull Moving Average
Group 3: Price Action
Detects where price is relative to averages.
22. Price vs EMA 20
23. Price vs EMA 50
24. Price vs EMA 200
Group 4: Volume & Force
Detects if there is money behind the move.
25. Money Flow Index (MFI)
26. On Balance Volume (OBV)
27. Chaikin Money Flow (CMF)
28. VWAP (Intraday)
29. Elder Force Index
30. Ease of Movement
Group 5: Volatility
Detects if price is pushing the outer limits.
31. Bollinger Bands
32. Keltner Channels
33. Donchian Channels
5. Pro Tips for Success
Don't Catch Knives: If the Bear score (Top) is Yellow and 25+, do not try to buy the dip. Wait for the Yellow score to break.
Exit Early: If you are Long and the Yellow Bull score drops from 28 to 15 in one candle, TAKE PROFIT. The momentum has died.
Use Higher Timeframes: This indicator works best on 15m, 1H, and 4H charts. On the 1m chart, it may be too volatile.

Advanced Market Profile & S/R Zones (Pro)Advanced Market Profile & S/R Zones
This indicator brings professional Auction Market Theory to your chart using a custom rolling Volume Profile algorithm. Unlike standard profiles that remain fixed, this tool dynamically calculates the "Fair Value" of the asset based on your specific lookback period (e.g., the last 100 bars).
It automatically highlights the Point of Control (POC), Value Area (VA), and suggests statistical Discount (Buy) and Premium (Sell) zones.
Key Features
Volume Splitting Algorithm:
Most basic scripts dump the entire volume of a candle into a single price point (the average). This script splits the volume across the candle's entire High-Low range. This results in a much smoother, higher-resolution bell curve that accurately reflects price action, especially on higher timeframes like Monthly charts.
Auto-generated Zones:
Green Zone (Discount): Prices below the Value Area Low (VAL). Statistically "cheap."
Red Zone (Premium): Prices above the Value Area High (VAH). Statistically "expensive."
Real-Time Dashboard:
A built-in panel displays the exact price levels for the POC, VAH, and VAL for precise limit order placement, along with the current Market Trend.
How to Use
For Intraday (Day Trading):
Settings: Set Lookback to 100 - 300.
Strategy: Watch for price to open outside the Value Area. If price breaks back inside the Value Area, target the POC (Red Line).
For Macro (Monthly/Weekly Charts):
Settings: Set Lookback to 12 (1 Year) or 60 (5 Years).
Strategy: Identify multi-year structural support. When a monthly candle enters the Green Discount Zone of a 5-year profile, it is often a high-probability institutional entry point.
Trend Logic
The Dashboard indicates trend based on price location relative to value:
Strong Bullish: Price is accepted ABOVE the Value Area.
Strong Bearish: Price is accepted BELOW the Value Area.
Neutral / In VA: Price is chopping inside the Value Area.
Disclaimer
This is a "Rolling Profile." It calculates the profile based on the current lookback window relative to the latest bar. As new bars form, the lookback window shifts, and the profile updates to reflect the new dataset.

Labden Swing 1.0Labden Swing Indicator, non real-time. good with semafor, ema 12 & 26 stochastic rsi and macd

ICT Macro Slot Algo Event📊 Overview
A powerful multi-timeframe trading indicator that combines Institutional Macro Session Tracking identify optimal trading windows throughout the day. This tool helps traders align with institutional flow patterns and algorithmic activity across major sessions.
🎯 Key Features
1. Macro Algo Event Sessions
Tracks 6 key institutional time windows during NY Session:
NY Sweep (08:50-09:10) - Opening balance flows
Silver Bullet #1 (09:50-10:10) - First major macro move
Silver Bullet #2 (10:50-11:10) - Second chance/retest opportunity
Lunch Macro (11:50-12:10) - Mid-day repositioning
Post-Lunch Rebalance (13:10-13:40) - Post-lunch adjustments
NY Closing Macros (15:15-15:45) - End-of-day flows

ICT Macro Slot Algo Event📊 Overview
A powerful multi-timeframe trading indicator that combines Institutional Macro Session Tracking to identify optimal trading windows throughout the day. This tool helps traders align with institutional flow patterns and algorithmic activity across major sessions.
🎯 Key Features
1. Macro Algo Event Sessions
Tracks 6 key institutional time windows during NY Session:
NY Sweep (08:50-09:10) - Opening balance flows
Silver Bullet #1 (09:50-10:10) - First major macro move
Silver Bullet #2 (10:50-11:10) - Second chance/retest opportunity
Lunch Macro (11:50-12:10) - Mid-day repositioning
Post-Lunch Rebalance (13:10-13:40) - Post-lunch adjustments
NY Closing Macros (15:15-15:45) - End-of-day flows

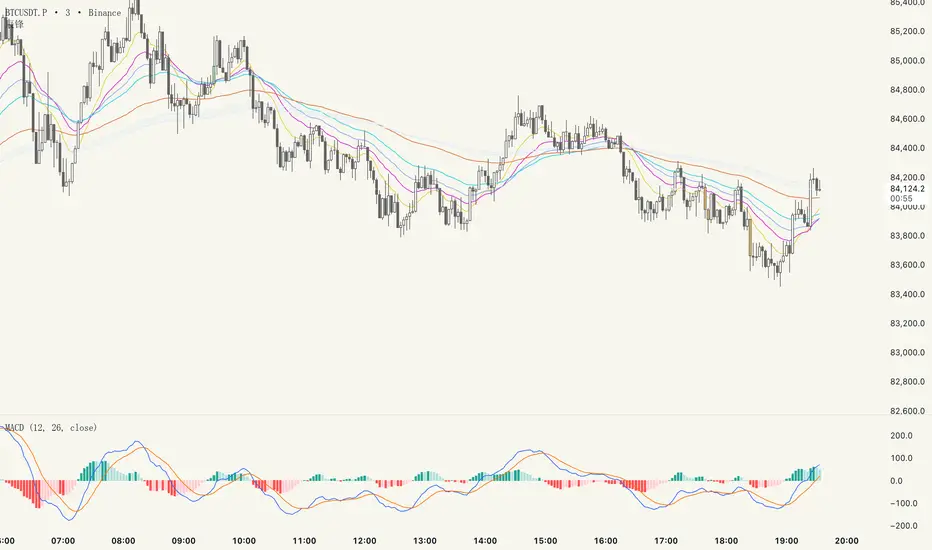
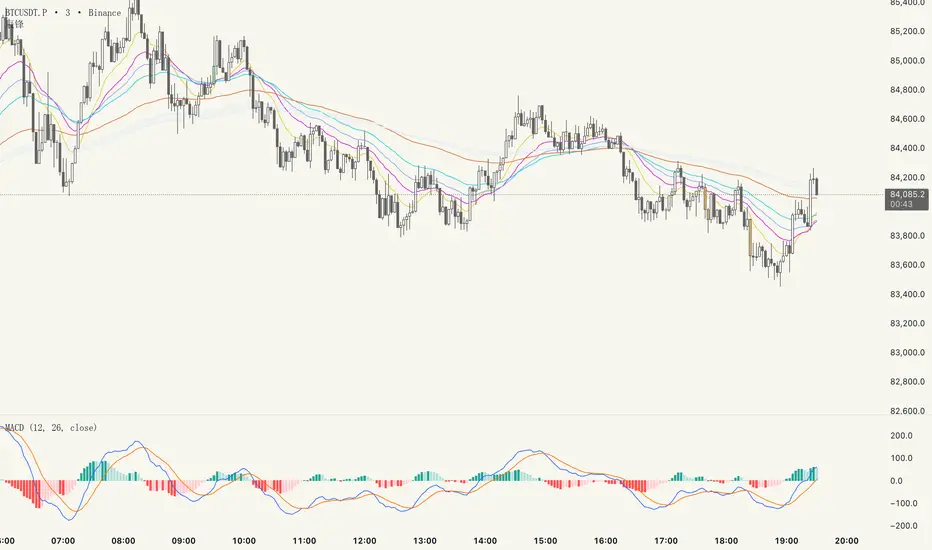
辰锋// This Pine Script® code is subject to the terms of the Mozilla Public License 2.0 at mozilla.org
// © chenfwng88888
//@version=6
indicator("辰锋", shorttitle="辰锋", overlay=true)
// 关键EMA均线组
plot(ta.ema(close, 12), title="13", color=color.rgb(230, 202, 58), linewidth=1) // 黄色
plot(ta.ema(close, 24), title="24", color=color.rgb(208, 35, 208), linewidth=1) // 粉色
plot(ta.ema(close, 36), title="38", color=color.rgb(129, 169, 238), linewidth=1) // 墨绿
plot(ta.ema(close, 52), title="52", color=color.rgb(39, 208, 226), linewidth=1) // 蓝绿色
plot(ta.ema(close, 104), title="104", color=color.rgb(222, 109, 57), linewidth=1) // 棕色
// Vegas Channel (added EMAs)
ema144 = ta.ema(close, 144)
ema169 = ta.ema(close, 169)
plot(ema144, title="EMA 144", color=color.new(#e3ebf7, 0), linewidth=1)
plot(ema169, title="EMA 169", color=color.new(#e7e7f5, 0), linewidth=1)
// Fill between EMA 144 and EMA 169 with light blue background
fill(plot1 = plot(ema144, display=display.none),
plot2 = plot(ema169, display=display.none),
color = color.new(#deeff4, 70), title = "144-169 Area")
// Colored candles based on volume and price movement
isUp = close > open
isDown = close < open
highVolume = volume > ta.sma(volume, 50) * 3 // 50-period average + 50% threshold
// Define colors
bullishColor = color.new(#a5f1a5, 0) // Light green
bearishColor = color.new(#f2b661, 0) // Orange
// Plot candles
barcolor(isUp and highVolume ? bullishColor : isDown and highVolume ? bearishColor : na)
Day Trading Signals - Ultimate Pro (Dark Neon + Strong BB Cloud)//@version=5
indicator("Day Trading Signals - Ultimate Pro (Dark Neon + Strong BB Cloud)", overlay=true, max_lines_count=500, max_labels_count=500)
// ===== INPUTS =====
ema_fast_len = input.int(9, "Fast EMA Length")
ema_slow_len = input.int(21, "Slow EMA Length")
rsi_len = input.int(12, "RSI Length")
rsi_overbought = input.int(70, "RSI Overbought Level")
rsi_oversold = input.int(30, "RSI Oversold Level")
bb_len = input.int(20, "Bollinger Bands Length")
bb_mult = input.float(2.0, "Bollinger Bands Multiplier")
sr_len = input.int(15, "Pivot Lookback for Support/Resistance")
min_ema_gap = input.float(0.0, "Minimum EMA Gap to Define Trend", step=0.1)
sr_lifespan = input.int(200, "Bars to Keep S/R Lines")
// Display options
show_bb = input.bool(true, "Show Bollinger Bands?")
show_ema = input.bool(true, "Show EMA Lines?")
show_sr = input.bool(true, "Show Support/Resistance Lines?")
show_bg = input.bool(true, "Show Background Trend Color?")
// ===== COLORS (Dark Neon Theme) =====
neon_teal = color.rgb(0, 255, 200)
neon_purple = color.rgb(180, 95, 255)
neon_orange = color.rgb(255, 160, 60)
neon_yellow = color.rgb(255, 235, 90)
neon_red = color.rgb(255, 70, 110)
neon_gray = color.rgb(140, 140, 160)
sr_support_col = color.rgb(0, 190, 140)
sr_resist_col = color.rgb(255, 90, 120)
// ===== INDICATORS =====
ema_fast = ta.ema(close, ema_fast_len)
ema_slow = ta.ema(close, ema_slow_len)
ema_gap = math.abs(ema_fast - ema_slow)
trend_up = (ema_fast > ema_slow) and (ema_gap > min_ema_gap)
trend_down = (ema_fast < ema_slow) and (ema_gap > min_ema_gap)
trend_flat = ema_gap <= min_ema_gap
rsi = ta.rsi(close, rsi_len)
bb_mid = ta.sma(close, bb_len)
bb_upper = bb_mid + bb_mult * ta.stdev(close, bb_len)
bb_lower = bb_mid - bb_mult * ta.stdev(close, bb_len)
// ===== SUPPORT / RESISTANCE =====
pivot_high = ta.pivothigh(high, sr_len, sr_len)
pivot_low = ta.pivotlow(low, sr_len, sr_len)
var line sup_lines = array.new_line()
var line res_lines = array.new_line()
if show_sr and not na(pivot_low)
l = line.new(bar_index - sr_len, pivot_low, bar_index, pivot_low, color=sr_support_col, width=2, extend=extend.right)
array.push(sup_lines, l)
if show_sr and not na(pivot_high)
l = line.new(bar_index - sr_len, pivot_high, bar_index, pivot_high, color=sr_resist_col, width=2, extend=extend.right)
array.push(res_lines, l)
// Delete old S/R lines
if array.size(sup_lines) > 0
for i = 0 to array.size(sup_lines) - 1
l = array.get(sup_lines, i)
if bar_index - line.get_x2(l) > sr_lifespan
line.delete(l)
array.remove(sup_lines, i)
break
if array.size(res_lines) > 0
for i = 0 to array.size(res_lines) - 1
l = array.get(res_lines, i)
if bar_index - line.get_x2(l) > sr_lifespan
line.delete(l)
array.remove(res_lines, i)
break
// ===== BUY / SELL CONDITIONS =====
buy_cond = trend_up and not trend_flat and ta.crossover(ema_fast, ema_slow) and rsi < rsi_oversold and close < bb_lower
sell_cond = trend_down and not trend_flat and ta.crossunder(ema_fast, ema_slow) and rsi > rsi_overbought and close > bb_upper
// ===== SIGNAL PLOTS =====
plotshape(buy_cond, title="Buy Signal", location=location.belowbar, color=neon_teal, style=shape.labelup, text="BUY", size=size.small)
plotshape(sell_cond, title="Sell Signal", location=location.abovebar, color=neon_red, style=shape.labeldown, text="SELL", size=size.small)
// ===== EMA LINES =====
plot(show_ema ? ema_fast : na, color=neon_orange, title="EMA Fast", linewidth=2)
plot(show_ema ? ema_slow : na, color=neon_purple, title="EMA Slow", linewidth=2)
// ===== STRONG BOLLINGER BAND CLOUD =====
plot_bb_upper = plot(show_bb ? bb_upper : na, color=color.new(neon_yellow, 20), title="BB Upper")
plot_bb_lower = plot(show_bb ? bb_lower : na, color=color.new(neon_gray, 20), title="BB Lower")
plot(bb_mid, color=color.new(neon_gray, 50), title="BB Mid")
// More visible BB cloud (stronger contrast)
bb_cloud_color = trend_up ? color.new(neon_teal, 40) : trend_down ? color.new(neon_red, 40) : color.new(neon_gray, 70)
fill(plot_bb_upper, plot_bb_lower, color=show_bb ? bb_cloud_color : na, title="BB Cloud")
// ===== BACKGROUND COLOR (TREND ZONES) =====
bgcolor(show_bg ? (trend_up ? color.new(neon_teal, 92) : trend_down ? color.new(neon_red, 92) : color.new(neon_gray, 94)) : na)
// ===== ALERTS =====
alertcondition(buy_cond, title="Buy Signal", message="Buy signal triggered. Check chart.")
alertcondition(sell_cond, title="Sell Signal", message="Sell signal triggered. Check chart.")

Previous Day Candle [ApexFX]Previous Day Candle is a precision tool designed for intraday traders who rely on previous daily structures to find support and resistance.
While most indicators simply mark the previous high and low, this tool focuses on Session Continuity. It highlights the full 24-hour range of the previous day and extends those levels into the "Killzone" of the current trading day (up to 2:00 PM EST / 12:00 PM MST).
Why use this? Market reaction often occurs at the previous day's extremes. By extending these lines into the current session, you can easily spot:
Breakouts: Price pushing through yesterday's high.
Failed Auctions: Price sweeping yesterday's low and reversing.
Support/Resistance Flips: Old highs becoming new support.
Main Features:
Asset Class Presets: Don't worry about timezones. Simply select your market:
Forex: Aligns to the standard 5:00 PM EST New York Open.
Indices: Aligns to the 6:00 PM EST Globex Open.
Crypto: Aligns to UTC Midnight.
Custom: Full manual control for specific needs.
Visual "Boxing": Vertical dotted lines clearly demarcate the start and end of the previous trading day.
Dynamic History: Choose to show just yesterday's levels or look back at the last 5+ days.
Smart Color Coding: The indicator automatically cycles colors for each day (Blue = Yesterday, Green = 2 Days Ago, etc.), making it instant to read historical price action.
Best Used On: Intraday timeframes (5m, 15m, 1h).

Advanced Time Dividers & Killzones IndicatorOverview
A comprehensive Pine Script v6 indicator that displays customizable time period dividers and trading session killzones on your chart. Perfect for intraday traders who need clear visual separation of time periods and want to identify key trading sessions.
✨ Features
Time Period Dividers
Weekly Lines: Vertical lines marking the start of each week
Monthly Lines: Vertical lines marking the start of each month
Quarterly Lines: Vertical lines marking the start of each quarter (Q1, Q2, Q3, Q4)
Yearly Lines: Vertical lines marking the start of each year
Trading Session Killzones
London Session: 2:00-5:00 GMT (Blue shaded box)
New York Session: 7:00-10:00 GMT (Green shaded box)
London Close: 10:00-12:00 GMT (Orange shaded box)
Asia Session: 20:00-00:00 GMT (Pink shaded box)
🎨 Customization Options
Display Controls
Toggle each time divider type individually
Toggle each killzone individually
Adjust historical and future display range
Show/hide labels on dividers and killzones
Style Customization
Line Styles: Choose between Solid, Dashed, or Dotted lines
Line Width: Adjustable from 1 to 5 pixels
Colors: Fully customizable colors for each element with transparency control
Label Size: Choose from Tiny, Small, Normal, or Large
Period Settings
Control how many bars to display in the past (0-5000)
Control how many bars to display in the future (0-1000)
📋 Usage Instructions
Add to Chart: Add the indicator to any chart
Select Timeframe: Works best on intraday timeframes (1H, 15min, 5min) for killzones
Customize: Open settings to enable/disable features and customize colors
Trading: Use the dividers to identify time periods and killzones to spot high-liquidity sessions
💡 Trading Applications
Time Dividers
Weekly/Monthly Analysis: Identify major time period transitions
Market Structure: Analyze how price behaves at period boundaries
Event Correlation: Align with economic calendar events
Killzones
High Liquidity Periods: Trade during peak market activity
ICT Strategy: Follows Inner Circle Trader killzone concepts
Session-Based Trading: Focus on specific trading sessions
Volatility Windows: Identify when major moves typically occur
⚙️ Technical Details
Version: Pine Script v6
Type: Overlay indicator
Max Lines: 500 (optimized performance)
Max Boxes: 500 (for killzone visualization)
Timezone: GMT/UTC for killzones
Memory Efficient: Automatic cleanup of old objects
🎯 Best Practices
Combine with Price Action: Use dividers to frame your analysis
Focus on Killzones: Most significant price moves occur during these sessions
Adjust Transparency: Find the right balance between visibility and chart clarity
Use Labels Wisely: Toggle labels on/off based on your needs
Timeframe Selection: Use lower timeframes (≤1H) to see killzones clearly
📝 Notes
Killzone times are in GMT/UTC timezone
Works on all instruments (Forex, Crypto, Stocks, Futures)
Optimized for performance with automatic memory management
Fully compatible with other indicators
🔄 Updates & Support
This indicator is actively maintained. Feel free to suggest improvements or report issues in the comments.

Forward Returns – (Next Month Start)This indicator calculates 1-month, 3-month, 6-month, and 12-month forward returns starting from the first trading day of the month following a defined price event.
A price event occurs when the selected asset drops below a user-defined threshold over a chosen timeframe (Day, Week, or Month).
For monthly conditions, the script evaluates the entire performance of the previous calendar month and triggers the event only at the first trading session of the next month, ensuring accurate forward-return alignment with historical monthly cycles.
The forward returns for each detected event are displayed in a paginated performance table, allowing users to navigate through large datasets using a page selector. Each page includes:
Entry Date
Forward returns (1M, 3M, 6M, 12M)
Average forward return
Win rate (percentage of positive outcomes)
This tool is useful for studying historical performance after major drawdowns, identifying seasonal patterns, and building evidence-based risk-management or timing models.

Fat Tony's Composite Momentum Histogram (v01)# Fat Tony's Composite Momentum Histogram
## What It Does
This indicator combines four momentum oscillators into a single composite signal that ranges approximately from -100 to +100. It identifies potential overbought and oversold conditions while weighting signals by volume activity to filter out weak moves.
The histogram shows momentum strength with color-coded bars:
- **Red bars** indicate extreme overbought conditions (above +100)
- **Green bars** indicate extreme oversold conditions (below -100)
- **Blue bars** show positive momentum in normal range
- **Orange bars** show negative momentum in normal range
## Core Components
The indicator blends these four momentum measures:
1. **Williams %R** - Measures where price closed relative to the high-low range
2. **Stochastic %K** - Compares closing price to the recent price range
3. **MACD Histogram** - Shows momentum changes via moving average convergence/divergence
4. **ROC (Rate of Change)** - Measures percentage price change, normalized by volatility
Each component is scaled to a -50 to +50 range, then averaged together. The MACD component uses adaptive scaling based on its historical volatility to remain relevant across different market conditions.
## Volume Weighting
The indicator amplifies signals when volume is elevated and dampens them when volume is low. It uses a logarithmic scaling approach to smooth extreme volume spikes. There's also a minimum volume filter that prevents signals from triggering during very low-volume periods.
## Settings Explained
**Momentum Settings:**
- **Length (14)** - Lookback period for Williams %R and Stochastic calculations
- **MACD Fast/Slow/Signal (12/26/9)** - Standard MACD parameters
- **ROC Length (10)** - Lookback for rate of change calculation
- **MACD StDev Length (200)** - Historical window for normalizing MACD values
**Levels:**
- **Overbought Level (+100)** - Threshold for extreme upside momentum
- **Oversold Level (-100)** - Threshold for extreme downside momentum
**Volume Settings:**
- **Enable Volume Weighting** - Toggle volume amplification on/off
- **Volume Sensitivity (1.5)** - Controls how much volume impacts the signal (higher = stronger impact)
- **Min Avg Volume (50,000)** - Filters out signals when 5-bar average volume is too low
**Components:**
- **Include ROC Component** - Toggle to add/remove ROC from the calculation
- **Enable Trend Filter** - Only allows signals aligned with the 200-period EMA trend
- **Show Component Plots** - Displays individual oscillator values for tuning purposes
## Trading Signals
**Entry Signals:**
- **Long (green triangle)** - Composite crosses above the oversold level with adequate volume
- **Short (red triangle)** - Composite crosses below the overbought level with adequate volume
**Exit Signals (when trend filter enabled):**
- **Long Exit** - Composite crosses below zero from positive territory
- **Short Exit** - Composite crosses above zero from negative territory
The indicator also provides alert conditions for automated notifications on these signal events.
