Ema Crosses nklassEs un simple indicador de cruces con EMAs, de 11, 22, 50 y 200 periodos.
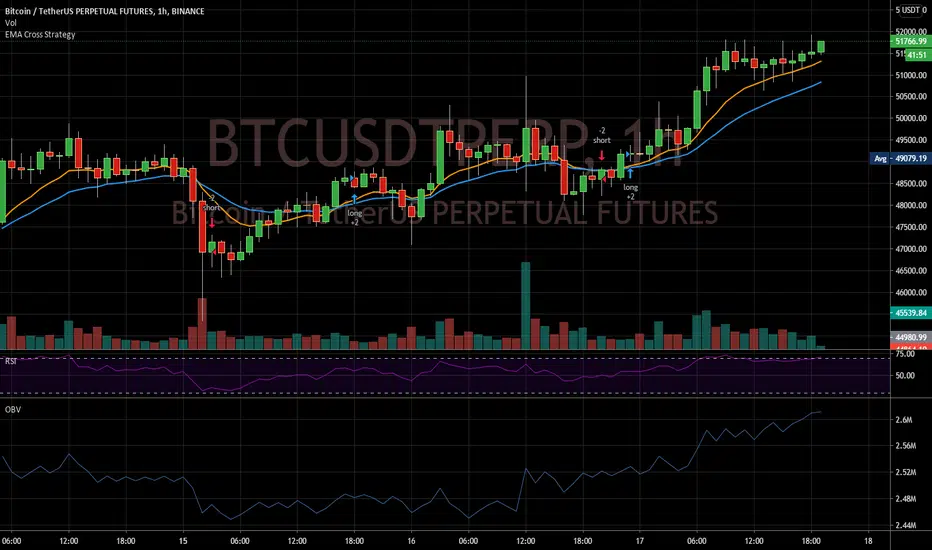
En un intervalo de velas diarias se obtienen las mejores señales, pero funciona bien para 4h y 15min tambien, recomiendo operar con los cruces de mayor probabilidad por encima y por debajo de la ema200, por debajo solo entradas en CORTO, y por encima solo entradas en Largo, luego de una señal se puede obtener un mejor Riesgo Beneficio si se espera a un posible test del ema 50, y se entra luego de un cierre de vela por por fuera de la ema 11, dandote un buen punto para el stop loss. Recomiendo utilizarlo basandose en zonas de soporte y resistencia de marcos temporales mas altos y teniendo en cuenta posibles divergencias en RSI al igual que su posicion en el momento de entrar al mercado.
在腳本中搜尋"3 ema"

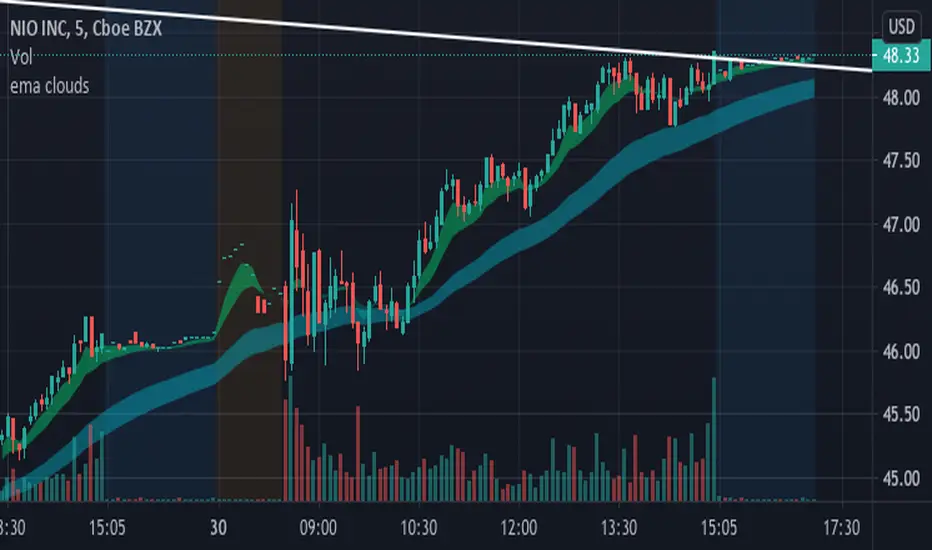
EMA clouds (5/12 and 34/50)This is a custom ema cloud script with a 5/12 cloud and a 34/50 cloud.
Personally, I used to trade with the 20 ema and 50 ema, but wanted something with a little more robust. These clouds are especially great for the first hour of market open since strong bullish stocks that have gapped up overnight tend to follow these trends.
For example, Tesla opened above the clouds and used them as support before running all day.
NIO happened to do a similar move.
EMA Bot Trigger - 14,26,55Work In Progress - Currently will send Long/Short triggers when EMA 14 Crosses EMA 26 - whether the cross is above the EMA 55 determines whether to Long or Short.
EMA Cross Fast/Slow/SignalInspired by EMA CrossOver Bars, this includes a third EMA that we are looking to cross. It also plots the EMA's on the chart.
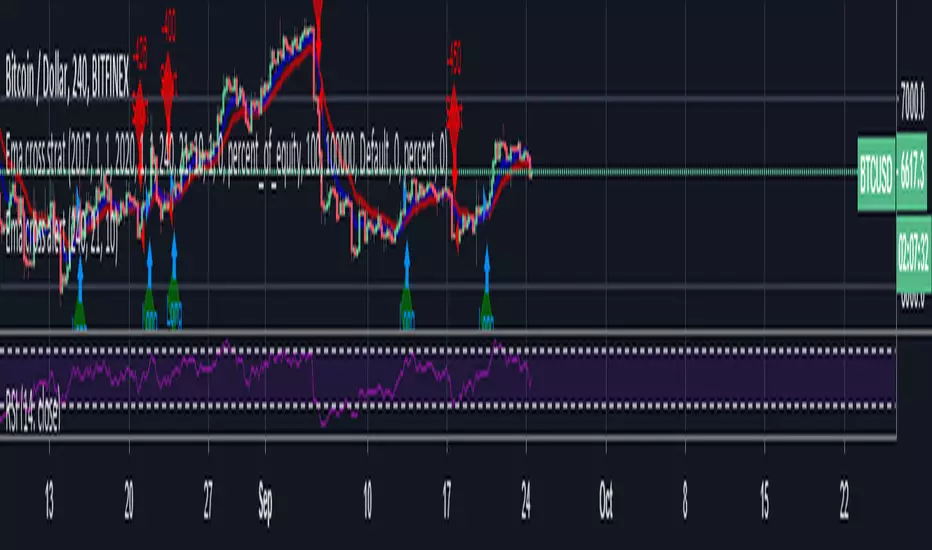
Ema cross strat / Turtle Trading This is just a simple EMA cross strategy which is meant to be similar to Turtle Trading Strategy.
It uses in default 4 Hour 21 / 10 EMA to long or short. This is not perfect but in the long run it will profit. Works best in bull market.
LINK TO ALERT :
EMA 50, 100 and 200Draw a set of 3 EMA: 50, 100 and 200. It highlight with a circle the crossing of EMA(50) with other EMAs

EMAs Crypto InvestidorExponential Moving Averages - EMAs Crypto Investor
Indicator developed to facilitate the use of 5 EMAs in a single indicator.
EMAs: 17, 34, 72, 100 and 200 Periods
Developed by Diego do Youtube Channel Crypto Investor

EMA StrategyThis strategy is in testing and development.
**USE AT YOUR OWN RISK. **
This defaults to a 13/48 EMA using the closing price. When the fast EMA crosses above the slow it triggers a buy. When it crosses below the slow EMA it triggers a sell and potentially a short, but that is not implemented. Stops, trailing stops, and pyramiding to be added. The purpose of this strategy is to signal recommended entry and exit point and back test whether the strategy works. It is not intended to be an automated buy/sell script.
* stop loss added. Not yet configurable from the settings panel. Defaults to 8% from the entry price.
TODO:
Add the ability to configure the stop-loss level in the settings panel
Add trailing stop functionality
Add profit taking, likely configurable sell targets (2:1 risk to reward gain for example)
Add another signal or two to help improve odds of making a winning trade.

EMA+MACD+RSI+StochJust like SMA but EMA!
this EMA base indicator helps you to find the trend.
use pivot point standard for make better decesion on Long and Short
EMA 10,20 SMA 50, 200This indicator is very helpful for swing traders who plan their trades using EMAs and SMAs. It is used on the daily chart and displays the 10- and 20-EMA, as well as the 50- and 200-SMA.

EMA LavtiThis TradingView Pine Script indicator displays a smoothed Exponential Moving Average (EMA) line along with a single arrow to indicate the last confirmed crossing event. The indicator highlights either a "Buy" or "Sell" signal based on price action relative to the smoothed EMA.
How It Works:
The script tracks the index and direction (up or down) of the last crossover event.
When no new crossing event occurs, the script resets to avoid plotting multiple arrows.
The smoothed EMA line is plotted on the chart to give context for the crossover signals.
EMA Distance Scanner with Multi-TimeframesThis indicator was created for personal use because I wanted to see, within the five-minute time frame, what is happening with the 15-minute, 1 hour, and 4 hour EMA9 and EMA200.
When the number is green, we are above the EMA value, and when it is red, we are below it. This also helps to get a clearer picture of the short- and long-term trends. When the number is close, within 0.00-0.01%, it turns blue, indicating a potential support level. You can also change the EMA values to your preference in the settings.
Hopefully, this will be helpful for you as well.

EMA RSI Strategy
Simple strategy
=============
If the last two closes are in ascending order, the rsi is below 50 and ascending, and the current candle is above 200 ema, then LONG. If the last two closes are in descending order, the rsi is above 50 and descending, and the current candle is below 200 ema, then SHORT.
LONG Exit strategy:
ATR: Last 14 day
Lowest: The lowest value of the last 14 candles
Limit points = (Trade Price - Lowest + ATR) * 100000
trail_points : Limit/2
trail_offset = Limit/2
SHORT Exit strategy:
ATR: Last 14 day
Highest: The higher value of the last 14 candles
Limit points = (Trade Price - Highest + ATR) * 100000
trail_points : Limit/2
trail_offset = Limit/2
Backtest results for the AUDUSD pair gave positive results over the last three months.
I am testing this strategy using a python bot in a real environment this week and will update the results at the end of the week.
Disclaimer
This is not financial advice. You should seek independent advice to check how the strategy information relates to your unique circumstances.
We are not liable for any loss caused, whether due to negligence or otherwise arising from the use of, or reliance on, the information provided directly or indirectly by this strategy.

EMA GradientA method of visualising whether an EMA is moving at a faster rate than in previous bars. It uses a linear regression analysis to plot a line of best fit to an exponential moving average of the price (the purple dashed line on the chart).
The gradient of this line of best fit is then compared to the gradient of the line of best fit over a range of previous candles. If the absolute value of the EMA gradient is greater than 75% (configurable) of the set of previous gradients then the line is coloured green for positive gradients and red for negative gradients. A yellow line indicates that the gradient is lower than the threshold.

EMA/Session/ATR/LotSizeSeveral indicators combined
1. 6 Exponential Moving Averages - Identifying the trend direction or using EMAs as a dynamic support/resistance.
2. Session on Chart - Highlighting session for day trading. London, New York, Tokyo, and Sydney.
3. Average True Range - display the Average True Range on recent price to calculate the volatility.
4. Lot Size Calculator - to calculate lot size based on account balance, risk per trade, atr stop-loss, and art multiplier.
5. ATRX - ATRX is an indicator that gives the value of the (close price - EMA 27)/ATR (14)
It tells how strong the trend is compared to its volatility
According to AJ. BANK FTMO Trader Thailand, if the value of ATRX is between 2X-3X or -2X-3X, you should consider trading using climax zone on timeframe H1.
If the ATRX is more than 3X or less than -3X but does not exceed 4X or -4X, you should consider trading using timeframe M15 in the climax zone.
However, if the ATRX exceeds 4X or -4X, use M5 instead.

EMA 5/10/150/200This is a simple script with EMA 5/10/150/200. You can also change the source code and set the desired values of the EMA indicator.
EMA Bounce StrategySimple strategy that checks for price bounces over an Exponential Moving Average. If the CLOSE of the candle bounces
back from having it's LOW below the EMA then it's a Bull Bounce. If the CLOSE of the candle bounces down from having it's
high above the EMA then it's a Bear Bounce. This logic can be reversed.

EMA Ribbon - low clutter, configurable [aspiers]This script improves on many of the existing EMA ribbon scripts out there:
Reduces visual clutter with shorter labels / titles, and thinner, transparent lines which don't obscure the actual price chart
Two beautiful color gradients for up and down trends
All colors and EMA periods are fully configurable, using the new input grouping / inline features
Uses Pine Script v4, which makes it more future-proof and allows new functionality, e.g.
It allow configurable period resolution, e.g. so user can fix at day resolution even when chart is being viewed at hour or minute resolution (this is the default)
Code clean-up: remove redundant ternary conditionals, improve variable names
Allow smoothing threshold for changes in trend direction to be configurable

EMA Cross StrategyThis double EMA crossover strategy aims to illustrate a good strategy design.
It is currently the only published script that:
supports a proper date picker for the backtest period
is able to test in short and long mode only
EMA 20/100/200 alwaysThis script will always show the EMA 20/100/200 daily values across any time frame chart (e.g. showing daily 20 EMA while viewing the 5 minute chart)


EMAS X-FACTORindicador que nos simplifica la utilización de las EMAS 8,18 y 200 que utilizaremos para confirmar las entradas de las operaciones. Las EMAS o Medias Móviles Exponenciales nos muestra el valor medio del precio de un instrumento durante un determinado período de tiempo, es decir nos marcan la tendencia momentánea y la tendencia larga.