ICT Sessions (Kill Zones)Inspired by the work of ICT (Inner Circle Trader - @ICT_MHuddleston)
What are ICT KillZones:
All ICT students know that certain moments of the day are more indicated to search for good frameworks. These moments are indicated like "Kill Zones".
The best kill zones to search for profittable tradings are during the London session and during the New York session.
How This Indicator Can Help You:
With this indicator you'll see plotted in the charts the London Kill Zone and the New York Kill Zone, you'll see exactly when they start and finish, so you'll be able to understand better the price action and recognize if there are ICT framework to trade. You'll also will see when the New York lunch hour happen (this moment is not favorable for searching frameworks) and you'll see also 2 very important moments of the day, the 8.30 New York Time and the 9.30 New York Time, infact in these 2 particular moments it is most likely that some very profittable framework will appear as there are alway important economic news released in these 2 hours.
Also you'll see the New York Midnight Open, that always forms a very important level for the day trading, you could see the New York Midnight open as a real opening for markets.
Why This Indicator:
I looked for indicators working with these concepts and I could not find one that offered the kill zones sections in the way are showed in my indicator, also they just had the kill zones without showing the 8.30 and 9.30 hours and without the Ney York midnight opening, and these are very important time frames for who works with ICT concepts.
About The Indicator:
In this indicator you'll have displayed:
The regular trading sessions displayed, that is: Asian Session, London Session, New York Session.
The London Kill Zone
The New York Kill Zone
The New York Midnight Open
The New York Lunch Hour
The 8:30 News Release Hour
The 9:30 News Release Hour
All these level can be adjusted and changed as you prefer.
在腳本中搜尋"30分钟K线图+交易策略"

Chervolinos_Rob Hoffman_Inventory Retracement Bar_and_OverlayHere is something like a combo from the well known Rob Hoffman (Overlay) Indicator and the Inventory Retracement Bar without any ballast
This really smart strategy with a low risk and a quick profit. I combine this two Indicators to save space.
The first condition is that the orange line and the lime line must be parallel and there is no other line between them because this condition is moving under 45 angle.
The second condition is that the target candles must be below the orange line in the case of the downtrend as we see.
As we see it here in the case of an uptrend should be candles above the orange line and this is logical as we see here.
Sometimes we noticed the appearance of the signal onto the candle but the conditions were not applicable because there is an orange line between the green line and the orange line and this means that the signal is fake.
This candle is also good for entry and we can place a buy order above it but is it beginner, so you must respect the conditions in order to be able to master it very well.
Enter with Confidence all conditions are present a red arrow above the candle and the candle is above the orange line and there are no lines between the lime and
orange line. Yes this is our target the entry-point will be a little above the wicked the candle, that is you will not buy now but it's a price exceeds the weight limit
even slightly, we will buy directly it is hoffman's method. Expected if the price in which resistance occurred which is the resistance represented
by the candlewick will be broken the price for rise up and strongly and if it does not happen you will not lose anything anyway to stop loss and take profit. Try the ratio by 1,5.
This part of this strategy is one of the best trading strategies with a low risk rate and can be used as an initial guide to know the market movement and to enter successful trades.
Let's start correctly. This strategy can be used on any time frame from one minute to one day or even more, but I recommend using it on a 10-minute frame one hour or 30 minutes frame. Here I use the 30-Minute frame.
This strategy is based on two things: Tramp Direction and the inventory retracement bar. Don't worry and don't think about it because all this will be automatic but let's understand some simple terms.
There many arrows in green and red. Please read the discription above.
Please read the following tipps:
To avoid the trend Reversal, try to add one one of the Divergence indicators to your chart.
To avoid entering in a pullback movement as much as possible.
--> Combine it with other indicators <--
Best Regards Chervolino
if there were any typographical errors, please forgive me
Note: Buy/Sell signals using non-standard chart types (Heikin Ashi, Renko, Kagi, Point & Figure, and Range) are not allowed, as they produce unrealistic results

10yr, 20yr, 30yr Averages: Month/Month % Change; SeasonalityCalculates 10yr, 20yr and 30yr averages for month/month % change
~shows seasonal tendencies in assets (best in commodities). In above chart: August is a seasonally bullish month for Gold: All the averages agree. And January is the most seasonally bullish month.
~averages represent current month/previous month. i.e. Jan22 average % change represents whole of jan22 / whole of dec21
~designed for daily timeframe only: I found calling monthly data too buggy to work with, and I thought weekly basis may be less precise (though it would certainly reduce calculation time!)
~choose input year, and see the previous 10yrs of monthly % change readings, and previous 10yrs Average, 20yr Average, 30yr Average for the respective month. Labels table is always anchored to input year.
~user inputs: colors | label sizes | decimal places | source expression for averages | year | show/hide various sections
~multi-yr averges always print, i.e if only 10yrs history => 10yr Av = 20yr Av = 30yr Av. 'History Available' label helps here.
Based on my previously publised script: "Month/Month Percentage % Change, Historical; Seasonal Tendency"
Publishing this as seperate indicator because:
~significantly slower to load (around 13 seconds)
~non-premium users may not have the historical bars available to use 20yr or 30yr averages =>> prefer the lite/speedier version
~~tips~~
~after loading, touch the new right scale; then can drag the table as you like and seperate it from price chart
##Debugging/tweaking##
Comment-in the block at the end:
~test/verifify specific array elements elements.
~see the script calculation/load time
~~other ideas ~~
~could tweak the array.slice values in lines 313 - 355 to show the last 3 consecutive 10yr averages instead (i.e. change 0, 10 | 0,20 | 0, 30 to 0, 10 | 10, 20 | 20,30)
~add 40yr average by adding another block to each of the array functions, and tweaking the respective labels after line 313 (though this would likely add another 5 seconds to the load time)
~use alternative method for getting obtaining multi-year values from individual month elements. I used array.avg. You could try array.median, array.mode, array.variance, array.max, array.min (lines 313-355)

Intermediate Williams %R w/ Discontinued Signal Lines [Loxx]Intermediate Williams %R w/ Discontinued Signal Lines is a Williams %R indicator with advanced options:
-Williams %R smoothing, 30+ smoothing algos found here:
-Williams %R signal, 30+ smoothing algos found here:
-DSL lines with smoothing or fixed overbought/oversold boundaries, smoothing algos are EMA and FEMA
-33 Expanded Source Type inputs including Heiken-Ashi and Heiken-Ashi Better, found here:
What is Williams %R?
Williams %R, also known as the Williams Percent Range, is a type of momentum indicator that moves between 0 and -100 and measures overbought and oversold levels. The Williams %R may be used to find entry and exit points in the market. The indicator is very similar to the Stochastic oscillator and is used in the same way. It was developed by Larry Williams and it compares a stock’s closing price to the high-low range over a specific period, typically 14 days or periods.
Included:
-Toggle on/off bar coloring
-Toggle on/off signal line

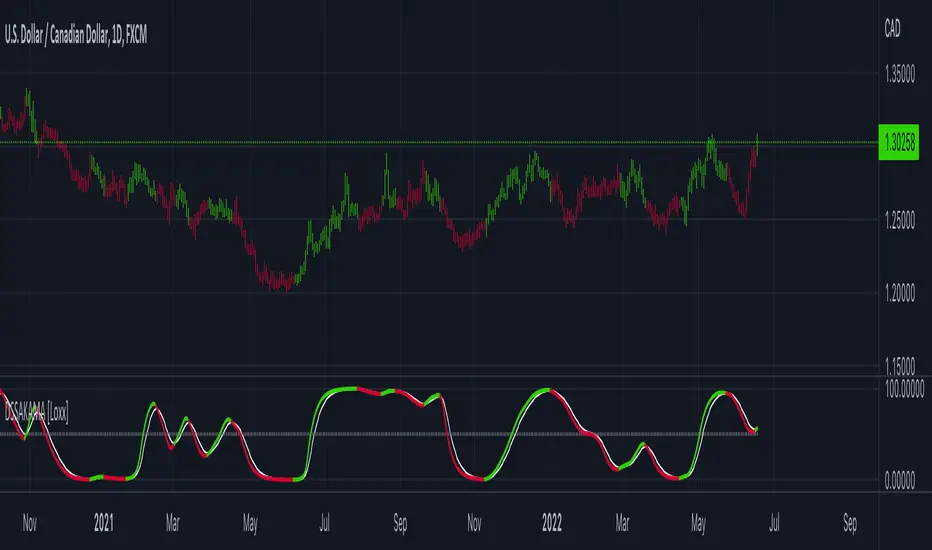
DSS of Advanced Kaufman AMA [Loxx]DSS of Advanced Kaufman AMA is a double smoothed stochastic oscillator using a Kaufman adaptive moving average with the option of using the Jurik Fractal Dimension Adaptive calculation. This helps smooth the stochastic oscillator thereby making it easier to identify reversals and trends.
What is the double smoothed stochastic?
The Double Smoothed Stochastic indicator was created by William Blau. It applies Exponential Moving Averages (EMAs) of two different periods to a standard Stochastic %K. The components that construct the Stochastic Oscillator are first smoothed with the two EMAs. Then, the smoothed components are plugged into the standard Stochastic formula to calculate the indicator.
What is KAMA?
Developed by Perry Kaufman, Kaufman's Adaptive Moving Average (KAMA) is a moving average designed to account for market noise or volatility . KAMA will closely follow prices when the price swings are relatively small and the noise is low. KAMA will adjust when the price swings widen and follow prices from a greater distance. This trend-following indicator can be used to identify the overall trend, time turning points and filter price movements.
What is the efficiency ratio?
In statistical terms, the Efficiency Ratio tells us the fractal efficiency of price changes. ER fluctuates between 1 and 0, but these extremes are the exception, not the norm. ER would be 1 if prices moved up 10 consecutive periods or down 10 consecutive periods. ER would be zero if price is unchanged over the 10 periods.
What is Jurik Fractal Dimension?
There is a weak and a strong way to measure the random quality of a time series.
The weak way is to use the random walk index ( RWI ). You can download it from the Omega web site. It makes the assumption that the market is moving randomly with an average distance D per move and proposes an amount the market should have changed over N bars of time. If the market has traveled less, then the action is considered random, otherwise it's considered trending.
The problem with this method is that taking the average distance is valid for a Normal (Gaussian) distribution of price activity. However, price action is rarely Normal, with large price jumps occuring much more frequently than a Normal distribution would expect. Consequently, big jumps throw the RWI way off, producing invalid results.
The strong way is to not make any assumption regarding the distribution of price changes and, instead, measure the fractal dimension of the time series. Fractal Dimension requires a lot of data to be accurate. If you are trading 30 minute bars, use a multi-chart where this indicator is running on 5 minute bars and you are trading on 30 minute bars.
Included
-Toggle bar colors on/offf
Bollinger CloudsThis indicator plots Bollinger Bands for your current timeframe (e.g 5 minutes) and also plots the Bollinger Bands for a higher timeframe (15 minutes for 5 minute timeframe). Then the gaps between the current and higher timeframe upper and lower bands is filled to create clouds which can be used as entry zones. Like Bollinger Bands, this indicator shouldn't be solely used for entries, use it in conjunction with other indicators.
Bollinger Band Timeframes
Current / Higher
1 minute / 5 minutes
3 minutes / 10 minutes
5 minutes / 15 minutes
10 minutes / 30 minutes
15 minutes / 1 hour
30 minutes / 2 hours
45 minutes / 1.5 hours
1 hour / 4 hours
2 hours / 8 hours
2.5 hours / 10 hours
4 hours / 1 Day
1 Day / 3 Days
3 Days / 9 Days
5 Days / 2 Weeks
1 Week / 1 Month

Parabolic SAR of KAMA [Loxx]Parabolic SAR of KAMA attempts to reduce noise and volatility from regular Parabolic SAR in order to derive more accurate trends. In addition, and to further reduce noise and enhance trend identification, PSAR of KAMA includes two calculations of efficiency ratio: 1) price change adjusted for the daily volatility; or, 2) Jurik Fractal Dimension Adaptive (explained below)
What is PSAR?
The parabolic SAR indicator, developed by J. Wells Wilder, is used by traders to determine trend direction and potential reversals in price. The indicator uses a trailing stop and reverse method called "SAR," or stop and reverse, to identify suitable exit and entry points. Traders also refer to the indicator as to the parabolic stop and reverse, parabolic SAR, or PSAR.
What is KAMA?
Developed by Perry Kaufman, Kaufman's Adaptive Moving Average (KAMA) is a moving average designed to account for market noise or volatility. KAMA will closely follow prices when the price swings are relatively small and the noise is low. KAMA will adjust when the price swings widen and follow prices from a greater distance. This trend-following indicator can be used to identify the overall trend, time turning points and filter price movements.
What is the efficiency ratio?
In statistical terms, the Efficiency Ratio tells us the fractal efficiency of price changes. ER fluctuates between 1 and 0, but these extremes are the exception, not the norm. ER would be 1 if prices moved up 10 consecutive periods or down 10 consecutive periods. ER would be zero if price is unchanged over the 10 periods.
What is Jurik Fractal Dimension?
There is a weak and a strong way to measure the random quality of a time series.
The weak way is to use the random walk index (RWI). You can download it from the Omega web site. It makes the assumption that the market is moving randomly with an average distance D per move and proposes an amount the market should have changed over N bars of time. If the market has traveled less, then the action is considered random, otherwise it's considered trending.
The problem with this method is that taking the average distance is valid for a Normal (Gaussian) distribution of price activity. However, price action is rarely Normal, with large price jumps occuring much more frequently than a Normal distribution would expect. Consequently, big jumps throw the RWI way off, producing invalid results.
The strong way is to not make any assumption regarding the distribution of price changes and, instead, measure the fractal dimension of the time series. Fractal Dimension requires a lot of data to be accurate. If you are trading 30 minute bars, use a multi-chart where this indicator is running on 5 minute bars and you are trading on 30 minute bars.
Conclusion from the combined efforts explained above:
-PSAR is a tool that identifies trends
-To reduce noise and identify trends during periods of low volatility, we calculate a PSAR on KAMA
-To enhance noise and reduction and trend identification, we attempt to derive an efficiency ratio that is less reliant on a Normal (Gaussian) distribution of price
Included:
-Customization of all variables
-Select from two different ER calculation styles
-Multiple timeframe enabled

sm trend analyzer█ OVERVIEW
This script is intended to provide full time frame continuity information for almost all time frames (3, 5, 15, 30, 60, 4H, Day, Week, Month, Quarter, Year)
When added, the script provides a visual indicator/table to the bottom right of the screen to view the different performance at each time frame.
----------
Output
Time Frames: 3min, 5min, 15min, 30min, 60min, 4 Hour, Day, Week, Month Quarter, Year
Time Frame Labels: 3, 5, 15, 30, H, 4H, D, W, M, Q, Y
Colors: Will display the colors in RED if it's a down time frame (close/current < prior close) or a GREEN if it's a up time frame (close/current > prior close), the color will be more opaque/the opacity will increase the stronger it's levels are for the time frame.
Percentage: The percentages will also display, to give you a quick visual indicator or how strong a time frame is one way or the other.
Best Practices
----------
Had to decouple this from the other scripts because TV limits how much you can plot/show
May be a little slow at times, analyzing a lot of time periods/data be patient.
Used to indicate who is in control, buyers or sellers.
Jul 28, 2021
Release Notes: Fix study name, add some padding (high percentages are hard to get one the whole table)
Jul 28, 2021
Release Notes: Add more space... fix logic. It's open and close not close and prior close for FTC.
Jul 28, 2021
Release Notes: Set the width to ensure the whole percentage is shown. Also stack the cells (2 rows of 6) so it's more compressed and easier to read. Added in the 2H indicator as well.
Aug 2, 2021
Release Notes: Changes: added the ability to disable/hide each box and the ability to change the time frame of each box. The boxes are sequentially numbered, 1 - 12, left to right, top to bottom. So the first box, or 1, would be the top left, 2 would be the next box, all the way to 12 at the bottom right.

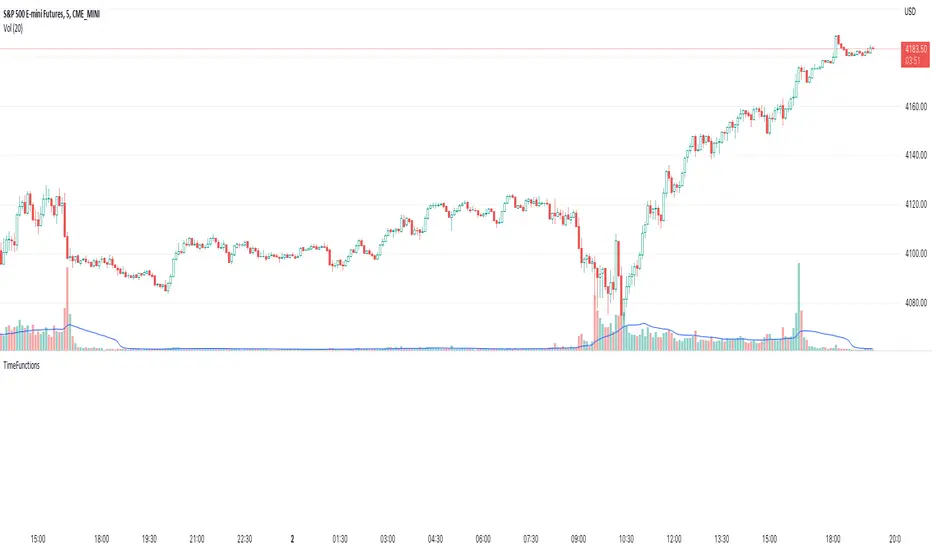
Time FunctionsLibrary "TimeFunctions"
Utility functions to handle time in Pine Script
TimeframetoInt()
Returns an int that corresponds to a timeframe string:
"1" => 1
"5" => 5
"10" => 10
"15" => 15
"30" => 30
"60" => 60
"H1" => 60
"H4" => 240
"1D" => 1440
BarsSinceOpen()
Returns the number of bars that have passed since the opening of the New York Session.
Futures Exchange Sessions 2.0Description
Successor to Futures Exchange Sessions indicator. Completely rebuilt code from the ground up. Every feature has been redesigned and refactored to be the most beneficial while allowing for complete configuration by the user.
This indicator displays Futures Sessions as live boxes that expand dynamically as price moves over the time interval. These boxes make liquidity levels extremely easy to spot and visualize. It helps the user identify market structure and develop their own bias of price action. Everything about the Session boxes can be configured. Box color, border color, border style, and border width are all individually controllable. Each Future Session can be turned on or off at any time. Also, each box has their own text label (Asian Session, London Session, New York Session) and this text can be moved around the box, change color, and change size.
Previous days highs and lows (major liquidity levels) are always important to the futures trader. This indicator now allows the user to individually display the three previous days highs and low levels as lines with optional label. Each line can be independently toggled on or off and like always, every conceivable customization option is available to the user. And the labels can be moved to the right (via the Input Settings) to allow unobstructed views of candles.
The midnight EST open and 8:30 AM EST open horizontal lines (developed by the Inner Circle Trader) are returning in this indicator. But the biggest improvement is that the lines stop at the current bar or the last bar of the trading day. Additionally, the time lines are displayed on previous days so the user can easily see how the candles reacted to these important times of the day.
The Session boxes and the horizontal time lines now can be set to only display a certain number of day back. If the user wants just to see Session boxes for the previous day only, they can do that. If the user wants to see the last 15 days of boxes or lines it is very easy to increase the days back in the settings. Currently, the max days back is 80 calendar days.
Additional Images
Easily visualize and understand price action across time
Everything is customizable so the user can easily match this indicator to their color preferences
Special Notes
To turn off box session text set opacity to 0%
Boxes and horizontal time lines only display when timeframe is <= 30 minute

ICT EverythingVersion 1.0
Global Settings
• Timezone Selection
• Hide Indicator Above Specified Time
Thematic Override
• Override Colors For Dark Theme ( Colors Set for White Theme by Default )
• Override Session Highlighting Color
Session Options
• Show Historical Sessions
• Enable/Disable Session Highlighting
• Session Specific Visibility
• Session's Crucial Time Vertical Lines w/ Options
NY Midnight Line Options
• Show Historical NY Midnight Vertical Lines
• Midnight Verticle Line Options
• Show Historical NY Midnight Price Lines
• Midnight Price Line Options
Opening Price Line Options
• New York 8:30 AM Price Line Settings
• Equities Open 9:30 AM Price Line Settings
• Option to Display Historical Price Lines
HTF Levels
• Weekly Open
• Monthly Open
label Settings
• Show/Hide Label Text
• Show/Hide Label
Day of Week
• Show Day of Week at the bottom of chart w/ Time Co-ordinates Selection
••• Message Me For Link to Frequently Updated Version of This Indicator •••

Boom Hunter + Hull Suite + Volatility Oscillator StrategyTRADE CONDITIONS
Long entry:
Boom Hunter (leading indicator): Trigger line crosses over Quotient 2 line (white cross over red)
Hull Suite (trend confirmation): Price closed above hull suite line and hull suite is green (represented by horizontal line at -10 in strategy pane)
Volatility Oscillator (volatility confirmation): Volatility spike trigger line is above upper band (represented by horizontal line at -30 in strategy pane)
Short entry:
Boom Hunter (leading indicator): Trigger line crosses under Quotient 2 line (white cross under red)
Hull Suite (trend confirmation): Price closed below hull suite line and hull suite is red (represented by horizontal line at -10 in strategy pane)
Volatility Oscillator (volatility confirmation): Volatility spike trigger line is below lower band (represented by horizontal line at -30 in strategy pane)
Risk management:
Each trade risks 3% of account (configurable in settings)
SL size determined by swing low/high of previous X candles (configurable in settings) or 1 ATR if swing is less than 1 ATR
TP is calculated by Risk:Reward ratio (configurable in settings)
TIPS
Timeframe: I have found good results running on BTC/USDT 5M chart
Note: To help visual identification of trade entries and exits you may wish to add the Hull Suite and Volatility Oscillator to the chart separately. It was not possible to display them in a clear way within a single panel for the strategy. Make sure you set the settings of the auxiliary indicators to match what is in the settings of this indicator if you do decide to add them.
CREDITS
Boom Hunter Pro by veryfid
Hull Suite by InSilico
Volatility Oscillator by veryfid

OBV Overbuy+sell Oscillator[RSU]On-balance volume (OBV) is a technical trading momentum indicator that uses volume flow to predict changes in stock price. Joseph Granville first developed the OBV metric in the 1963 book Granville's New Key to Stock Market Profits.
This indicator is based on the OBV indicator and adds 2 times the standard deviation Bollinger Band to evaluate the overbought and oversold phenomenon of the OBV indicator.
The characteristics of Bollinger Bands: According to the normal distribution phenomenon, only 5% of the cases will exceed 2 times the standard deviation of the Bollinger Bands . So when it exceeds, I use colors to mark red overbought and green oversold situations.
Usage:
1.Identify trends: Identify current stock trends by OBV's 30 average line color.
2.Breakthrough:OBV Breakthrough 30 average,signal trend may reversal.
3.Oversell and overbuy:A break below overbuy could signal a temporary end to the uptrend.
4.Divergence:When the slope of the two highs is opposite to the slope of the two highs of the indicator, a trend reversal signal may occur.

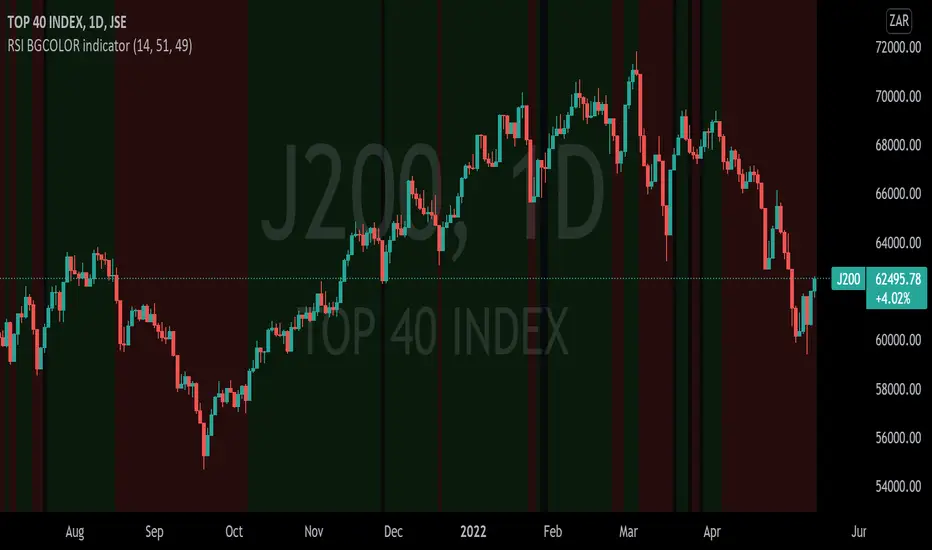
RSI BGCOLOR indicatorHi
This is a standard RSI indicator.
It changes the background color to green if the RSI reading is greater than the RSI bullish value and it changes to red if the RSI is below the RSI bearish value.
It will turn black for values between RSI bullish value and RSI bearish value.
You can tweak it to your liking, for example if you'd like to detect long only trades that are above 30 then you set RSI bearish value to 0 and RSI bullish value to 30 and it will only get long signals.
P.S More confirmation indicators will be necessary
Double Ichimoku Cloud with drop-down selectable lookback periodsThis script will display two Kumo Clouds. The overlap between the clouds can be areas of high support or resistance. I've included a drop-down selector for a variety of common lookback periods. Experiments show that the 10-30-60-30 settings can be more applicable to the FOREX and Crypto markets.
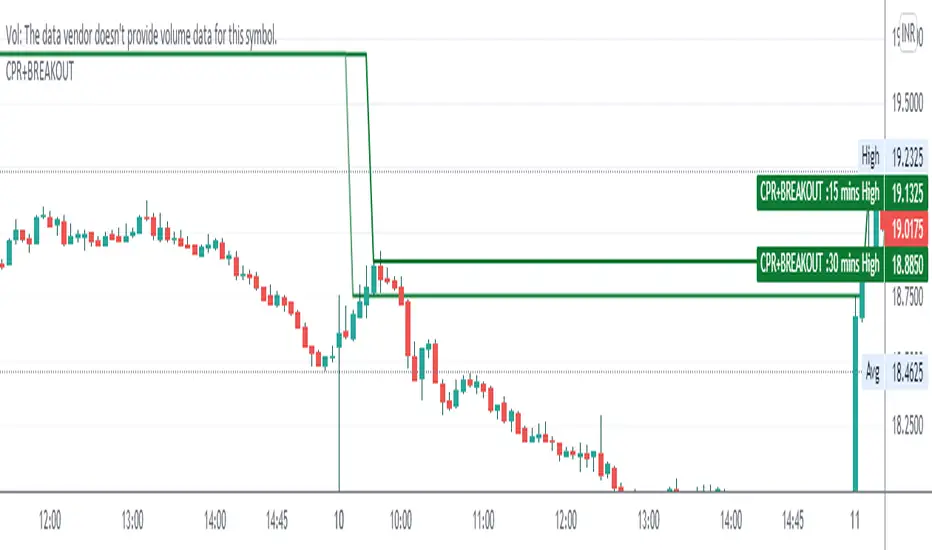
CPR WITH BREAKOUTCPR with 10-30 mins Breakout
This indicator includes CPR with 15-30 mins breakout, resistance, support, previous day low, previous day high, day low and day high etc,
please backtest before use
regards
The Malayali Trader