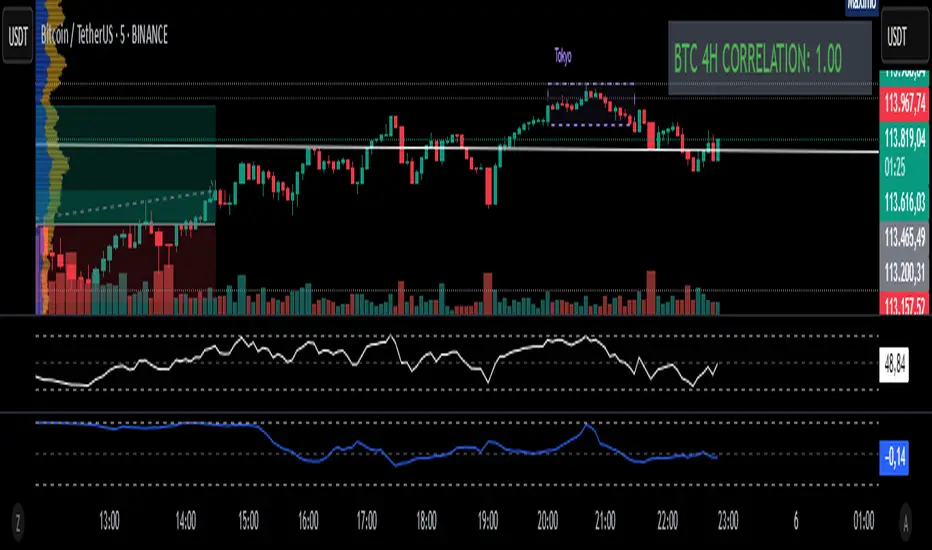
Fixed 4H BTC/Altcoins Correlation for Scalping
Fixed 4H Timeframe: The calculation is hardcoded to the 4-hour timeframe. This ensures the correlation value remains stable and relevant for structural analysis while you trade on lower timeframes.
Clean On-Screen Display: Instead of a separate plot line that can clutter the chart, the indicator displays the correlation value in a clean, simple table in the top-right corner.
Dynamic Coloring: The correlation value is color-coded for quick visual assessment:
Green: Strong correlation (> 0.70)
Yellow: Moderate correlation (0.30 to 0.70)
Red: Weak or negative correlation (< 0.30)
Customizable Inputs: Users can easily configure the BTC symbol (e.g., BINANCE:BTCUSDT, COINBASE:BTCUSD), the correlation lookback period (Length), and the price source (Source) to match their reference indicators or preferences.
Add the indicator to your chart (for example, a 5-minute chart of any altcoin).
The table in the top-right corner will immediately display the altcoin's current correlation to BTC, based on 4-hour data.
Use this value to gauge market sentiment. A high positive correlation suggests the altcoin is likely to follow BTC's moves. A low or negative correlation suggests the altcoin is moving independently.
For perfect synchronization with another standard correlation indicator, go to the script's settings (⚙️ icon) and ensure the Length and Source parameters are identical to your reference indicator.
This tool aims to bridge the gap between high-frequency trading and high-timeframe market structure, providing a crucial piece of information in a simple, stable, and accessible format.
在腳本中搜尋"BTC"
🧠 Rogue BTC Dominance + BTC Price MonitorLiquidity never lies.
When whales are done pumping, they exit before price tanks, often during sideways chop or fake strength.
So we build a tracker that detects:
Volume drop during uptrend (distribution phase)
Exchange inflows of coins
Rising USDT.D while price holds → stealth exit
Divergence between price & on-chain flows
👁️ Quick Use Case: BTC/USDT with USDT.D Overlay
If you see this pattern:
BTC sideways or slow uptrend
Volume declining
USDT.D rising
BTC.D holding flat
→ Liquidity Exit Detected.
Smart money is exiting quietly, waiting for retail to hold the bag.
Enhanced BTC Order Block IndicatorThe script you provided is an "Enhanced BTC Order Block Indicator" written in Pine Script v5 for TradingView. It is designed to identify and visually mark Order Blocks (OBs) on a Bitcoin (BTC) price chart, specifically tailored for a high-frequency scalping strategy on the 5-minute (M5) timeframe. Order Blocks are key price zones where institutional traders are likely to have placed significant buy or sell orders, making them high-probability areas for reversals or continuations. The script incorporates customizable filters, visual indicators, and alert functionality to assist traders in executing the strategy outlined earlier.
Key Features and Functionality
Purpose:
The indicator detects bullish Order Blocks (buy zones) and bearish Order Blocks (sell zones) based on a predefined percentage price movement (default 0.5–1%) and volume confirmation.
It marks these zones on the chart with colored boxes and provides alerts when an OB is detected.
User-Configurable Inputs:
Price Move Range: minMovePercent (default 0.5%) and maxMovePercent (default 1.0%) define the acceptable price movement range for identifying OBs.
Volume Threshold: volumeThreshold (default 1.5x average volume) ensures OB detection is backed by significant trading activity.
Lookback Period: lookback (default 10 candles) determines how many previous candles are analyzed to find the last candle before a strong move.
Wick/Body Option: useWick (default false) allows users to choose whether the OB zone is based on the candle’s wick or body.
Colors: bullishOBColor (default green) and bearishOBColor (default red) set the visual appearance of OB boxes.
Box Extension: boxExtension (default 100 bars) controls how far the OB box extends to the right on the chart.
RSI Filter: useRSI (default true) enables an RSI filter, with rsiLength (default 14), rsiBullishThreshold (default 50), and rsiBearishThreshold (default 50) for trend confirmation.
M15 Support/Resistance: useSR (default true) and srLookback (default 20) integrate M15 timeframe swing highs and lows for additional OB validation.
Core Logic:
Bullish OB Detection: Identifies a strong upward move (0.5–1%) with volume above the threshold. It then looks back to the last bearish candle before the move to define the OB zone. RSI > 50 and proximity to M15 support/resistance (optional) enhance confirmation.
Bearish OB Detection: Identifies a strong downward move (0.5–1%) with volume confirmation, tracing back to the last bullish candle. RSI < 50 and M15 resistance proximity (optional) add validation.
The OB zone is drawn as a rectangle from the high to low of the identified candle, extended rightward.
Visual Output:
Boxes: Uses box.new to draw OB zones, with left set to the previous bar (bar_index ), right extended by boxExtension, top and bottom defined by the OB’s high and low prices. Each box includes a text label ("Bullish OB" or "Bearish OB") and is semi-transparent.
Colors distinguish between bullish (green) and bearish (red) OBs.
Alerts:
Global alertcondition definitions trigger notifications for "Bullish OB Detected" and "Bearish OB Detected" when the respective conditions are met, displaying the current close price in the message.
Helper Functions:
f_priceChangePercent: Calculates the percentage price change between open and close prices.
isNearSR: Checks if the price is within 0.2% of M15 swing highs or lows for support/resistance confluence.
How It Works
The script runs on each candle, evaluating the current price action against the user-defined criteria.
When a bullish or bearish move is detected (meeting the percentage, volume, RSI, and S/R conditions), it identifies the preceding candle to define the OB zone.
The OB is then visualized on the chart, and an alert is triggered if configured in TradingView.
Use Case
This indicator is tailored for your BTC scalping strategy, where trades last 1–15 minutes targeting 0.3–0.5% gains. It helps traders spot institutional order zones on the M5 chart, confirmed by secondary M1 analysis, and integrates with your use of EMAs, RSI, and volume. The customizable settings allow adaptation to varying market conditions or personal preferences.
Limitations
The M15 S/R detection is simplified (using swing highs/lows), which may not always align perfectly with manual support/resistance levels.
Alerts depend on TradingView’s alert system and require manual setup.
Performance may vary with high volatility or low-volume periods, necessitating parameter adjustments.

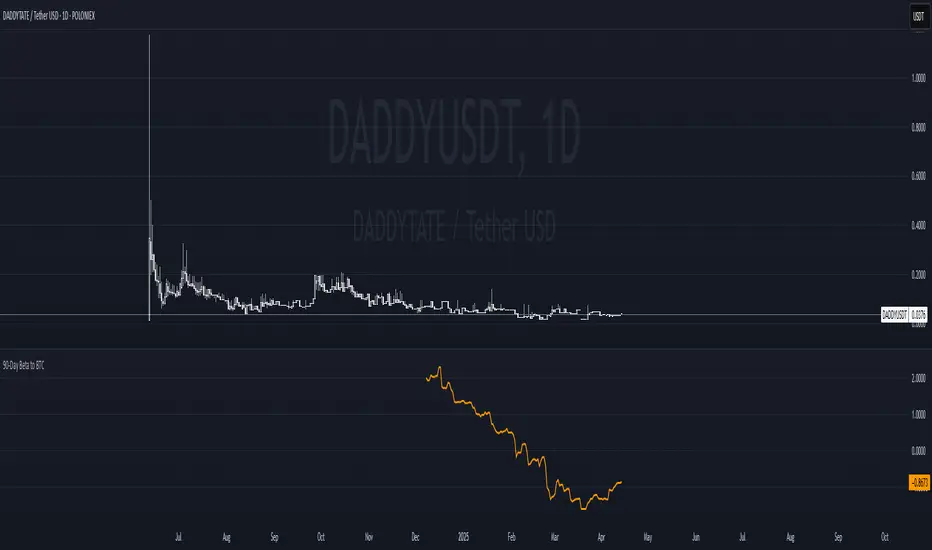
90-Day Beta to BTCOverview:
The 90-Day Beta to BTC indicator measures the volatility of a specific token relative to Bitcoin (BTC) over the past 90 days. Beta is a widely used statistical measure in financial markets that indicates how much a token's price moves in relation to BTC. A higher beta means the token is more volatile compared to BTC, while a lower beta means it is less volatile or moves similarly to BTC.
How It Works:
This indicator calculates the daily logarithmic returns of both the token and Bitcoin, then computes the covariance between their returns and the variance of Bitcoin’s returns. The resulting Beta value reflects the degree to which the token’s price fluctuates relative to Bitcoin's price over the past 90 days.
Beta > 1: The token is more volatile than Bitcoin, showing higher price swings.
Beta = 1: The token moves in lockstep with Bitcoin, exhibiting similar volatility.
Beta < 1: The token is less volatile than Bitcoin, showing smaller price fluctuations.
Beta = 0: The token's price movement is uncorrelated with Bitcoin’s price.
Negative Beta: The token moves opposite to Bitcoin, indicating an inverse relationship.
Use Case:
This indicator is particularly useful for traders or investors looking to identify tokens with high speculative volatility. Tokens with Beta values above 1 are typically high-risk, high-reward assets, often driven by hype, social trends, or market speculation. Conversely, tokens with Beta values below 1 offer a more stable price relationship with Bitcoin, making them less volatile and potentially safer.
In the context of a Trash Token Tournament, tokens with a higher Beta (greater than 1) may be more attractive due to their heightened volatility and potential for larger price swings, making them the “wild cards” of the market.
Visual Representation:
The Beta value is plotted as a line chart beneath the main price chart, offering a visual representation of the token’s volatility relative to Bitcoin over the last 90 days. Spikes in Beta indicate periods of increased volatility, while drops suggest stability.
DB - CME Gap [Multi Asset Auto Detection: BTC,SOL, etc]DB - CME Gap is a pro-grade, zero-maintenance CME gap tracker designed for serious traders.
This script automatically detects unfilled CME futures gaps across a wide range of assets—crypto, equities, bonds, commodities, FX, and agriculture—by pulling the official Friday close from CME’s daily futures data. It visually highlights unfilled weekend gaps and keeps them active on the chart until the price fully crosses through the gap level, offering a reliable view of market inefficiencies that often attract future liquidity.
Whether you're trading BTC, ES, CL, ZN, 6E, or ZC... this tool auto-detects and adjusts to the asset you're charting, so you don’t need to change any settings.
🧠 Key Benefits
Fully Automated – No symbol selection required; works instantly across asset classes
Professional Grade – Clean, minimal visuals with dynamic gap tracking
Always Accurate – Uses CME official daily closes to identify true weekend gaps
Cross-Market Versatility – Supports a broad range of assets without editing code
✅ Features
🔍 Auto Symbol Detection
Automatically identifies whether you're viewing BTC, ETH, SOL, ES, NQ, CL, ZN, 6E, GC, ZC, and more—no input required.
📅 CME Friday Close Logic
Pulls the actual Friday close from CME's daily data to detect accurate gap reference points.
🚨 Weekend Gap Detection
Monitors Friday after-hours, Saturday, and Sunday to detect gaps between CME close and weekend price action.
🧠 Persistent Gap Tracking
Gaps remain active until price fully crosses the gap level—no false closures.
📈 Dynamic Line Drawing
Draws a horizontal line at the gap price and extends it to the point of fill.
🌈 Custom Gradient Shading
Fills the area between the current price and the CME gap with directional color gradients based on price movement.
🎨 User-Configurable Colors
Adjust bull and bear fill color themes to suit your personal style.
🧩 Compatible with All Major Asset Classes
Works with:
Crypto: BTC, ETH, SOL
Equities: ES, NQ, YM, MES, MNQ
Bonds & Rates: ZN, ZB, ZF, ZT, GE
Commodities: CL, GC, NG, BZ, SI
FX: 6E, 6J, 6B
Ags: ZC (Corn), ZS (Soybeans)

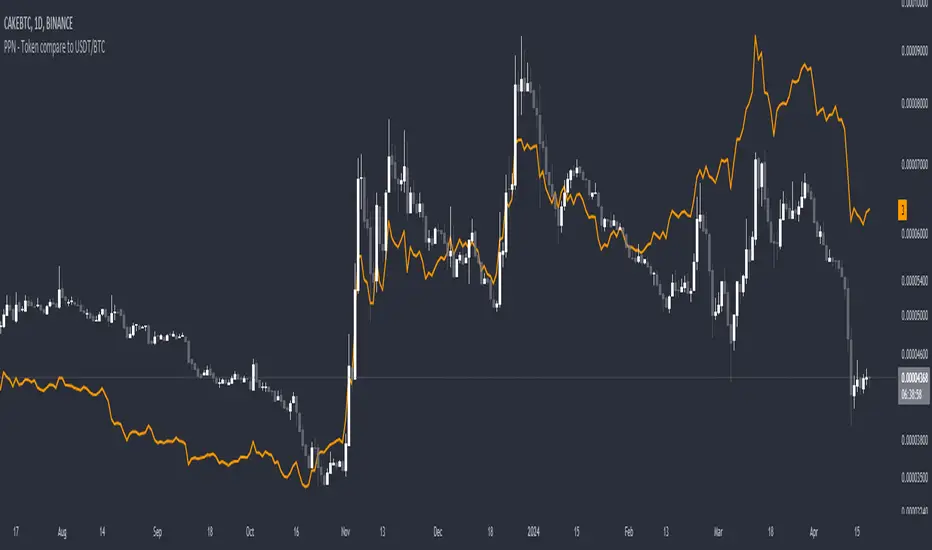
PPN - Token compare to USDT/BTCThis simple indicator allows you to easily view the price of a selected cryptocurrency token in either USDT or BTC on TradingView charts. By adding this indicator to your chart, you can quickly compare the price of the token to either USDT (Tether) or BTC (Bitcoin).
**Features:**
- Choose between displaying the token price in USDT or BTC.
- Automatically detects the current trading pair and adjusts the display accordingly.
- Uses data from the BINANCE exchange to fetch real-time prices.
**How to Use:**
1. Add the indicator to your TradingView chart.
2. Select the desired ticker ending (USDT or BTC) in the indicator settings.
3. Pin the indicator to a new scale (More -> Pin to Scale -> New scale or no scale (fullscreen).
**Note:** This indicator is intended for informational purposes only and should not be used as the sole basis for making trading decisions. Always conduct your own research and consult with a financial advisor before making any investment decisions.
---
Feel free to use and modify! <3
Message me on TradingView if you have any suggestions!
MBAND 200 4H BTC/USDT - By MGS-TradingMBAND 200 4H BTC/USDT with RSI and Volume by MGS-Trading: A Neural Network-Inspired Indicator
Introduction:
The MBAND 200 4H BTC/USDT with RSI and Volume represents a groundbreaking achievement in the integration of artificial intelligence (AI) into cryptocurrency market analysis. Developed by MGS-Trading, this indicator is the culmination of extensive research and development efforts aimed at leveraging AI's power to enhance trading strategies. By synthesizing neural network concepts with traditional technical analysis, the MBAND indicator offers a dynamic, multi-dimensional view of the market, providing traders with unparalleled insights and actionable signals.
Innovative Approach:
Our journey to create the MBAND indicator began with a simple question: How can we mimic the decision-making prowess of a neural network in a trading indicator? The answer lay in the weighted aggregation of Exponential Moving Averages (EMAs) from multiple timeframes, each serving as a unique input akin to a neuron in a neural network. These weights are not arbitrary; they were painstakingly optimized through backtesting across various market conditions to ensure they reflect the significance of each timeframe’s contribution to overall market dynamics.
Core Features:
Neural Network-Inspired Weights: The heart of the MBAND indicator lies in its AI-inspired weighting system, which treats each timeframe’s EMA as an input node in a neural network. This allows the indicator to process complex market data in a nuanced and sophisticated manner, leading to more refined and informed trading signals.
Multi-Timeframe EMA Analysis: By analyzing EMAs from 15 minutes to 3 days, the MBAND indicator captures a comprehensive snapshot of market trends, enabling traders to make informed decisions based on a broad spectrum of data.
RSI and Volume Integration: The inclusion of the Relative Strength Index (RSI) and volume data adds layers of confirmation to the signals generated by the EMA bands. This multi-indicator approach helps in identifying high-probability setups, reinforcing the neural network’s concept of leveraging multiple data points for decision-making.
Usage Guidelines:
Signal Interpretation: The MBAND bands provide a visual representation of the market’s momentum and direction. A price moving above the upper band signals strength and potential continuation of an uptrend, while a move below the lower band suggests weakness and a possible downtrend.
Overbought/Oversold Conditions: The RSI component identifies when the asset is potentially overbought (>70) or oversold (<30). Traders should watch for these conditions near the MBAND levels for potential reversal opportunities.
Volume Confirmation: An increase in volume accompanying a price move towards or beyond an MBAND level serves as confirmation of the strength behind the move. This can indicate whether a breakout is likely to sustain or if a reversal has substantial backing.
Strategic Entry and Exit Points: Combine the MBAND readings with RSI and volume indicators to pinpoint strategic entry and exit points. For example, consider entering a long position when the price is near the lower MBAND, RSI indicates oversold conditions, and there is a notable volume increase.
About MGS-Trading:
At MGS-Trading, we are passionate about harnessing the transformative power of AI to revolutionize cryptocurrency trading. Our indicators and tools are designed to provide traders with advanced analytics and insights, drawing on the latest AI techniques and methodologies. The MBAND 200 4H BTC/USDT with RSI and Volume indicator is a prime example of our commitment to innovation, offering traders a sophisticated, AI-enhanced tool for navigating the complexities of the cryptocurrency markets.
Disclaimer:
The MBAND indicator is provided for informational purposes only and does not constitute investment advice. Trading cryptocurrencies involves significant risk and can result in the loss of your investment. We recommend conducting your own research and consulting with a qualified financial advisor before making any trading decisions.

HSI - Halving Seasonality Index for Bitcoin (BTC) [Logue]Halving Seasonality Index (HSI) for Bitcoin (BTC) - The HSI takes advantage of the consistency of BTC cycles. Past cycles have formed macro tops around 538 days after each halving. Past cycles have formed macro bottoms every 948 days after each halving. Therefore, a linear "risk" curve can be created between the bottom and top dates to measure how close BTC might be to a bottom or a top. The default triggers are set at 98% risk for tops and 5% risk for bottoms. Extensions are also added as defaults to allow easy identification of the dates of the next top or bottom according to the HSI.

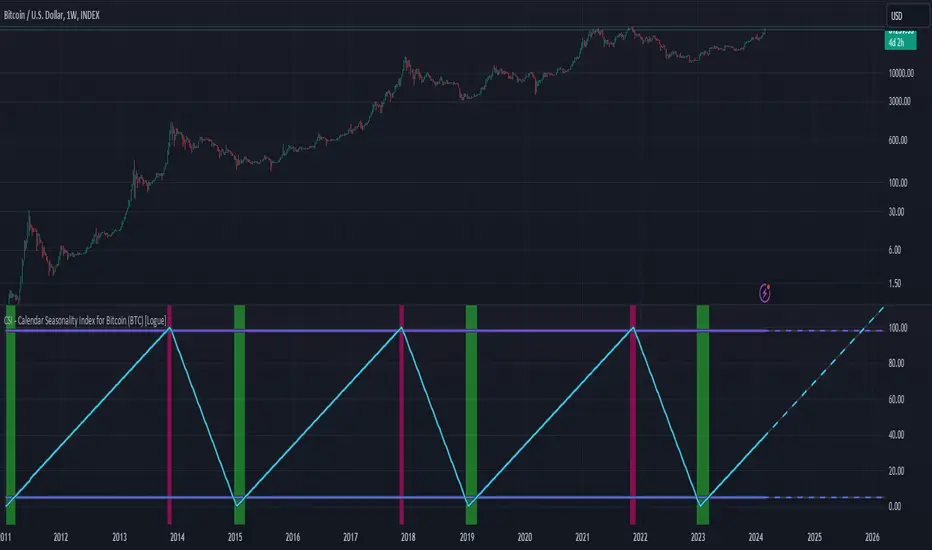
CSI - Calendar Seasonality Index for Bitcoin (BTC) [Logue]Calendar Seasonality Index (CSI) for Bitcoin (BTC) - The CSI takes advantage of the consistency of BTC cycles. Past cycles have formed macro tops every four years near November 21st, starting from in 2013. Past cycles have formed macro bottoms every four years near January 15th, starting from 2011. Therefore, a linear "risk" curve can be created between the bottom and top dates to measure how close BTC might be to a bottom or a top. The default triggers are at 98% risk for tops and 5% risk for bottoms. Extensions are also added as defaults to allow easy identification of the dates of the next top or bottom according to the CSI.
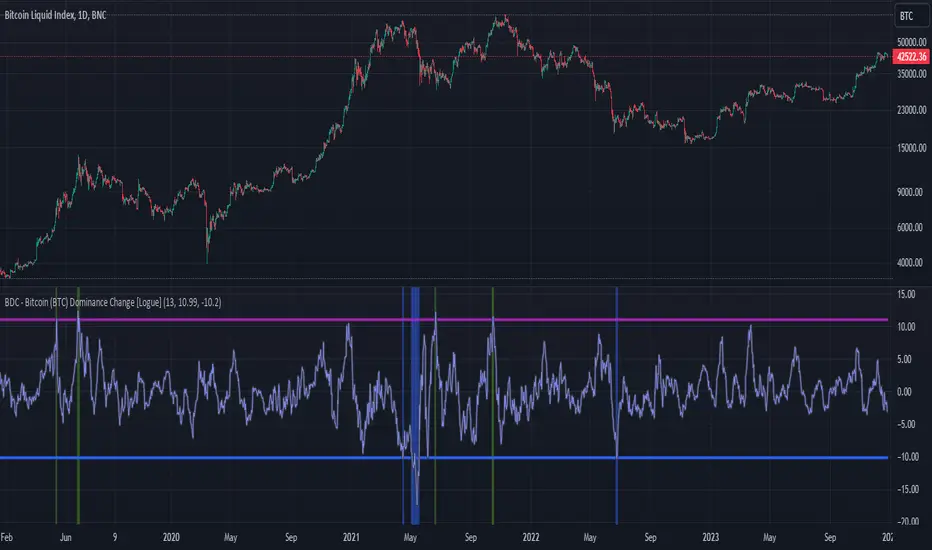
BDC - Bitcoin (BTC) Dominance Change [Logue]Bitcoin Dominance Change. Interesting things tend to happen when the Bitcoin dominance increases or decreases rapidly. Perhaps because there is overexuberance in the market in either BTC or the alts. In back testing, I found a rapid 13-day change in dominance indicates interesting switches in the BTC trends. Prior to 2019, the indicator doesn't work as well to signal trend shifts (i.e., local tops and bottoms) likely based on very few coins making up the crypto market.
The BTC dominance change is calculated as a percentage change of the daily dominance. You are able to change the upper bound, lower bound, and the period (daily) of the indicator to your own preferences. The indicator going above the upper bound or below the lower bound will trigger a different background color.
Use this indicator at your own risk. I make no claims as to its accuracy in forecasting future trend changes of Bitcoin.
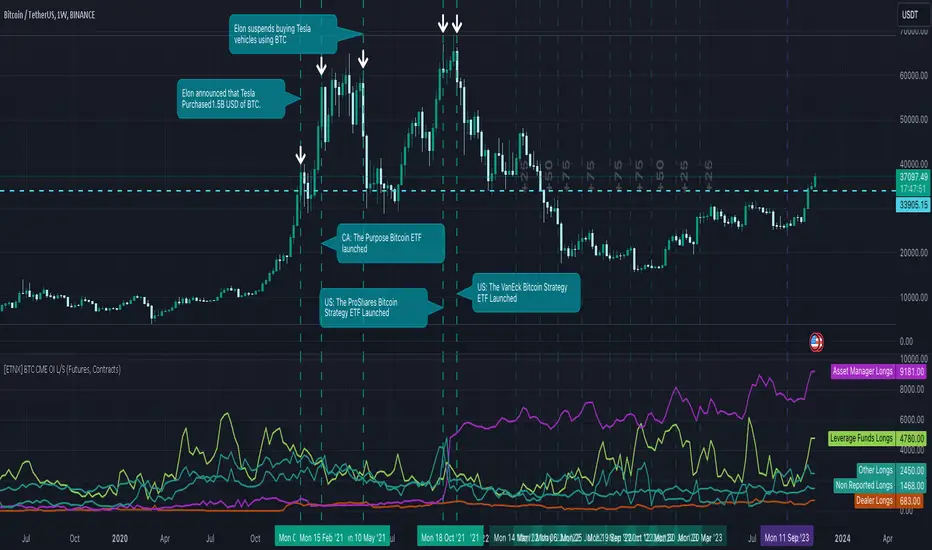
[ETNX] BTC CME OI L/SOVERVIEW
This indicator displays how many traders have Long and Short positions opened on CME Bitcoin Futures and Options. The data is provided from the CFTC Commitments of Traders Reports. These reports are given weekly. Therefore, this indicator works better on weekly timeframes.
The COT reports are separated into 5 categories:
Dealer/Intermediary - These participants are typically described as the “sell side” of the market. Though they may not predominately sell futures, they design and sell various financial assets to clients. They tend to have matched books or offset their risk across markets and clients. Futures contracts are part of the pricing and balancing of risk associated with the products they sell and their activities. These include large banks (U.S. and non-U.S.) and dealers in securities, swaps, and other derivatives.
Asset Manager/Institutional - These are institutional investors, including pension funds, endowments, insurance companies, mutual funds, and portfolio/investment managers whose clients are predominantly institutional.
Leveraged Funds - These are typically hedge funds and various types of money managers, including registered commodity trading advisors (CTAs); registered commodity pool operators (CPOs), or unregistered funds identified by CFTC. The strategies may involve taking outright positions or arbitrage within and across markets. The traders may be engaged in managing and conducting proprietary futures trading and trading on behalf of speculative clients.
Other Reportables - Reportable traders not placed into one of the first three categories are placed into the “other reportables” category. The traders in this category mostly use markets to hedge business risk, whether that risk is related to foreign exchange, equities, or interest rates. This category includes corporate treasuries, central banks, smaller banks, mortgage originators, credit unions and any other reportable traders not assigned to the other three categories.
Non Reportable
INPUT DISPLAY
The Open Interest can be displayed in three ways:
Contracts - How many contracts are opened on CME
BTC - How many BTC the contracts worth
Billions USD - How much is worth in USD based on the CME BTC Price
The Open Interest is calculated for:
Futures - The Futures Short and Long Positions Opened
Futures & Options - The Futures & Options Short and Long Positions Opened
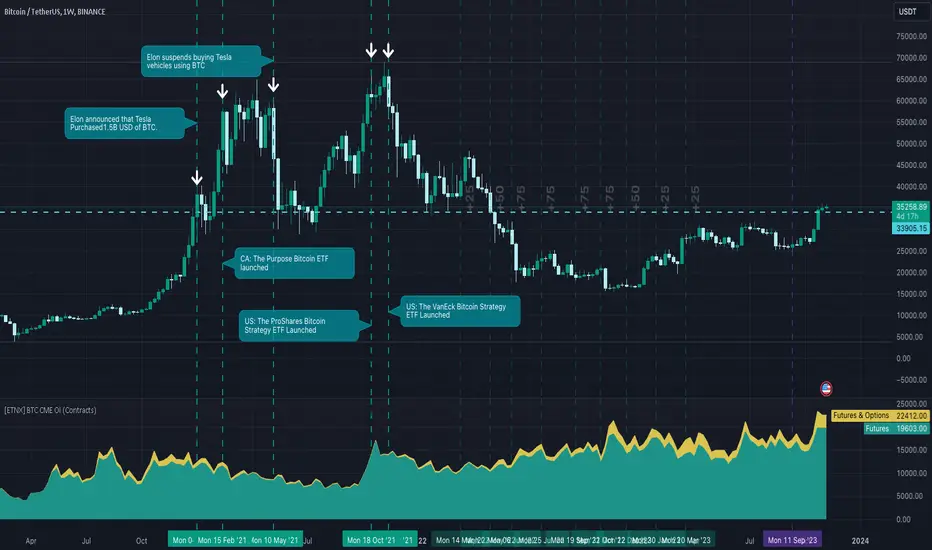
[ETNX] BTC CME OIOVERVIEW
This indicator displays the Open Interest based on CME Bitcoin Futures & Options. The data is provided from the CFTC Commitments of Traders Reports. These reports are given weekly. Therefore, this indicator works better on W timeframes.
INPUTS
The Open Interest can be displayed in three ways:
Contracts - How many contracts are opened on CME
BTC - How many BTC the contracts worth
Billions USD - How much is worth in USD based on the CME BTC Price
Bitfinex ETH/BTC Whale Indicator [Benson]This indicator monitors the ETH/BTC position changes of the Bitfinex whales.
When the indicator is on an upward trend, it signifies that the whales are accumulating long positions in ETH/BTC.
Conversely, when the indicator drops sharply, it indicates that the whales are exiting their long positions in ETH/BTC.
Since 2017, the actions of Bitfinex whales have shown a significant correlation with the ETH/BTC exchange rate.
This is because the strength or weakness of ETH/BTC is strongly related to the altcoin season.
Using this indicator effectively can help you identify the cycles of the altcoin season and outperform most of the market participants.

Blockchain Fundamentals - Active Address Sentiment Osc. [CR]Blockchain Fundamentals: Active Address Sentiment Oscillator AASO
Back with another script today, this one is a useful tool in helping to determine bitcoins value. We are looking at 2 data sources: the daily active addresses on the BTC blockchain, and the daily returns of BTC.
THIS INDICATOR WILL ONLY GIVE YOU THE CORRECT RESULTS ON THE DAILY TIMEFRAME
There is an interesting relationship that you can see by comparing the two timeseries. But for us to create a good indicator we first need to normalize the data. So we look at the percent change over the past 28 days for each metric (DAA and price).
THIS INDICATOR WILL ONLY GIVE YOU THE CORRECT RESULTS ON THE DAILY TIMEFRAME
We then calculate standard deviation bands around the DAA metric. We finalize them by averaging the bands over a 28 day period.
When the Price series (yellow line) is higher than the SD bands BTC is considered overvalued or price is overheated. A pullback could be expected soon. When the Price series is below the SD bands BTC is considered undervalued or price is oversold.
THIS INDICATOR WILL ONLY GIVE YOU THE CORRECT RESULTS ON THE DAILY TIMEFRAME
This tool doesnt give signals on the one minute chart or tell you exactly when to buy or sell. BUT what it does do is act as a convenient macro sentiment indicator that is not based completely upon price.
In an attempt to narrow down the really juicy areas, if you seen the background color highlights with white, that means its likely a top or bottom. At the very least on a local sense and many times in a cyclical macro sense as well. It also narrows down the signal to a generally more profitable area.
This indicator is not meant to be used on timeframes other than daily (did I mention that already?). I am lazy and did not code the calculations to be MTF (which is why you have to use on the daily chart). If you want to code this, please forward it on to me and I will post an update with a heartfelt credit to you.

What's BTC Doing?This is an RSI-like view of the price of BTC, along with a moving average. The purpose of it is so that whatever crypto you are trading, you can easily see what BTC is doing, so you can factor that into your signals.
Also, it could be used to look for divergences between BTC and the crypto you are trading, to detect potential reversals.
FieryTrading Long-Term Bitcoin Investor ToolDear community,
Today I want to present you one of my favorite scripts for long-term Bitcoin trading. I'm publishing this script because I think it will help traders to become more profitable in the long-term. Consequently, this script is targeted at long-term investors only, since it can take years before the price goes from the green area to the red area.
To use this script correctly you will need to use the BTCUSD index from Tradingview. Search "Bitcoin Index" in your symbol search bar, top result. Use daily candles on a logarithmic scale.
This scripts consists of two price bands, green and red. The green band has historically been a great area for the accumulation of BTC, whilst the red area has historically been a great area for exiting BTC. You could say that if the price is in (or below) the green bands BTC is undervalued, with the opposite being true for the red bands.
If you wish to add alerts to this script, simply click on the alert button > condition=Fierytrading BTC Tool. You can add alerts when the price enters the green area (Buy Area Cross) or red area (Sell Area Cross).
This simple script has historically proven to be very efficient at identifying bottoms (accumulation) and tops (distribution). Be aware that the usability of this script is not guaranteed in the future.

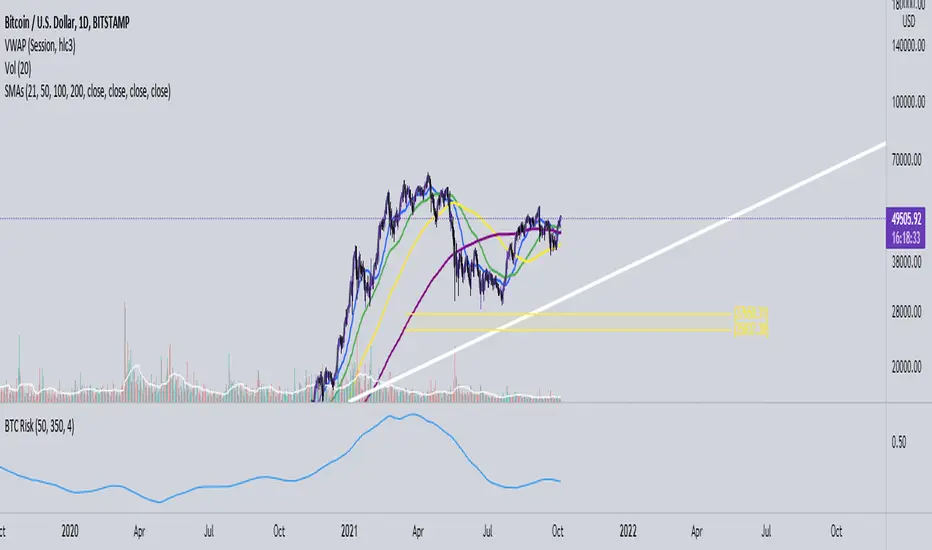
Bitcoin Risk Indicator (Daily)This indicator calculates the risk of buying and selling BTC, if the risk is reaching the upper boundaries of 0.8 to 1 then BTC is either getting close to a market cycle top or is far over extended.
If BTC is below 0.4 then this inidicates the least amount of Risk to buy BTC.
Performante's Golden Ratio SupportsThis dataset projects the MA for BTC divided by the golden ratio (1.6) as well as the Fibonacci sequence (0, 1, 1, 2, 3, 5, 8, etc).
These numbers are intertwined with markets, and have been an effective support level for key inflection points for Bitcoin's lows.
This indicator is mainly focused on the large timeframe and is set to work best on the daily timeframe . The daily is it's primary use-case.
As the market cap of BTC continues to grow, it will become progressively more and more difficult to grow at the previous appreciation rate.
This slowing growth in the market cap is demonstrated by the Fibonacci sequence support levels that are keeping the price from total capitulation dump like previous bear markets.
As we can see, the dark green MA is a great area for potential buy opportunities, while the lime green (on the bottom) have only been touched a couple times. This is a major capitulation for BTC and the crypto market.
These zones are great opportunities for investment entries as they are relatively low compared to the historic price action.

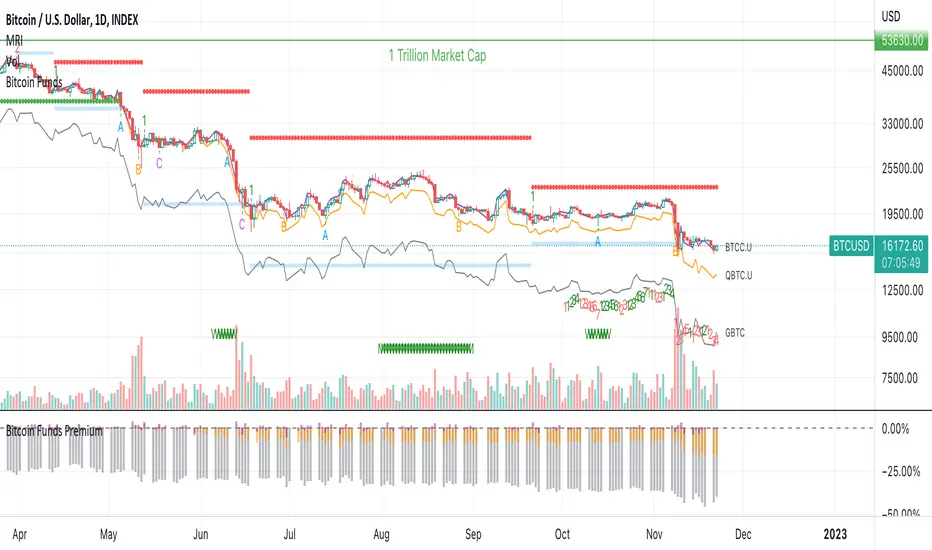
Bitcoin Funds PremiumDisplay the % premium of 4 different Bitcoin Funds relative to the price of Bitcoin in your current chart.
BTCC ETF
QBTC Fund
GBTC Trust
VBTC ETN
This indicator uses the metrics from the fund management websites to calculate the "Net Asset Value per Unit (NAVPU)" to calculate the true underlying value of the fund.
The difference is then compared to the price of Bitcoin in the chart you have open.
Note that the metrics change and therefore the graph is not accurate for long past timeframes.
If TradingView would expand their script language in a way to ingest CSV data from the funds website then this could be improved.
You can update the metrics for each fund in the settings dialogue.
The script will autodetect the currency pairs of your current graph and only display compatible funds:
BTC / USD will show BTCC.U, QBTC.U and GBTC
BTC / CAD will show BTCC and QBTC
BTC / EUR will show VBTC
The script should not show in other currency pairs so it will not mess up other charts you might switch to.
If you find bugs with this logic, please comment below so I can fix them.
Due to TradingViews "no-links in description" policy, you need to google each funds website yourself to find the current metrics. These search terms should help:
BTCC search "Purpose Bitcoin ETF"
QBTC search "3iq The Bitcoin Fund (QBTC)"
GBTC search "Grayscale® Bitcoin Trust"
VBTC search "VanEck Vectors Bitcoin ETN"
ADX Momentum cross + MacD + HH LL + Buy/Sell Signals and alerts Hello, This is the first indicator I have made and would like to contribute to the community.
This strategy came from trying to replicate a previous ADX Cross Indicator that I loved on MT4 which I used successfully on EUR/USD on high and low time frames. Through the process of trying to replicate it I failed, I decided to take what I had written so far and create my own ADX cross strategy using the combination of 3 ADX's, their lag. Then also using Higher highs and lower lows with the MacD to further filter the signals.
There are two buy and two sell conditions , the difference between these are just the order in which the ADX crossing determines the entry. The MacD and higher highs and lower lows are the same for filtering the signal.
You can change the look back for HH and LL look back range, along with the DI Length & ADX Smoothing for all ADX's. The lag used for either the buy or sell strategy with the Lag_Buy/Lag_Sell inputs. Lag_mid setting will affect all 4 conditions.
From testing and based on the ADX cross logic you should follow this structure when changing the inputs for:
DI Length: Lowest DI value (I.E. 1)
DI Lengtha: Middle DI value (I.E. 2)
DI Lengthb: Highest DI value (I.E. 3)
ADX Smoothing: Lowest Smoothing value (I.E. 1)
ADX Smoothinga: Middle Smoothing value (I.E. 2)
ADX Smoothingb: Highest Smoothing value (I.E. 3)
I tested this on the EUR/USD, but mainly I have been using it on BTC/USDT(binance) and BTC/USDT Perpetual futures(binance) with the 5 minute chart. I suggest playing around with the settings depending on the Symbol and timeframe you use because the default settings are what I last found to be optimal for my self on the 5min BTC/USDT Perpetual futures(binance) chart.
A good starting point I found when using the indicator on other charts is to use the below values:
DI Length: 7
DI Lengtha: 14
DI Lengthb: 21
ADX Smoothing: 7
ADX Smoothinga: 14
ADX Smoothingb: 21
If you have any questions, suggestions, or requests for this indicator feel free contact me. You can either comment on here or Message me
If you like this indicator please like and comment where you found it useful.

Trading-Dojo BTC Spot to Perps AlerterTrading-Dojo BTC Spot to Perps indicator
This indicator takes the top exchanges in BTC spot and the top exchanges for BTC Perps and displays the difference / premium of each aggregate.
Allows you to estimate in real time where the premium lies
Allows you to set alerts on consecutive bars in one trend or another
Allows you to set alerts if a premium threshold is crossed on either trend.

PWTPROv5 TrendIndicator with LONG/SHORT BTC ETH alerts
This PWTPRO indicator is based on VWAP , MACD and EMAs
Best fits for BTC /USDT and ETH/USDT trading for 1H timeframe for positional trading (3-5 trades per week)
15min TF is good for intraday scalping. 4H is good for longterm. Fits for any coin, forex, metals, oil and bonds.
There are 4 types of entries, 1,3 and 4 are on by default. It's more accurate. Rest you can test.
Warning. Not yet works with huge trend continuation. Use it manually with you own risk management, don't forget stop-losses.
Show take profits and stop-loss (It's off by defaults)
You can now add 3 take-profit and 1 stop-loss labels on chart in %
Use 0 values to remove any of them from the charts.
New option: Show entering position price as label
Minor visual improvements with price labels (y position is now correctly above/below bars)
+added new option to round prices for integer values (i.e. 9251 for btc instead of 9251.35) off by defaults and now fits for altcoins and any asses that has price below 1 (usd, btc etc)
This is invite only script. PM me if you want to test it.

2019- BITCOIN - BTFD -BANDS-60minAs long as BTC is in this uptrend,
We have identified the BTFD bands.
They are on the chart and part of this indicator.
When the Dip happens, turn on this indicator,
Use it on the hourly chart.
BTFD will appear when price is rejected by our BTFD Band.
This strategy indicator has worked since the beginning of BTC bullish turn in February
This indicator is set to expire in December 2019
ONCE BTC closes below our Green line on the hourly, this strategy can be deemed DEAD!
Thanks, BTFD Safely
Like this indicator?
Join our Discord, link in my Bio!
