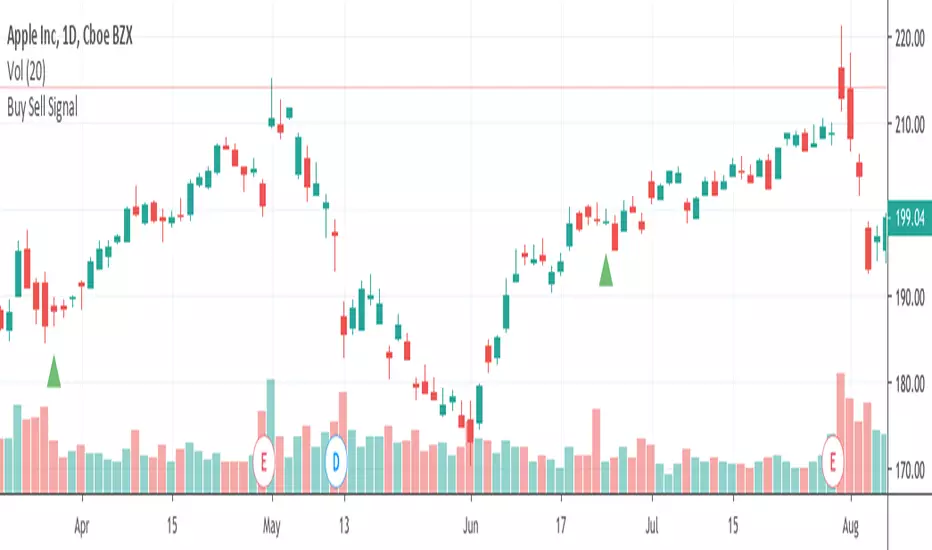
Buy Sell Signals 2Finding the highest winning percentage trade
Work best on stock (1D time frame)
Only available for a month.
If you like it, please message me
在腳本中搜尋"Buy sell"

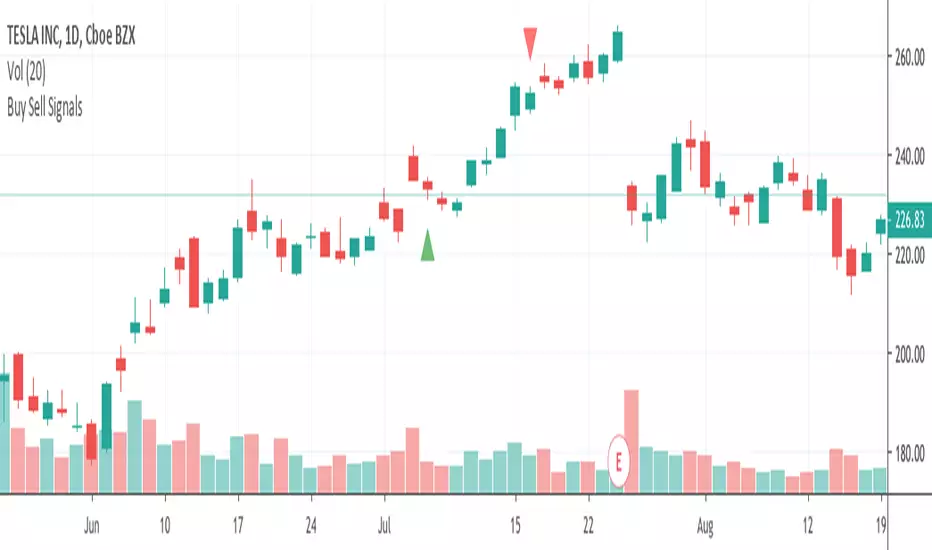
Buy Sell SignalFinding the highest winning percentage trade.
Work best on stock (1D time frame).
Only be available for a month.
If you like it, please message me
Buy Sell Signals 1Finding the high winning percentage trade signals.
It will be public for a month.
If you like it, please message me

Buy Sell SignalsFinding the high winning percentage trade signals.
It will be public for a month.
If you like it, please message me
Buy Sell SignalsFinding the high winning percentage trade signals.
It will be public for a month.
If you like it, please message me

Buy Sell SignalsFinding the high winning percentage trade signals.
It will be public for a month.
If you like it, please message me

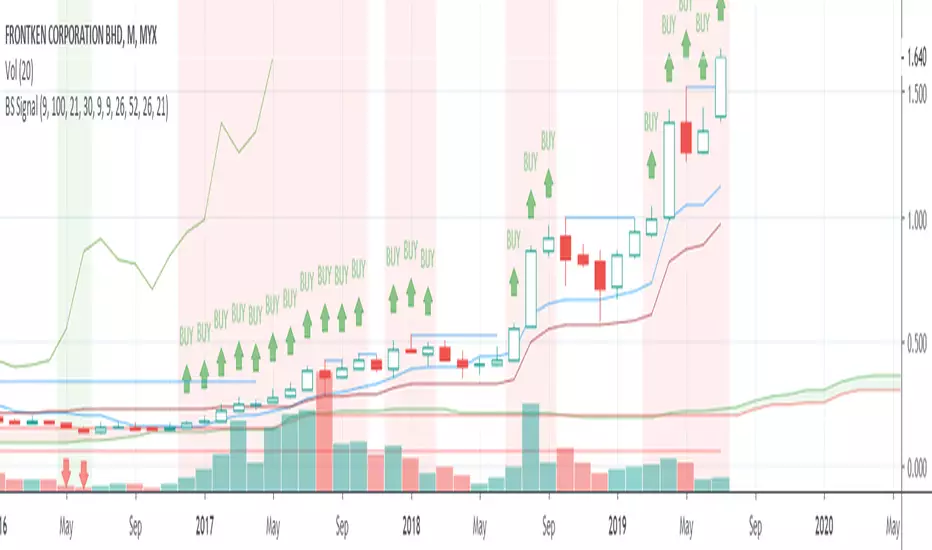
Buy Sell Signal & IchimokuThe script totally based on technical analysis. Indication of "Buy" will appear once the conditions are matched. Please don't follow "Buy" indication if it appear at top of chart.
Yellow candle is a pre-alert for any momentum coming together with increasing of price.
Yellow circle at volume bar is to show that the momentum was there.
Orange line is support & resistance.


Buy SellKıvanc hocanın yazdığı 2 stop loss indikatörünün birleşmesi sonucu bulundu. Çalışma mantığını kullandıkça anlayacaksınızıdır.


Buy Sell signal by Spicytrader
Get on board before going to the moon !
Spicytrader instantly identifies when a potential pump or dump is beginning.
Compatible with Autoview bot
GET ACCESS : spicytrader.com


Buy/Sell Ahmed Rashiedtrade with confidence good for both intra day and long term took me 2 yrs to finish it


trendY - Trend Signals & Smart Trailing Bands (OverltrendY is a clean, responsive trend-following overlay built around ATR (Average True Range) - so it adapts automatically to changing volatility instead of using fixed, one-size-fits-none” levels. It plots dynamic trend bands directly on your chart, highlights directional shifts, and prints Buy / Sell labels exactly when the trend flips - making it easy to spot momentum transitions and manage trades with a logical trailing structure.
What it does
Builds volatility-adjusted trend bands using ATR.
Locks bands in the trend direction (reduces noise and whipsaws compared to naive channels).
Detects trend reversals and prints clear Buy (trend turns up) / Sell (trend turns down) signals.
Includes ready-to-use alerts for automation and fast execution.
Key features
Adaptive to market conditions: ATR-based logic expands/contract bands as volatility changes.
Clear trend visualization: Green band for uptrends, red band for downtrends.
Flip-based signals: Labels only appear when direction changes, not on every candle.
Works on any market & timeframe: Crypto, forex, stocks, indices - scalping to swing.
Customizable: Adjust ATR Period and ATR Multiplier to fit your instrument and style.
Alerts included: Buy, Sell, and Direction Change alerts supported.
How to use it effectively
Treat trend flips as directional bias shifts (not magic). Many traders use:
Buy = trend turns up → look for longs (especially with confirmation).
Sell = trend turns down → look for shorts / exits.
Use the plotted band as a dynamic trailing stop guide or trend invalidation” level.
For higher-quality setups, combine trendY with:
Structure (break of recent swing, support/resistance)
Volume or VWAP
A higher timeframe trend filter
Settings guide
ATR Period: Higher = smoother, fewer signals. Lower = faster, more signals.
ATR Multiplier: Higher = wider bands, fewer flips. Lower = tighter bands, more flips.
Alerts
Long Trend
Short Trend
Direction Change
Important note (read before trading real money)
This indicator is a decision-support tool, not a guarantee of profit. Markets can and will fake out trend systems - especially during ranging conditions or news spikes. Always use proper risk management and test settings on your instrument before relying on signals.

Confluence Signal Intelligence Indicators (CSI Indicators)CSI - Confluence Signal Intelligence is a dual-oscillator analysis tool that combines two specialized indicators in a single pane. It provides visibility into cycle exhaustion and statistical deviation conditions to help identify potential turning points.
The Two Oscillators
CEI - Cycle Exhaustion Index (Upper Section)
CEI measures where price sits within its recent cycle range and detects momentum depletion states. It identifies moments when a move has stretched beyond typical levels, which historically have preceded mean-reversion.
Normalized range from -1.0 to +1.0
Configurable exhaustion thresholds
Reversal signals (REV) when extreme zones begin turning
Cycle wave overlay showing peak/trough phases
Stepped confluence indicator between sections
PRG - PDF Reversal Gauge (Lower Section)
PRG applies statistical transforms across multiple timeframes to measure deviation from price norms. It combines readings from primary and secondary periods to create a confluence assessment.
Multi-period analysis for timing and confirmation
Strong Confluence (SC) signals at statistical extremes
Confluence scoring when multiple periods align
Deviation bars showing distance from mean
Signal Types
CEI Signals:
REV - Reversal signal when exhaustion zone begins turning
Triangle markers - Entry into exhaustion zones
X markers - Extreme exhaustion levels
PRG Signals:
SC - Strong Confluence signal when threshold met
Triangle markers - Standard reversal signals
Diamond markers - Multi-period confluence alignment
Visual Design
The pane is divided into two distinct sections with a separator line:
Upper Section (CEI) - Cycle analysis with area fill and confluence stepping
Lower Section (PRG) - Statistical gauge with deviation bars
Color Coding - Gold for strong confluence, Green/Red for direction, Gray for neutral
Zone Backgrounds - Shaded areas marking overbought/oversold regions
Information Table - Real-time values, zones, confluence scores, and signals for both oscillators
Configuration
CEI Settings:
Cycle period and exhaustion lookback
Signal smoothing and sensitivity
Upper/lower exhaustion thresholds
Extreme level definition
PRG Settings:
Primary and secondary periods
Smoothing and extreme threshold
Confluence sensitivity
Strong confluence threshold
Multi-period confluence toggle
Layout Settings:
Adjustable vertical positioning
Independent scale factors for each oscillator
Separator position control
Alert Conditions
CEI Alerts - Bull/Bear reversals, extreme exhaustion levels
PRG Alerts - Strong confluence buy/sell, standard reversals
Combined Alerts - Both oscillators signaling together, strong combined confluence
Companion Indicator
CSI - Confluence Signal Intelligence is the main chart overlay that generates BUY/SELL signals with confidence classifications (HIGH/MEDIUM/LOW). This oscillator pane is designed to work alongside it, showing the cycle and statistical dynamics that contribute to signal generation.
When using both together:
Main CSI provides analytical signals directly on the price chart
This pane reveals the underlying CEI and PRG oscillator states
Aligned readings across both indicate stronger confluence
Reading the Pane
For potential long setups:
CEI in lower exhaustion zone (OS) and rising
PRG in oversold territory and turning up
REV or SC labels appearing
Both oscillators showing elevated confluence scores
For potential short setups:
CEI in upper exhaustion zone (OB) and falling
PRG in overbought territory and turning down
REV or SC labels appearing
Both oscillators showing elevated confluence scores
The oscillators may not signal on the exact same bar. When readings cluster within a few bars, this suggests developing conditions that warrant attention.
Risk Disclosure
This indicator measures technical conditions—not future price direction. Confluence scores represent analytical assessments based on statistical deviation and cycle position, not guarantees of market movement. All trading involves substantial risk of loss. Use this tool alongside your own analysis and proper risk management. No indicator can predict future price movements with certainty.
---
## AUTHOR'S INSTRUCTIONS:
```
To request access to CSI - Confluence Signal Intelligence , please send a private message or visit frontieralgo.com/tradingview.
For best results, use alongside the main CSI overlay on the price chart.
