PriceDivergence (ps4)This script implements price divergence module using signals from several factors like:
RSI, RSI Stochastic, MACD, Volume MA, Accumulation/Distribution, Fisher Transform and CCI
在腳本中搜尋"CCI"


Standard Deviation - Sum Of The Squares Minus Square Of The SumsIntroduction
The standard deviation measure the dispersion of a data set, in short this metric will tell you if your data is on average closer or farther away from the mean. Its one of the most important tools in statistics and living without it is pretty much impossible, without it you can forget about Bollinger-bands, CCI, and even the LSMA (ouch this hurt) .
Now i don't want to extend myself about the standard deviation since that would require a huge post but i want to show you how to calculate the standard deviation from the stdev pinescript function.
Sum Of The Squares Minus Square Of The Sums
Any metric calculated from a moving average can be classified as "running", this mean that the metric constantly update itself and is not constant, this is why it is better to say "running standard deviation" but its okay. If we use the standard calculation for the standard deviation which would be sqrt(sma(pow(close - sma,2))) we might get something totally different from the stdev function :
In white the pine stdev function and in red the standard calculation of both period 4, its clear that both are not the same, one might try to use the Bessel's correction but that won't do either, this is because most technical analysis tools will calculate the square root of the "Sum Of The Squares Minus Square Of The Sums" method to estimate the standard deviation
Another way is to use :
a = sqrt(sma(pow(close,2),length) - pow(sma(close,length),2))
By returning the difference we might still see some errors :
Nothing relevant of course.
Conclusion
Some of you might already be aware of this but a reminder is always good since it can be confusing to make what can be considered the good standard deviation formula and then have something totally different from the pine function, i hope this post will be useful and that you learned something from it.
Thanks for reading :)


Woodies CCI + CZ + SW indicatorsBased on
Changes:
- red bars removed and replaced by silver ones
- yellow bar (start of new trend) had been added
- more parameters can be set in settings dialogue (SW constants as well)


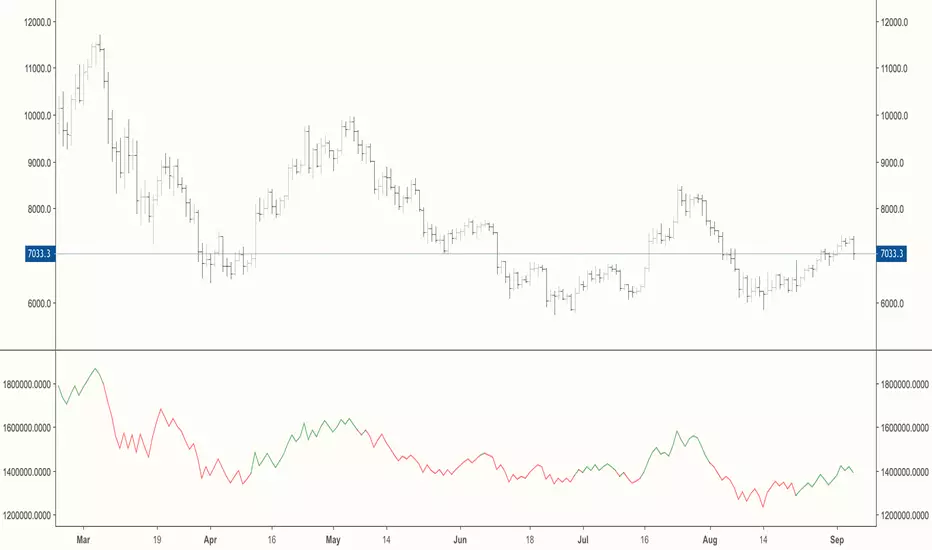
Volume Momentum [LucF]Volume momentum gives much more information than a simple volume MA. It does require interpretation however, since increasing volume momentum can indicate strengthening of both an up or down movement. Volume momentum peaks and bottoms are also interesting as they often lead to shifts in price movement.
In order to help interpretation, I color rising volume momentum using price momentum. Green indicates volume-supported upward price movement and red indicates volume-supported downward price movement.
As to falling volume momentum, in my world view it indicates exhaustion or disinterest which requires prior price activity to be interpreted. In strong and steady price movements it can indicate a mere pause. After high price volatility often signalling a top or bottom, falling volume momentum often leads reversals.
Features
Two optional MAs on the main volume momentum line, with crosses on the short MA.
A higher time frame line (shown by default), with the higher time frame being a user-defined multiple of the current chart’s interval. The default is 8, so that a 15m chart will also show a 2h volume momentum.
Two Markers
Tops/Bottoms (marker 1): these occur on high/low price momentum pivots situated in favorable regions, combined with volume momentum peaks.
Pauses/Reversals (marker 2): these simply identify volume momentum high pivots that often lead to shifts in price movement. They are not directional. You can choose to color bars where these markers occur (shown on chart).
You can show only long or short markers.
Alerts
You can define alerts on any combination of markers you configure. After defining the markers you want the alert to trigger on, make sure you are on the interval you want the alert to be monitoring at, then create the alert, select Volume Momentum, use the default “Configured Markers” alert condition and choose your triggering window (usually “Once Per Bar Close”). Once the alert is created, you can change the indicator's inputs with no effect on the alert.
Use Cases
The higher time frame line is very useful in situating current volume activity in a larger context.
I consider all peaks in volume momentum as potentially significant events.
When looking for an entry, I will often wait for the descending volume momentum to change direction at a shorter interval, using price momentum to confirm that increasing volume is working in my favor.
Volume momentum variations can often inform otherwise insignificant price momentum activity.
Here I use price momentum to color volume momentum; inversely, I also use volume momentum to color my momentum indicator.
Notes
Where the markers on my Volume Columns indicator focus on confirming strength of price movements, this indicators’ markers try to focus on shifts in price movement.
My volume momentum is calculated using a smoother variant of CCI which came to be known as WaveTrend.


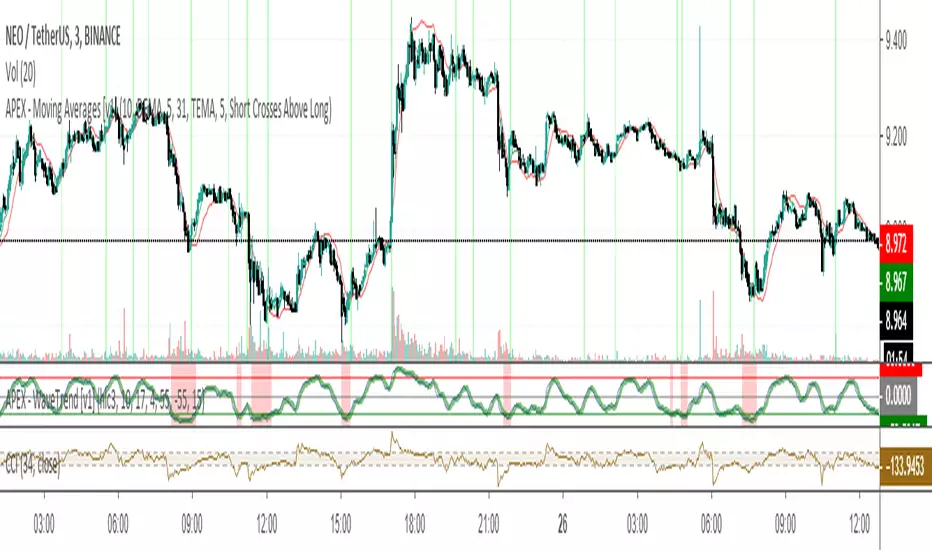
APEX - Moving Averages [v1]A moving average is the most known indicator that takes into consideration price from the last several periods of the price and calculates a smoothed line also known as a Moving average. This way you will cut out a lot of the noise and have a different view.
The most common usage is the moving average crossover system when you buy and sell when a crossover happens. This system is in general not very profitable but can be used effectively in trending markets.
There is really no general rule to what length should be used. The most well-known and respected lengths are 20 / 50 / 100 / 200 for almost all average. These values are respected as strong resistance and support levels. but if you plan to use a crossover Systems the most profitable settings tend to be when the averages are close together 14 and 28 etc. But this is an area I would appeal to for you to really try out what works and what does not.
Other uses of moving averages are the following:
Crossover system
Moving averages are pointing up and price crosses below (Buy Pullback)
The slow-moving average is Below the fast moving average to help to identify possible bullishness
Can be used as support and resistance lines
If you are an advanced user you may want to try out the following techniques:
Create your own moving average by combining several of those together with the source function
Using the Average True Range to create Keltner Channels
Using Standard deviation to create Bollinger bands (Bollinger bands are also accessible on their own)
You can use Moving averages to smooth the noise on other indicators such as RSI / CCI / MFI

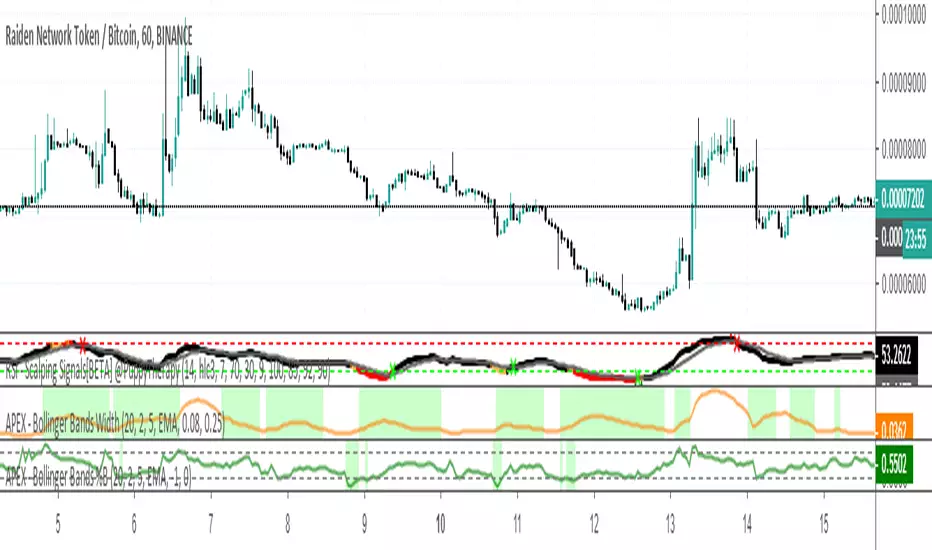
APEX - Bollinger Bands %BBollinger Bands %B is essentially BB Range it is an indicator derived from the standard Bollinger Bands. Bollinger Bands are a volatility indicator that creates a band of three lines which are plotted on the screen.
Bollinger Bands %B works the same as other momentum oscillators, it is best to look for short-term oversold in this case a volatility imbalance between upper and lower volatility. You are looking for values that are near 0 or negative.
Compared to other momentum Oscillators the %B is slightly less responsive than CCI but it does provide more signals than RSI / STOCH and STOCHRSI.
Divergences for many indicators v2.0A gift from me to all.
This script is developed to find Divergences for many indicators. it analyses divergences and then draws line on the graph. red for negatif, lime for positive divergences.
Currently script checks divergence for RSI, MACD, MACD Histogram, Stochastic, CCI, Momentum, OBV, Diosc, VWMACD and CMF indicators. You can use some or all of these indicators to check divergences as you wish by choosing them on the menu. Also you can add/remove many other indicators to the script to check if there is divergence.
The script first calculates tops/bottoms by using higher time frame zig zag and then finds divergences.
Higher Time Frames are
if currend period 1 min => HTF = 5 mins
if currend period 3 mins => HTF = 15 mins
if currend period 5 mins => HTF = 15 mins
if currend period 15 mins => HTF = 1 hour
if currend period 30 mins => HTF = 1 hour
if currend period 45 mins => HTF = 1 hour
if currend period 1 hour => HTF = 4 hours
if currend period 2 hours => HTF = 4 hours
if currend period 3 hours => HTF = 4 hours
if currend period 4 hours => HTF = 1 day
if currend period 1 day => HTF = 1 week
if currend period 1 week => HTF = 1 week
future plan : script finds regular divergences, soon I will add hidden divergences and also I plan to add alert ;)

Williams %R IndicatorDeveloped by Larry Williams, Williams %R is a momentum indicator much like the Stochastic Oscillator and is especially popular
for measuring overbought and oversold levels. The scale ranges from 0 to -100 with readings from 0 to -20 considered overbought,
and readings from -80 to -100 considered oversold. Typically, Williams %R is calculated using 14 periods and can be used on intraday,
daily, weekly or monthly data.
This implementation is enhanced with CCI in the form of background colors as a confirming signal and an indication of a prevailing trend.

Average Indicators Positionsby this script you can see the average level of macd, macd-asprey, rsi, stochastic, cci, momentum, obv, DI, volume weighted macd, cmf indicators within a period. It also calculates and creates the same graph for higher time frame, so you can see average levels for current and higher time frame. you can also check it for divergence/convergence. You can use it as you wish and add/remove indicators.


Commodity Channel Index + [CryptoxJedi]This is an updated version of the previous CCI+ indicator I published. This one is open source, so please use / improve it as you see fit.
As before, have added a zero line and 250 / -250 lines which are all adjustable for your trade system.
Enjoy
CXJ

[RESEARCH] Mean Absolute DeviationHello traders and developers!
I was wondering how built-in "dev" function in Pine is calculated so I made a little research.
I examined 7 samples:
0) "dev" function itself
1) "dev" according to its description: series - sma(series)
2) Mean Absolute Deviation
3) ratio of the absolute difference from 1) divided by period
4) ratio of the difference from 1) divided by period
5) Median Absolute Deviation
6) tricky for-loop to calculate Mean Absolute Deviation
The results of the null and sixth samples are identical.
So, TV built-in "dev" function represents Mean Absolute Deviation and it's description is incorrect.
Where it is used? For example: Commodity Channel Index. You can check its original formula and if you used simple standard deviation instead of MAD in your CCIs - well guys, you were wrong.
Good luck!

Intellitrader - Buy Random BACKTESTERI created a little backtester that it combines some of what we need to backtest to finetune a good strategy for Intellitrader.
RSI
STOCH
STOCHRSI
CCI
Price Change


Build A BotThis is the Robot we built during the 60 Minute Build-A-Bot webinar on September 12, 2018. We had a great time, and a lot of participation and the best part was that we finished up this robot and even ran a backtest in exactly 60 minutes! We built this robot based on recommendations and suggestions from those who were attending live. Lots of pieces in this robot, but you can always tinker with it, remove stuff, add things, whatever you want!
This version uses the CCI as a trigger for trade entry. The other version uses the Hull Moving Average as a trigger for trade entry.

Build A Bot Hull TriggerThis is the automated trading system we built during the 60-Minute Build-A-Bot webinar on September 12, 2018. We had a lot of fun, and implemented a TON of indicators LIVE during this webinar! And the best part is that as a group we researched, designed, and built a profitable robot in exactly 60 minutes!
We started by voting on the type of trading system, and this is a trend following system because it got the most votes. Then, the attendees in the webinar sent in their suggestions for indicators and settings during the live webinar (still counting toward the 60 minutes). Once we had the indicators on the chart, and we discussed various settings we could use, we got to work building the robot, and ran the first strategy test...and it was profitable!
This version uses the Hull Moving Average as a trigger for initiating the trade, and everything else is the same for the filters. The other version uses the CCI as a trigger for the trade, and many other indicators as filters.

OBV/CCI By AssetDisplay on balance volume, with trend strength identification by colour of another asset in a window of your current chart.