3GBH - CCI + HMAsCommodity Channel Index w/ Hull Moving Average's.
Included in this indicator:
- CCI
- 3x HMA's that use the CCI as the source.
-----
User-friendly.
You can change all the inputs, they are labelled for ease-of-use.
You can toggle On/Off any or all of the options.
在腳本中搜尋"CCI"

TSI HMA CCIHi!
This strategy has TSI and CCI indicators with the CCI being based on a HMA instead of the Price.
There is a number of conditions that must combine to create buy or sell signals, but it is basically a couple of MA crossovers.
The strategy opens new orders on each candle if the conditions are met, Either direction, so it is hedging.
It wont open new orders if there is a floating loss, and so is constantly attempting to hold a floating profit (drawup instead of drawdown)
But It has a StopLoss (set by user) for closing of losing orders, and it closes all orders in basket style when account is in profit to users set amount target profit.
Low commission set to simulate swap but Forex pairs generally dont have commission like the crypto exchanges do. So if you use this on cryptos, remember to increase the commission to your brokers amount.
Crypto users will likely find that because this opens so many orders the commission could erase its profits.
So i recommend this for Forex only, and perhaps, only NZDUSD 4H chart. other pairs, change settings for.
The strategy has settings for testing on target time spans, so you could test it on just Jan-Feb 2020 for example, if you want, or from Jan 2020 to present day.
Have Fun! Open Script for copy/paste/edit/publish your own version :)

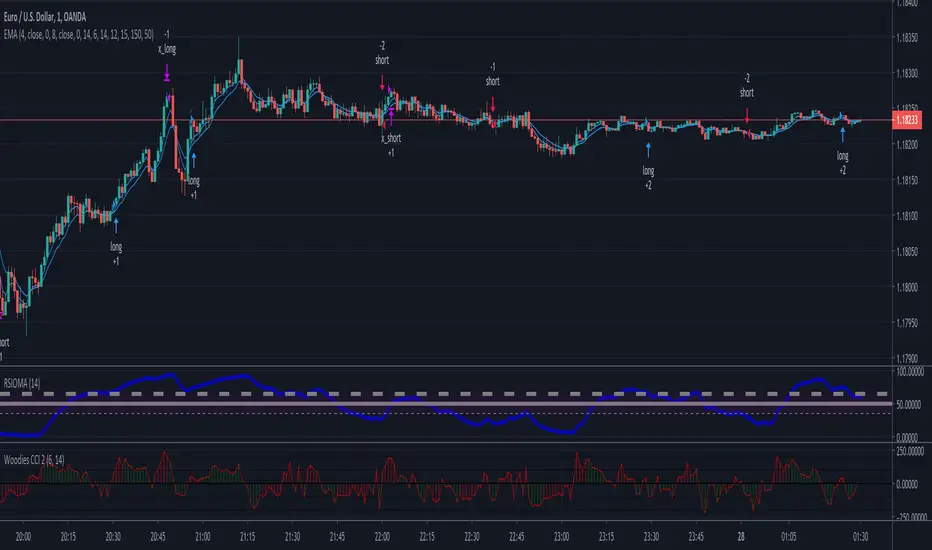
Daytrade strategy RSI CCI EMA 4/8This strategy is designed for daytrade charts.
Its made from
EMA 4 / EMA 8 to check for crosses
RSI levels for overbough/oversold
CCI levels
For entry, we check first if the ema 4 crossed ema 8
Secondly we confirm by checking the level of RSI level
Finally we confirm with CCI level
If all of them are on the same page we enter.
For exit we have a fixed pip points system for TP/SL
TSI CCI Hull with profit$$$This is a modified version of @SeaSide420 TSI CCI Hull with profits exit on long and short order
ORIGINAL SCRIPT:
/// /// feel free to edit/improve and comment

Trend Lines for RSI, CCI, Momentum, OBVHello Traders!
After publishing Trend Lines for RSI yesterday, I realized that Trend Lines for more indicators needed by the traders. so I decided to make it for four different indicators: RSI, CCI, OBV, Momentum
In the indicator options you can choose the indicator from pull-down menu.
How it works?
- On each bar it finds last 10 higher and lower Pivot Points (PP) for the indicator.
- from first bar to 10. Pivot Point it searchs if a trend line is possible
- for each PP it starts searching from the last PP .
- it checks if drawing a trend line possible or not and also it's broken or not
- if it's broken then optionally it shows broken trend lines as dotted (or you can option not to see broken lines)
- if it finds a continues trend line then it stops searhing more and draw trend line, this is done by checking angles (I did this to make the script faster, otherwise you may get error because of it needs time more than .2sec)
- the script makes this process for each PP
- then shows the trend lines
P.S. it may need 3-10 seconds when you added the script to the chart at first (because of calculations)
Trend lines for CCI:
Trend Lines for OBV
Trend Lines for Momentum:
You may want to watch how Trend Lines script works (that was made for RSI)
s3.tradingview.com
If you still didn't see Trend Lines v2 then visit:
All Comments are welcome..
Enjoy!

TSI CCI HullThis is TSI and CCI combined. The CCI is customized and is using HullMA, but the TSI is default TSI
For use with the HMAv420 indicator, to form trading strategy based on the 3 indicators.
Best as all 3 indicators used on 3 timeframes at once, ie 1m 5m 1H

Donochian CCISo this indicator have the following:
1. MTF CCI
2. donochian channel MTF both non repaint mode
buliish and bearish zone determine by ratio of the the donochian cahnnel
enter or exit can be either the bullish or bearish change of color or by cross over or under of the CCI
or combination of both
The high max and low max of the donochian channel show in hilated bar

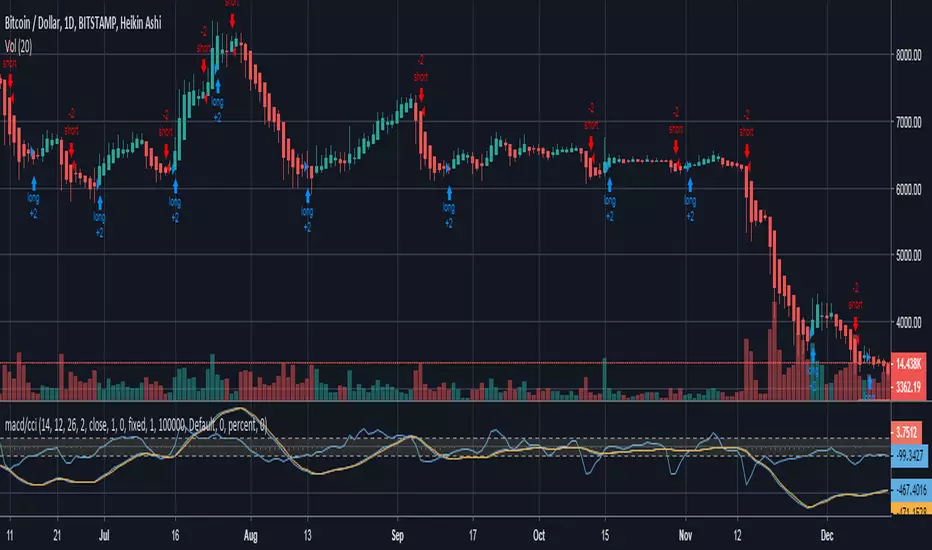
MACD+CCI Strategya simple strategy based on Joseph Nemeth MACD+CCI strategy
Reference reading: sites.google.com
VW EMA CCI + TTM Volume Weighted EMA CCI + TTM squeeze in one indicator
Credit goes to SpreadEagle 71 for the CCI and Greeny for the TTM

RIZ OBV with coloured CCIThis ones useful for spotting divergence on OBV, and also includes CCI to show overbought and oversold areas in the volume. I've coloured the OBV bar with the CCI levels. Look for divergence (best results on 5min chart I believe) with this and you can spot where to sell if a second peak is not supported by volume, also shows where the big guns are dumping lots of volume!
A volume study is always a good addition to any analysis I feel, and this is one of my day to day always on indicators.


Trend and Entry CCI ST15This is a T3 CCI with a fast and slow line as well as extreme lines, a -15,15 filter to make zero line rejections and crosses more mechanical and help weed out whipsaw. I will probably update description in the future and get into more detail about how the indicator is used but for now if you want more info look up woodie CCI patterns :) Good Luck!!
HMA Multi-Squeeze + CCI HeatmapUpdate on 'HMA Squeeze', added input options and colorbars. Fully custom inputs for 4 bull colors, 4 bear colors and one nuetral zone based on CCI values. Next edition will include a choice of moving averages and colorbars base on CVD?

BZNESMAN - High Win Rate CCI + PSAR + MA Strategy (70%+ Target)High Win Rate CCI + PSAR + MA Strategy (70%+ Target)


CMF, RSI, CCI, MACD, OBV, Fisher, Stoch RSI, ADX (+DI/-DI)Eight normalized indicators are used in conjunction with the CMF, CCI, MACD, and Stoch RSI indicators. You can track buy and sell decisions by tracking swings. The zero line is for reversal tracking at -20, +20, +50, and +80. You can use any of the nine indicators individually or in combination.

CMF, RSI, CCI, MACD, OBV, Fisher, Stoch RSI, ADX (+DI/-DI)Eight normalized indicators are used in conjunction with the CMF, CCI, MACD, and Stoch RSI indicators. You can track buy and sell decisions by tracking swings. The zero line is for reversal tracking at -20, +20, +50, and +80. You can use any of the nine indicators individually or in combination.

VIX CCI Oscillator [Compression + EMA Trigger + Bounce Glow]VIX CCI OSCILLATOR
ADJ CHART FOR YOUR LIKING
NOT AS SMOOTH AS PREVIOUS VERSION (STOCH)
SHOWS TIGER SIGNAL ON EMA
SAMEOUTPUT
HUD Box: emoji-coded tactical feedback
bounce 100 "💥 Expansion" :
bounce 0.8 "🔴 Overbought" :
bounce 0.618 "📉 Distribution" :
bounce 0.5 "🧠 Midline" :
bounce 0.382 "📈 Accumulation" :
bounce 0.2 "🟢 Oversold" :
bounce0.0 "💣 Expansion" : "⚪ Neutral"
Tiger EMA/STOCH
This logic checks if the oscillator is trending above or below its 48-period EMA,
If above, it paints the line GREEN🟢 (bullish),
If below, it paints it RED🔴 (bearish),
If compression is active, it overrides both with purple🟣 to highlight tactical squeeze conditions,
⚠️WARNING⚠️
ALWAYS REMEMBER THIS CHART IS VIX/USD
IN MOST CASES SPY MOVES VICE VERSA
I AM NOT RESPOSIBLE FOR YOUR OWN ACTIONS/TRADE IDEAS

RSI-CCI Momentum ScreenerRSI-CCI Momentum Screener;
How to Use:
Apply this script to 1H or 4H timeframe
Works well for NSE stocks, crypto, or forex
Look for a green label “BUY” that shows when the screener conditions are met

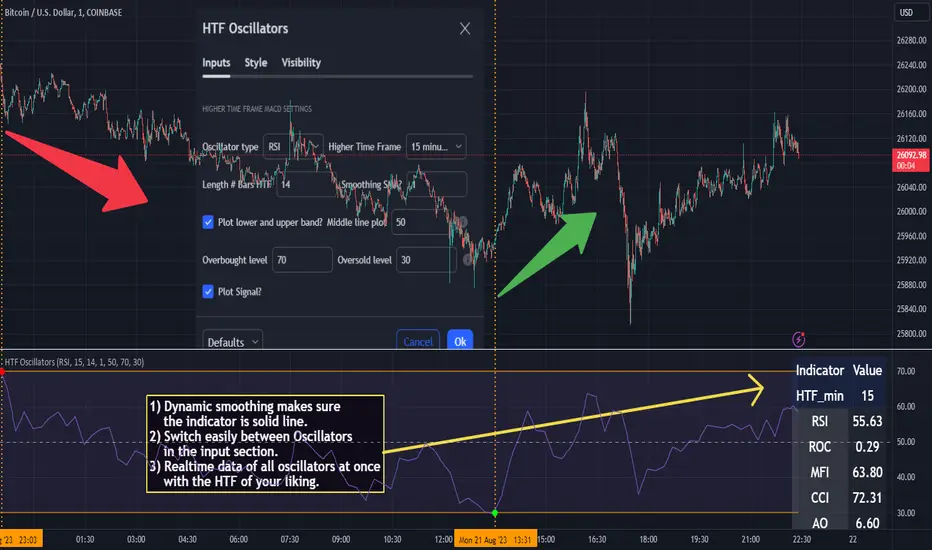
HTF Oscillators RSI/ROC/MFI/CCI/AO - Dynamic SmoothingThe Interplay of Time Frames: A Balanced View
Navigating the markets often involves interpreting trends from multiple angles. The HTF Oscillators with Dynamic Smoothing indicator enables you to do just that. This tool provides the option to integrate smoothed oscillator readings from Higher Time Frames (HTF) into lower time frame charts, such as a 1-minute chart. By doing so, the indicator offers a balanced viewpoint that bridges the gap between micro and macro perspectives, helping you make informed decisions without losing sight of the broader market context.
Features
Multi-Oscillator Support
Choose from a range of popular oscillators like the Relative Strength Index (RSI), Rate of Change (ROC), Money Flow Index (MFI), Commodity Channel Index (CCI), and Awesome Oscillator (AO). These oscillators are commonly used as foundational building blocks in trading strategy scripts by traders worldwide. Switch effortlessly between them, depending on your trading strategy and requirements. To maintain consistency and a familiar user experience, our script adopts the same visual aesthetics that you'll find in Pine Script indicators on TradingView: a sleek purple line for the oscillator and a transparent band filling. These visual elements are not only pleasing to the eye but also widely appreciated by the trading community.
Dynamic Smoothing
The unique dynamic smoothing feature calculates a smoothing factor based on the ratio of minutes between the Higher Time Frame (HTF) and your current time frame. This provides a sleek and responsive oscillator line that still holds the weight of the longer trend. One of the significant advantages of this feature is user experience; when you change your time frame, the HTF-values in your settings will remain consistent. This ensures that you can easily switch between different time frames without losing the insights provided by your selected HTF.
Visual Aids
Visual cues are an essential part of any trading strategy. The indicator not only plots signals to mark overbought and oversold conditions based on the dynamically smoothed oscillator but also provides you with the flexibility to customize your visual experience. You have the option to toggle on/off the display of these signals depending on your specific needs. Additionally, bands can be displayed at overbought and oversold levels, along with a reference middle line. If you switch between different oscillators (available in the parameter settings), remember to manually adjust the bands in the input settings to ensure signals matches with the type of oscillator to your liking.
User-Friendly Settings
We've grouped related settings together, making it easier for you to find what you're looking for. Adjust the oscillator type, length of bars, smoothing settings, and more with just a few clicks.
Information Table
A standout feature of this indicator is the real-time information table, which displays the values of all selected oscillators based on your specified Higher Time Frame (HTF) settings. This can be particularly useful for traders who depend on multiple indicators for their decision-making process. The data presented in the table is synchronized with the HTF options you've configured in the input settings, allowing for a more efficient and quick scan of values from higher time frames.
Educational Corner: The Power of the Information Table and Customization
The table incorporated into this indicator isn't just eye-candy; it's a practical tool designed to elevate your trading strategy. It dynamically displays real-time values of various oscillators for the HTF you've chosen. This is an exemplary use of TradingView's scripting capabilities to blend multiple indicators into a single visual panel, streamlining your analysis and decision-making process.
But here's the best part: You're not limited to what we've created. With some basic understanding of TradingView's scripting language, Pine Script, you can easily adapt this table to include different indicators that suit your unique trading style. The logic in the script is modular and can serve as a foundation for your own customized trading dashboard. So, go ahead, get creative and explore new combinations of indicators that will help you excel in your trading endeavors!
You no longer have to toggle between different charts or indicators to get the information you need; it's all there in one neatly organized table. We encourage you to tap into this feature and make it your own, empowering your trading like never before.
By doing so, you not only gain a more comprehensive toolset, but you also engage more deeply with your trading strategy, understanding its nuances and, ultimately, making more informed decisions.
Conclusion
The HTF Oscillators with Dynamic Smoothing is a versatile and powerful tool that brings together the best of both worlds: the perspective of higher time frames and the granularity of shorter ones. Its feature-rich setting options and real-time information table make it a potential useful addition to your trading toolkit.
Remember, while this indicator offers a comprehensive and smarter way to look at the markets, it is not a foolproof method for predicting market movements. Always use it in conjunction with other analysis methods and risk management strategies.
Supertrend ANY INDICATOR (RSI, MFI, CCI, etc.) + Range FilterThis indicator will generate a supertrend of your chosen configuration on any of the following indicators:
RSI
MFI
Accum/Dist
Momentum
On Balance Volume
CCI
There is also a RANGE FILTER built into the scripts so that you can smooth the indicators for the supertrend. This is an optional configuration in the settings. Also, you can change the oversold/overbought bounds in the settings (they are removed entirely for indicators without bounds).
If you find this indicator useful, please boost it and follow! I am open to suggestions for adding new indicators to this script, it's very simple to add new ones, just suggest them in the comments.

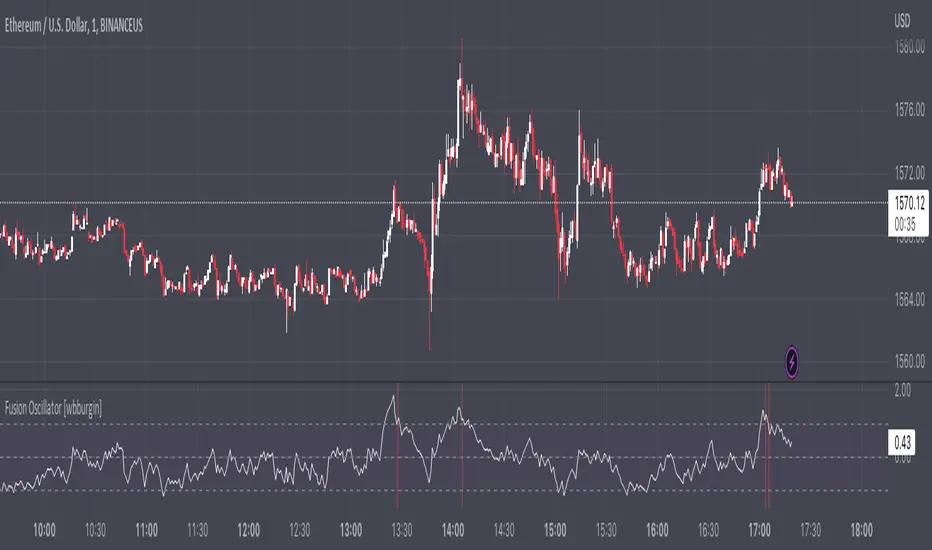
Fusion Oscillator (COMBINED RSI+MFI+MACD+CCI+TSI+RVI)The Fusion Oscillator aggregates several extremely-similar directional oscillators (RSI, MFI, MACD, CCI, TSI, RVI) into one average to visualize indicator agreement. To do this, I normalized several oscillators between to ensure equal weight.
The white line is the directional oscillator . The yellow line (turned off) is the nondirectional oscillator - namely, the ADX and ATR - this determines the buy/sell signals in conjunction with overbought/oversold levels for the directional oscillator.
The overall length is the sensitivity of the oscillator, not the lookback period. The maximum that works on the default settings is 3. Higher means less sensitive and more accurate.
I hope you all find this useful!
Quick and Simple - WPR+RSI+CCITake a look.
Couple of confluencial reversal signals from popular indicators (W%R, RSI & CCI). I can only say this shows how random the "stanard tools" are and how the market makers "play" these kind of tools to their advantage.
That said. It's better tha average, but not top-class, so expect to have to take signals with other confluence. DON'T take the plots or signals as buy / sell signals, they are just confluencial movements from these indicators based on how they should be "traditionally" used. Instead, use it as a guide as to what other traders may be thinking, or as a pull-back identifier.
Included 100 period ema as basic trend filter.
Not my normal type of script + been away for some time so be kind, lol :)
You might find it useful however so sharing.
More stuff to follow :)
