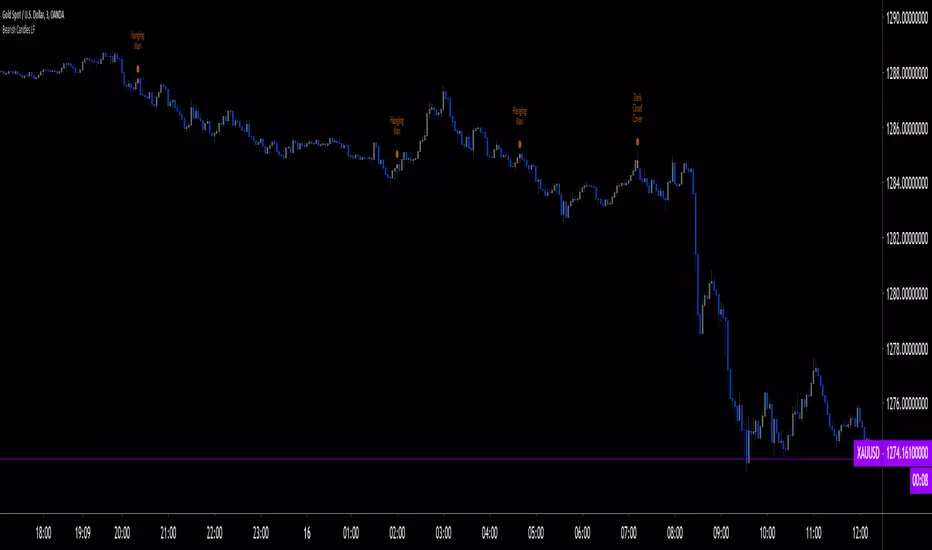
RSI CANDLESTICKSDisplays RSI indicator as candlesticks. Does candlestick pattern analysis apply to RSI? Can it aid in candlestick analysis on a price chart? Let's start a discussion.
在腳本中搜尋"Candlestick"

Smart FlexRange Breakout [The_lurker]The Smart FlexRange Breakout tool aims to identify trading opportunities based on price breakouts of dynamic levels (CALL, PUT) with a dotted centerline and the ability to select the applicable market. The tool relies on candlestick analysis over a specific time period (such as 3 hours). Candle data (searchHours) is collected to identify the most significant candle based on candlestick patterns and trading volume during the selected timeframe. Breakout levels and take-profit (TP) targets are then plotted, along with buy and sell signals, breakout notifications, and up/down trend lines based on Pivot Points.
The tool is run according to the selected timeframe.
Practical Use
1- Setup: Adjust the market, timeframe, number of hours, and time zone to suit the trader's needs.
2- Trading: Monitor signals (BUY/SELL) and TP levels to determine entry and exit points.
3- Trend Lines: Use them to understand the overall trend and confirm signals.
---
1. Objective: Identify trading opportunities based on price breakouts
- Trading opportunities: The indicator is designed to help traders identify moments when significant price movements are likely, allowing them to enter buy or sell trades based on market changes.
- Price breakouts: The indicator focuses on moments when prices break through key levels (resistance or support). A breakout occurs when the price exceeds a resistance level (up) or breaks a support level (down), indicating a potential continuation of the movement in the same direction.
- Dynamic: Resistance and support levels are not static; rather, they are calculated based on candlestick analysis over a specific period of time, making them adaptive to current market conditions.
---
2. Dynamic levels (resistance and support levels)
- Resistance levels: These represent prices that the price is difficult to break above, defined here as the high of the most significant candle during the specified period.
- Support levels: These represent prices below which the price is difficult to fall, defined as the low of the most significant candle.
- Dynamic: These levels are recalculated every new search period (searchHours), meaning they change based on the latest market data, unlike traditional static levels.
---
3. Adding a Dotted Center Line
- Center Line: A horizontal dotted line is drawn at the midpoint between the high and low of the most significant candle.
- Purpose:
- Provides a visual reference point for determining the current price position relative to support and resistance levels.
- Helps assess whether the price is moving toward a breakout (near resistance) or a breakout (near support).
- Dotted: The dotted pattern distinguishes it from the solid upper and lower lines, making it easier to distinguish visually.
---
4. Relying on candlestick analysis over a specific time period (searchHours)
- Candlestick Analysis: The indicator examines candlesticks to determine which ones have the most influence on price movement.
- Timeframe (searchHours):
- The user specifies the number of hours (1-6) for candle analysis, which determines the range of data the indicator relies on.
- Example: If searchHours = 3 and timeframe = 30 minutes, 6 candles are analyzed (3 hours ÷ 30 minutes).
- Flexibility: This period can be adjusted to suit different markets (such as volatile cryptocurrencies or more stable Forex).
---
5. Determining the Most Important Candle Based on Candle Patterns and Volume
- The most important candle: is the candle believed to have the greatest impact on price movement based on specific criteria.
- Candle Patterns:
- Candles are analyzed using a candlestick pattern library (such as Engulfing, Hammer, Doji).
- Reversal patterns (such as Morning Star, Shooting Star) are given a high importance score (100 points) because they indicate potential trend changes.
- Trading Volume:
- The trading volume of each candle is measured and compared to the maximum and minimum during the period.
- Volume is calculated as a percentage (0-100) and added to the pattern score to determine the most significant candle.
- Result: The candle with the highest score (patterns + volume) is used to determine support and resistance levels.
---
6. Timeframe
- Time interval: The user selects a time frame for the candles (15, 30, or 60 minutes).
- Importance:
- Determines the number of candles analyzed during the searchHours period.
- Affects the accuracy and speed of the signals (shorter timeframe = faster but less reliable signals; longer timeframe = slower but more reliable signals).
- Example: If the timeframe is 60 minutes and searchHours is 3, only 3 candles are analyzed.
---
7. Drawing Breakout Levels and Take Profit Targets (TP)
- Breakout Levels:
- Upper line (resistance): Drawn at the highest price of the most significant candle and is labeled "CALL".
- Lower line (support): Drawn at the lowest price of the most important candle and is called "PUT."
- These lines represent levels where a breakout is expected to lead to a strong price movement.
- Take Profit Targets (TP):
- Up to 8 bullish (above the upper line) and bearish (below the lower line) TP levels are calculated.
- They are calculated based on a percentage (tpPercentage) added or subtracted from the base lines.
- Example: If tpPercentage = 0.6% and the high price = 100, then bullish TP1 = 100.6, TP2 = 101.2, etc.
- Labels: Labels are drawn for each TP level indicating the value and level (TP1, TP2, etc.).
---
8. Buy and Sell Signals
- Buy (BUY) signal:
- Generated when the price breaks the upper line (ta.crossover).
- The "BUY" label is drawn with the redrawing of the TP levels.
- Sell signal (SELL):
- Generated when the price breaks the lower line (ta.crossunder).
- The "SELL" label is drawn with the redrawing of the TP levels.
- Purpose: To provide clear signals to the trader for making trade entry decisions.
=========================================================================
Thank you, n00btraders.
For using the import library: n00btraders/Timezone/1
For using the import library: The_lurker/AllCandlestickPatternsLibrary/1
========================================================================
Disclaimer:
The information and publications are not intended to be, nor do they constitute, financial, investment, trading, or other types of advice or recommendations provided or endorsed by TradingView.
تهدف أداة Smart FlexRange Breakout إلى تحديد فرص التداول بناءً على اختراقات الأسعار للمستويات الديناميكية (CALL، PUT) مع خط مركزي منقط، مع إمكانية اختيار السوق المناسب. تعتمد الأداة على تحليل الشموع اليابانية على مدى فترة زمنية محددة (مثل 3 ساعات). تُجمع بيانات الشموع (searchHours) لتحديد أهم شمعة بناءً على أنماط الشموع وحجم التداول خلال الإطار الزمني المحدد. ثم تُرسم مستويات الاختراق وأهداف جني الأرباح (TP)، بالإضافة إلى إشارات البيع والشراء، وإشعارات الاختراق، وخطوط الاتجاه الصعودي/الهبوطي بناءً على نقاط المحور.
يتم تشغيل الاداه حسب الفاصل المختار timeframe
الاستخدام العملي
1- الإعداد: اضبط السوق، والإطار الزمني، وعدد الساعات، والمنطقة الزمنية لتناسب احتياجات المتداول.
2- التداول: راقب إشارات (الشراء/البيع) ومستويات جني الأرباح لتحديد نقاط الدخول والخروج.
3- خطوط الاتجاه: استخدمها لفهم الاتجاه العام وتأكيد الإشارات.
1. الهدف: تحديد فرص التداول بناءً على اختراقات الأسعار
- فرص التداول: صُمم هذا المؤشر لمساعدة المتداولين على تحديد اللحظات التي يُحتمل فيها حدوث تحركات سعرية كبيرة، مما يسمح لهم بالدخول في صفقات شراء أو بيع بناءً على تغيرات السوق.
- اختراقات الأسعار: يُركز المؤشر على اللحظات التي تخترق فيها الأسعار مستويات رئيسية (مقاومة أو دعم). يحدث الاختراق عندما يتجاوز السعر مستوى مقاومة (صعودًا) أو يخترق مستوى دعم (هبوطًا)، مما يُشير إلى احتمال استمرار الحركة في نفس الاتجاه.
- ديناميكي: مستويات المقاومة والدعم ليست ثابتة؛ بل تُحسب بناءً على تحليل الشموع اليابانية على مدى فترة زمنية محددة، مما يجعلها مُكيفة مع ظروف السوق الحالية.
2. المستويات الديناميكية (مستويات المقاومة والدعم)
- مستويات المقاومة: تُمثل هذه الأسعار التي يصعب على السعر تجاوزها، وتُعرف هنا بأنها ارتفاع الشمعة الأكثر أهمية خلال الفترة المحددة.
- مستويات الدعم: تُمثل هذه الأسعار التي يصعب على السعر الانخفاض دونها، وتُعرف بأنها أدنى مستوى للشمعة الأكثر أهمية.
- ديناميكي: تُعاد حساب هذه المستويات مع كل فترة بحث جديدة (ساعات البحث)، مما يعني أنها تتغير بناءً على أحدث بيانات السوق، على عكس المستويات الثابتة التقليدية.
3. إضافة خط مركزي منقط
- خط المركز: يُرسم خط أفقي منقط عند نقطة المنتصف بين أعلى وأدنى شمعة ذات أهمية.
- الغرض:
- يوفر نقطة مرجعية بصرية لتحديد وضع السعر الحالي بالنسبة لمستويات الدعم والمقاومة.
- يساعد في تقييم ما إذا كان السعر يتحرك نحو اختراق (بالقرب من المقاومة) أو اختراق (بالقرب من الدعم).
- منقط: يُميزه النمط المنقط عن الخطوط العلوية والسفلية المتصلة، مما يُسهّل تمييزه بصريًا.
4. الاعتماد على تحليل الشموع اليابانية على مدى فترة زمنية محددة (ساعات البحث)
- تحليل الشموع اليابانية: يفحص المؤشر الشموع اليابانية لتحديد أيها الأكثر تأثيرًا على حركة السعر.
- الإطار الزمني (ساعات البحث):
- يُحدد المستخدم عدد الساعات (من 1 إلى 6) لتحليل الشموع، والذي يُحدد نطاق البيانات التي يعتمد عليها المؤشر.
- مثال: إذا كانت ساعات البحث = 3 والإطار الزمني = 30 دقيقة، فسيتم تحليل 6 شموع (3 ساعات ÷ 30 دقيقة).
- المرونة: يُمكن تعديل هذه الفترة لتناسب الأسواق المختلفة (مثل العملات المشفرة المتقلبة أو سوق الفوركس الأكثر استقرارًا).
5. تحديد الشمعة الأكثر أهمية بناءً على أنماط الشموع وحجم التداول
- الشمعة الأكثر أهمية: هي الشمعة التي يُعتقد أن لها التأثير الأكبر على حركة السعر بناءً على معايير محددة.
- أنماط الشموع:
- يتم تحليل الشموع باستخدام مكتبة أنماط الشموع (مثل شمعة الابتلاع، وشمعة المطرقة، وشمعة الدوجي).
- تُمنح أنماط الانعكاس (مثل نجمة الصباح، ونجم الشهاب) درجة أهمية عالية (100 نقطة) لأنها تُشير إلى تغيرات محتملة في الاتجاه.
- حجم التداول:
- يُقاس حجم تداول كل شمعة ويُقارن بالحد الأقصى والأدنى خلال الفترة.
- يُحسب الحجم كنسبة مئوية (0-100) ويُضاف إلى درجة النمط لتحديد الشمعة الأكثر أهمية.
- النتيجة: تُستخدم الشمعة ذات أعلى درجة (الأنماط + الحجم) لتحديد مستويات الدعم والمقاومة.
٦. الإطار الزمني
- الفاصل الزمني: يختار المستخدم إطارًا زمنيًا للشموع (١٥، ٣٠، أو ٦٠ دقيقة).
- الأهمية:
- يحدد عدد الشموع المُحللة خلال فترة ساعات البحث.
- يؤثر على دقة وسرعة الإشارات (الإطار الزمني الأقصر = إشارات أسرع ولكن أقل موثوقية؛ الإطار الزمني الأطول = إشارات أبطأ ولكن أكثر موثوقية).
- مثال: إذا كان الإطار الزمني ٦٠ دقيقة وساعات البحث ٣، فسيتم تحليل ٣ شموع فقط.
---
٧. رسم مستويات الاختراق وأهداف جني الأرباح (TP)
- مستويات الاختراق:
- الخط العلوي (المقاومة): يُرسم عند أعلى سعر للشمعة الأكثر أهمية ويُسمى "CALL".
- الخط السفلي (الدعم): يُرسم عند أدنى سعر للشمعة الأكثر أهمية ويُسمى "PUT".
- تمثل هذه الخطوط المستويات التي يُتوقع أن يؤدي فيها الاختراق إلى حركة سعرية قوية.
- أهداف جني الأرباح (TP):
- يتم حساب ما يصل إلى 8 مستويات جني أرباح صعودية (فوق الخط العلوي) وهبوطية (تحت الخط السفلي).
- يتم حسابها بناءً على نسبة مئوية (tpPercentage) تُضاف أو تُطرح من خطوط الأساس.
- مثال: إذا كانت نسبة جني الأرباح = 0.6% وكان أعلى سعر = 100، فإن هدف الربح الصعودي الأول = 100.6، وهدف الربح الثاني = 101.2، وهكذا.
- العلامات: تُرسم علامات لكل مستوى جني أرباح تشير إلى القيمة والمستوى (TP1، TP2، وهكذا).
---
8. إشارات الشراء والبيع
- إشارة الشراء (BUY):
- تُولّد عند اختراق السعر للخط العلوي (ta.crossover).
- تُرسم علامة "الشراء" مع إعادة رسم مستويات جني الأرباح.
- إشارة البيع (SELL):
- تُولّد عند اختراق السعر للخط السفلي (ta.crossunder). - يُرسم مؤشر "بيع" مع إعادة رسم مستويات جني الأرباح.
- الغرض: توفير إشارات واضحة للمتداول لاتخاذ قرارات دخول الصفقة.
==========================================================================
شكرًا لكم، أيها المتداولون الجدد.
لاستخدام مكتبة الاستيراد: n00btraders/Timezone/1
لاستخدام مكتبة الاستيراد: The_lurker/AllCandlestickPatternsLibrary/1
==============================================================================
إخلاء مسؤولية:
لا يُقصد بهذه المعلومات والمنشورات أن تكون، ولا تُشكل، نصائح أو توصيات مالية أو استثمارية أو تجارية أو أي نوع آخر من النصائح أو التوصيات المُقدمة من TradingView أو المُعتمدة منها.

Simple OHLC Custom Range Interactive█ OVERVIEW
This indicator show lines of OHLC which can be commonly used as support and resistance zones.
OHLC can be shown table with candlestick visual.
Color of candlestick depends on direction of bullish / bearish of the chosen candlestick.
█ INSPIRATION
Inspired by design, code and usage of CAGR . Basic usage of custom range / interactive, pretty much explained here . Credits to TradingView .
█ FEATURES
Table can positioned by any position and font size can be resized.
OHLC can be in full or simple name.
Lines can be extend either right, left, both or none.
█ HOW TO USE
Only 1 point is required.
Dont worry about magnet, point will attached depends on High or Low of the candle.
█ USAGE / TIPS EXAMPLES (Description explained in each image)

Aarika Heikin AshiHello Traders,
This indicator is probably based for the people who use HA candlestick chart and frequently have to switch between Japanese candlestick and HA candles. The worry is over with this simple indicator.
Now you can enjoy both candlesticks at the same time.
AHA allows you to have 2 EMAs (mostly used for crossovers). Default values set at 8/21 EMA which we may indicate a trend reversal.
We strongly recommend you back-test everything that you need before you start using AHA.
Thank you.

Infiten's Regressive Trend Channel An experiment using Pinescript's candle plotting feature. This indicator performs a linear regression on the lows, highs, and moving average, and plots them all in the form of a candlestick. If the close is below the prediction, the candlestick is red, if the close is above the regression, the candlestick is green. Effective and aesthetic way to analyze trends.

[blackcat] L3 Price Positioning IndexLevel: 3
Background
Are you tired of traditional Japanese candlesticks? Do you want to try a new type of candle master chart?
Function
L3 Price Positioning Index is totally brand-new candle chart invented by myself. This main chart can provide effective resistance and support levels, and you can see where the price is running at any time. There are 3 key circle lines. Green circle line is used to indicate oversold support or breakthrough support levels; yellow circle line indicates the midline position where prices may pause; and red circle line indicates overbought resistance or breakthrough resistance levels.
There are two types of candlestick charts.
The first type candles are mid-to-long-term trend candles, navy represents an uptrend and the length of the candle represents a change in intensity; maroon represents a downward trend and the length of the candle represents a change in intensity. This trend candle is the effective support and resistance level of the second type short-term swing candle.
The second type candles are short-term candles fluctuate around the first medium- and long-term trend candles. The second short-term candle is divided into five colors: green means pump; fuchsia means retracement in the ascending process; yellow means bullish reversal signal; red means dump; blue means price rebound in the descending process.
Key Signal
THREE KEY LINES:
htop --> red circle line, overbought resistance or pump breakout threshold
hmid --> yellow circle line, price pause zone, sideways may happen here
hbot --> green circle line, oversold support or dump breakout threshold
MID-LONG TERM CANDLES:
x22,x33 --> navy for up and maroon for down trend, they are important support or resistance for short term price movements
SHORT TERM CANDLES:
1. bearreboun --> rebounce in down trend candle with blue color
2. pump --> up trend pump candle with green color
3. bullreversal --> bullish reversal candle with yellow color
4. dump --> bearish dump candle with red color
5. bullretra --> retracement in up trend candle with fuchsia
Pros and Cons
Pros:
1. Long term trend identification by three lines for overbought, oversold and breakouts
2. Mid term trend support and resistance with navy and maroon candles
3. Short term price behaviors are classified into 5 types of candles in blue, green, yellow, red and fuchsia
Cons:
I invent this to solve traditional JP candlestick shortcomings. If you find anything on Cons, just feedback to me for improvements.
Remarks
Brand-new Candle System invented by myself
Readme
In real life, I am a prolific inventor. I have successfully applied for more than 60 international and regional patents in the past 12 years. But in the past two years or so, I have tried to transfer my creativity to the development of trading strategies. Tradingview is the ideal platform for me. I am selecting and contributing some of the hundreds of scripts to publish in Tradingview community. Welcome everyone to interact with me to discuss these interesting pine scripts.
The scripts posted are categorized into 5 levels according to my efforts or manhours put into these works.
Level 1 : interesting script snippets or distinctive improvement from classic indicators or strategy. Level 1 scripts can usually appear in more complex indicators as a function module or element.
Level 2 : composite indicator/strategy. By selecting or combining several independent or dependent functions or sub indicators in proper way, the composite script exhibits a resonance phenomenon which can filter out noise or fake trading signal to enhance trading confidence level.
Level 3 : comprehensive indicator/strategy. They are simple trading systems based on my strategies. They are commonly containing several or all of entry signal, close signal, stop loss, take profit, re-entry, risk management, and position sizing techniques. Even some interesting fundamental and mass psychological aspects are incorporated.
Level 4 : script snippets or functions that do not disclose source code. Interesting element that can reveal market laws and work as raw material for indicators and strategies. If you find Level 1~2 scripts are helpful, Level 4 is a private version that took me far more efforts to develop.
Level 5 : indicator/strategy that do not disclose source code. private version of Level 3 script with my accumulated script processing skills or a large number of custom functions. I had a private function library built in past two years. Level 5 scripts use many of them to achieve private trading strategy.

Moving Average of Upper and Lower Wicks with optional smoothingIn the book, The New Technical Trader by Tushar Chande and Stanley Kroll there is a part that talks about candlestick analysis and how the wicks play a role on how the price will behave. When wick lengths increase then there could be uncertainty. Weakening of support and resistance levels can also be seen by the size of the candlestick wicks or shadows. Shoutouts to Mango2Juice from Tradingview and the The Academy of Forex for helping me out in making this and providing the moving averages function.
When combined with other indicators or strategies, I find that this increases their accuracy when used correctly. For those that believe in price action, this might be worth a try. The book has only a brief section on candlestick wicks but it is one of the most interesting ideas I found. The book likes to include a simple moving average in its indicators with a certain length to provide a smoothing type of effect or a sort of extra indicator for the other to be above to give off quicker signals at the cost of accuracy. For this indicator it acts as a smoothing type effect which I put in because it is hard to see the slope and direction of where the moving averages of the wicks are going. The type of moving averages to use and the correct lengths are questionable and are not explained well in the book. If anyone can figure out a good use for this or know better settings or tips, please let me know.

Advanced Fully Reversed Candles with Reversed IchimokuThe "Advanced Fully Reversed Candles with Reversed Ichimoku" indicator is a sophisticated tool designed for traders who seek a unique perspective on market dynamics. This innovative indicator not only reverses the traditional candlestick chart but also inverts the Ichimoku Cloud components, providing a comprehensive view of the market's inverted behavior.
Key Features:
Reversed Candlestick Chart:
The indicator recalculates the OHLC (Open, High, Low, Close) prices by reversing them along the price axis. This means that what typically would be an upward movement is displayed as a downward movement, and vice versa. This reversal provides an alternative view that can help traders identify hidden patterns and potential reversal points that might not be obvious on a standard chart.
Reversed Ichimoku Cloud:
All components of the Ichimoku Cloud indicator are recalculated based on the reversed price data. This includes:
Tenkan-sen (Conversion Line): Reversed based on the highest and lowest prices over the specified period.
Kijun-sen (Base Line): Reversed in a similar manner to the Tenkan-sen, providing a medium-term perspective on price trends.
Senkou Span A (Leading Span A): Reversed to form one boundary of the Kumo (cloud), offering insight into future support and resistance levels.
Senkou Span B (Leading Span B): Reversed to form the other boundary of the Kumo, complementing Senkou Span A.
Chikou Span (Lagging Span): Reversed and plotted backward for additional confirmation of trend direction and strength.
Dynamic Price Range Calculation:
The indicator dynamically calculates the maximum and minimum prices over the last 500 bars (or the available range if fewer bars are present). This ensures that the reversal is always based on the most relevant data, providing accurate and up-to-date visualizations.
Visual Enhancements:
The reversed candlesticks are color-coded for easy interpretation: green for upward movements and red for downward movements, based on the reversed data.
The Ichimoku Cloud is filled with semi-transparent colors to clearly distinguish between bullish and bearish conditions even in its reversed state.
Debugging Aids:
For transparency and accuracy, the indicator plots the maximum and minimum price lines used for the reversal calculations. This allows users to verify the internal workings of the indicator and ensure the reversal logic is correctly applied.
Usage:
This indicator is ideal for advanced traders and analysts who want to explore market behavior from an unconventional angle. By reversing both the candlestick chart and the Ichimoku Cloud, it provides a unique perspective that can uncover new trading opportunities and enhance market analysis.
Customization:
Users can customize the periods for the Tenkan-sen, Kijun-sen, and Senkou Span B, as well as the displacement for the Ichimoku Cloud. This flexibility allows traders to adapt the indicator to their specific trading strategies and timeframes.
Conclusion:
The "Advanced Fully Reversed Candles with Reversed Ichimoku" indicator is a powerful tool that transforms traditional market analysis. By inverting both price movements and key technical indicators, it opens up a new dimension of trading insights, helping traders to see the market in a completely different light.
Parameters:
Tenkan-sen period (default: 9)
Kijun-sen period (default: 26)
Senkou Span B period (default: 52)
Displacement (default: 26)
How to Apply:
Add the script to your TradingView account via the Pine Editor.
Customize the parameters according to your trading strategy.
Analyze the reversed candlestick chart and Ichimoku Cloud to gain unique insights into market trends and potential reversal points.

Strongest Supports And ResistancesDraws the best support and resistance lines. How it works:
1) Tries every possible line through lows, highs, opens, closes
2) Finds the total hit counts given the confidence interval as input to the candlesticks
3) Calculates the strength of every line according to hit count, total volumes on hits, and timestamps
4) Eliminates similar lines, confidence interval is set as input
5) Selects the strongest 20(changable as an input) lines and draws them on the graph.
Makes your work way easier!!!
Feel free to adjust the parameters for your own style!
Cheers!!

CSPDMost Advanced & Accurate CandleStick Pattern Detector
Looking All Over of All Markets for All Important Powerful Reversal | Corrective Patterns (25 type)
Filtering the Results with Optional Features like Oscillator, Bollinger Bands, Volume Confirmation, Prior and Following Candles Confirmation which are Fully Customizable.
With this you can detect:
Hammer | Shooting star
Inverted Hammer | Hanging
Long legged Doji | Dragonfly Doji | Gravestone Doji
Bullish tweezers | Bearish tweezers
Bullish inside bar | Bearish inside bar
Bullish three line strike | Bearish three line strike
Bullish engulfing | Bearish engulfing
Piercing line | Dark cloud cover
Bullish abandoned baby | Bearish abandoned baby
Morning star | Evening star
Three white soldiers | Three black crows
*Bullish kayo | *Bearish kayo
Features:
Prior and Following candles Confirmation
You can set prior and following candle as basic prerequisites for marking candles as pattern to make sure you are at the top or bottom of the trend.
Volume confirmation
You can active volume increasing confirmation for some of pattern with adjustable increase % relative to prior candle | candles.
Oscillator Confirmation
Active oscillator confirmation. Select your approved oscillator from list (Stochastic, RSI, StochRSI, MFI, StochMFI) then enter desired value for marking candles as bullish | bearish pattern.
Bollinger Bands Confirmation
Active BB confirmation. Configure your Bollinger Bands. Now only see the patterns which reached or crossed from Bands. Also you can enable BB clod to have your BB indicator at the same time.
Adjustable Flexibility and Precision
You can set tolerance% for Osc and BB Confirmation - each one separately - for more control.
Self-adaptability
The properties of markets change over time, for example the amplitude of fluctuations and the intensity of movements. The script is designed in such a way that you can examine the price history as a benchmark for changes in market properties to adopt determinants. Also you can control those manually.
Self-regulatory
The user has the ability to change input factors depending on their point of view.
Behind the pattern recognition algorithms, there are relationships and similarities in their appearance that cause them to be influenced by each other. Simultaneously with changing the determining factors of each pattern by you, script automatically adjusts other details in accordance with your changes.
Alerts
You can set for type of pattern or each one of pattern have been detected.
Fully Costumizable
All of these options can be change and adjust.
Note 1.
The patterns are based on extensive study of reference and famous sources and the experience of me and my friends in trading and analysis with price action methods.
Note 2.
Due to the Pine limitations in the number of outputs | plots for each script, our attempt has been made to select the best and most important patterns.
Note 3.
So far, many scripts have been written in this field, but our experience with all of them and even the build in version was not satisfactory, and this was the initial motivation for making the script.
We strive to improve progress and elimination of shortcomings and we will continue to make this better.
Note 4.
Through personal experience and based on the principles of market and candlestick psychology, we discovered a new type of pattern and named it as Kayo.
kayo is a two candle pattern which formed when:
1.We have a pivot point with prior candles as left bars and following candles as right bar. Pivot candle called as second candle.
2.In a bullish kayo, first candle must closed descending and second candle must closed as ascending. For bearish kayo vise versa.
3.In a bullish kayo, second candle's lower wick must be longer then upper wick.
4. A pattern marked as kayo when its conditions do not correspond to any of the other patterns(include the confirmation that user added), ie it has the last naming priority over the other patterns.
Note 5.
When you active confirmation options for patterns like hammer, engulf and etc which they conditions are like kayo in some extent, if they can't pass the confirmation steps, they can be marked as kayo pattern.
Note 6.
If you active volume confirmation for Three white soldiers | Three black crows, the confirmation get passed if the volume of forth or third candle increased as value as entered relative to volume EMA3 of 3 candles.
Note 7.
In a bullish pattern all highs of following candles MUST be higher than prior highs and all lows of following candles MUST be higher than prior lows. For bearish patterns vise versa.
This type of confirmation depends on High and Low NOT close!
Gift to price action lovers!
Support us with your like and comments. let us know your experience, points and idea to make this better together.

Bearish CandlesPlots 6 different kinds of bearish candlesticks. I started with HPotter's previous work, added 4 other types of bearish Candlesticks and bunched them in one indicator.
ORB Heikin Ashi SPY 5min Correlation StrategyOverview:
The ORB (Opening Range Breakout) strategy combined with Heikin Ashi candles and Relative Volume (RVOL) indicator aims to capitalize on significant price movements that occur shortly after the market opens. This strategy identifies breakouts above or below the opening range, using Heikin Ashi candles for smoother price visualization and RVOL to gauge the strength of the breakout.
Components:
Opening Range Breakout (ORB): The strategy starts by defining the opening range, typically the first few minutes of the trading session. It then identifies breakouts above the high or below the low of this range as potential entry points.
Heikin Ashi Candles: Heikin Ashi candles are used to provide a smoother representation of price movements compared to traditional candlesticks. By averaging open, close, high, and low prices of the previous candle, Heikin Ashi candles reduce noise and highlight trends more effectively.
Relative Volume (RVOL): RVOL compares the current volume of a stock to its average volume over a specified period. It helps traders identify abnormal trading activity, which can signal potential price movements.
Candle for correlation : In this case we are using SPY candles. It can also use different asset
Strategy Execution:
Initialization: The strategy initializes by setting up variables and parameters, including the ORB period, session timings, and Heikin Ashi candle settings.
ORB Calculation: It calculates the opening range by identifying the high and low prices during the specified session time. These values serve as the initial reference points for potential breakouts. For this we are looking for the first 30 min of the US opening session.
After that we are going to use the next 2 hours to check for breakout opportunities.
Heikin Ashi Transformation: Optionally, the strategy transforms traditional candlestick data into Heikin Ashi format for smoother visualization and trend identification.
Breakout Identification: It continuously monitors price movements within the session and checks if the current high breaches the ORB high or if the current low breaches the ORB low. These events trigger potential long or short entry signals, respectively.
RVOL Analysis: Simultaneously, the strategy evaluates the relative volume of the asset to gauge the strength of the breakout. A surge in volume accompanying the breakout confirms the validity of the signal. In this case we are looking for at least a 1 value of the division between currentVolume and pastVolume
Entry and Exit Conditions: When a breakout occurs and is confirmed by RVOL and is within our session time, the strategy enters a long or short position accordingly. It does not have a stop loss or a takie profit level, instead it will always exit at the end of the trading session, 5 minutes before
Position Sizing and Commissions: For the purpose of this backtest, the strategy allocated 10% of the capital for each trade and assumes a trading commission of 0.01$ per share ( twice the IBKR broker values)
Session End: At the end of the trading session, the strategy closes all open positions to avoid overnight exposure.
Conclusion:
The combination of ORB breakout strategy, Heikin Ashi candles, and RVOL provides traders with a robust framework for identifying and capitalizing on early trends in the market. By leveraging these technical indicators together, traders can make more informed decisions and improve the overall performance of their trading strategies. However, like any trading strategy, it's essential to backtest thoroughly and adapt the strategy to different market conditions to ensure its effectiveness over time.

Stock Tech Bot One ViewTechnical indicators are not limited. Hence, here is another indicator with the combination of OBV, RSI, and MACD along with support, and resistance that follows the price while honoring the moving average of 200, 90 & 50.
The default lookback period of this indicator is 21 though it is changeable as per the user's desire.
The highest high and lowest low for the last 21 days lookback period proven to be the perfect Support & Resistance as the price of particular stock values are decided by market psychology. The support and resistance lines are very important to understand the market psychology which is very well proven with price action patterns and the lines are drawn based on,
Lower Extreme = 0.1 (Changeable)
Maximum Range = 21 days highest high - 21 days lowest low.
Support Line = 21 days lowest low + (Maximum Range * Lower Extreme)
Resistance Line = 21 days highest high - (Maximum Range * Lower Extreme)
RSI - Relative strength indicator is very famous to find the market momentum within the range of 0 - 100. Though the lookback period is changeable, the 14 days lookback period is the perfect match as the momentum of market movement for the last 3 weeks will always assist to identify the market regime. Here the momentum is just to highlight the indication (green up arrow under the candle for long and red down arrow above the candle for short) of market movement though it is not very important to consider if the price of the stock respect the support & resistance lines along with volume indicator (* = violet color).
OBV - Momentum:
The on-balance volume is always going indicator on any kind of tickers, which helps to identify the buying interest. Now, applying momentum on OBV with the positive movement for at least two consecutive days gives perfect confirmation for entry. A combination of the price along with this momentum(OBV) in the chart will help us to know the whipsaw in the price.
The Symbol "*" on top of each bar shows the market interest in that particular stock. If your ticker is fundamentally strong then you can see this "*" even when the market falls.
MACD:
One of the favorites and simple indicators widely used, where the thump of the rule is not to change the length even if it is allowed. It's OK to believe blindly in certain indicator and consider it while trading. That's why the indicator changes the bar color by following the MACD histogram.
Volume:
It may be the OBV works based on the open price and close price along with volume movement, it is wise to have the volume that is plotted along with price movement that should help you to decide whether the market is greedy or fearful.
The symbol "-" on top of each bar tells you a lot and don't ignore it.
Moving Average:
Moving average is a very good trend indicator as everyone considers seeing along with the price in the chart which is not omitted while we gauge the price movement alone with volume in this indicator. The 200, 90 & 50 MA's are everyone's favorite, and the same is plotted on the chart.
As explained above, the combination of all four indicators with price movement will give us very good confidence to take entry.
Candlestick Pattern:
You should admire the techniques of the candlestick pattern as you navigate the chart from right to left. Though there are a lot of patterns that exist, it is easy to enable and disable to view the signal as the label.
Further, last but not least, the exit always depends on individual conviction and how often the individual watch the price movement, if your conviction is strong then follow the down arrow red indication. If not, then exit with a trailing stop that indicates the bar with orange color.
Happy investing
Note: It is just a combination of multiple indicators and patterns to get one holistic view. So, the credit goes to all wise developers who publically published.

Trendy Bar Trend Color LiteLite version of the original Trendy Bar Trend Color
This will only color the candlestick body of your chart
Can be used with solid, hollow, renko, or any other chart type
Custom coloring for Highs, Lows, and consolidation is removed

Cumulative Delta VolumeHello Traders,
This is Cumulative Delta Volume script. Delta refers to the difference between buying and selling volume at each price level. Cumulative Delta builds upon this concept by recording a cumulative tally of these differences in buying vs selling volume. The Cumulative Delta indicator plots as candlesticks or line. One of the main uses of Cumulative Delta is to confirm or deny market trends. you may need to search it for yourself ;)
You have option to see it as Candles or a Line. also there are options to show 2 SMAs and 2 EMAs with different Lengths, you can set the lengths as you wish.
By default it shows CDV as Heikin Ashi Candles, it can also show it as normal candles:
It can show CDV as a line:
Also you may need to check divergence:
Enjoy!

Options Series - NonOverlay_Technical
⭐ 1. Purpose:
The script is designed to show technical indicators in a non-overlay form using candlestick representations. It combines multiple popular technical analysis tools to gauge the market's bullish or bearish conditions.
⭐ 2. Indicators:
The script uses several indicators across different timeframes: Exponential Moving Averages (EMA) for 5, 20, 50 periods. Simple Moving Average (SMA) for 200 periods. RSI (Relative Strength Index) for momentum. VWAP (Volume Weighted Average Price) for average price evaluation. PSAR (Parabolic SAR) for trend direction. Daily and multi-day (2-day and 3-day) data for broader market context.
⭐ 3. Candlestick Representation:
The script uses color-coded candlesticks to visually represent various indicators and their bullish/bearish states: Green candlesticks for bullish conditions. Red candlesticks for bearish conditions. Neutral/transparent for non-significant conditions.
⭐ 4. Important Conditions:
It calculates bullish and bearish conditions for each indicator: MA20: When the price is above or below the 20-period EMA. RSI: When RSI is above or below 50. VWAP: When the price is above or below the VWAP. PSAR: When the price is above or below the PSAR. 2-day and 3-day Moving Averages: Evaluating the broader trend.
⭐ 5. Bullish vs. Bearish Calculation:
The script sums up bullish and bearish signals to determine the overall market condition: Current_logical_bull: Counts the number of bullish indicators. Current_logical_bear: Counts the number of bearish indicators. The script compares these values to conclude whether the market is more bullish or bearish.
⭐ 6. Visual Plotting:
The script uses plotcandle to display the non-overlay signals at different levels for each condition, stacked vertically from MA20 to PSAR. Additionally, a master candle combines all indicators to show an overall market trend.
⭐ 7. Neon Effect on MA20:
It adds a neon-like effect to the MA20 line, making it visually prominent: A standard plot line with the base color. Two additional neon layers with increasing transparency to enhance the effect.
⭐ 8. Daily Timeframes and Lookahead:
The script fetches daily data using the lookahead feature to get a broader view of the market trend. It tracks the previous day’s and two days' data for comparison.
⭐ 9. Labels and Customization:
The script dynamically adds labels to the chart for the different plotted indicators at the last bar, making it easier to identify which indicator is being represented.
🚀 Conclusion:
The script combines multiple technical indicators, such as EMA, RSI, VWAP, PSAR, and multi-day moving averages, to visually assess bullish and bearish market conditions. It uses color-coded candlesticks to represent each indicator and sums up the signals to determine the overall trend.

Function To Candles - Another way to see indicatorsIntroduction
There are different and better way's to see price data, a candlestick chart is one of the best way to see the price since you have access to the open/high/low/close information, this is really efficient and can allow for naked non parametric trading strategies (candlesticks patterns) . But what about making candles out of indicators ? There are tons of studies about candlesticks patterns in price data but none (?) about candlestick patterns using indicator data, therefore i made this script in order to show candles from various indicators, i also made an heikin-ashi mode.
Rsi To Candles
All the indicators are use the open/high/low/close price as input in order to return candles. length control the indicator period.
Stochastic To Candles
The stochastic oscillator is restrained in a range of 0/100, therefore when equal to 0 or 100 the candles can be flat.
Rate Of Change To Candles
The rate of change don't distort price as heavily as other indicators since its based on differencing.
Center Of Gravity To Candles
The center of gravity (cog) is defined from tradingview as "an indicator based on statistics and the Fibonacci golden ratio", its not an indicator i'am familiar with and i don't know if its the same proposed by Elhers. The candles are smooth, high length can flatten the candles heavily making them hard to see.
Correlation Oscillator
In a range of -1/1 this indicator is quite smooth and can also flatten candles.
Patterns And Heikin-Ashi
There are tons of patterns that can be generated from candlesticks, they can be applied to this indicator as well.
The indicator can show an heikin-ashi mode, heikin-ashi candlestick use averaging to plot candles, this is why they appear smoother, some signals generated from heikin-ashi candles are :
Bullish body with no lower shadows = Strong Uptrend
Bearish body with no higher shadows = Strong Downtrend
High range and small body = Indecision/Risk of reversal
Conclusion
I made an indicator able to draw candles from other indicators, those candles contain various information that can generate decision from patterns. I hope you find a use to it, if its the case share your findings with me, maybe that you will even be able find a new candlestick pattern :)
Thanks for reading !

Normalized Candlesticks (Stochastic Candles)The original script was posted on ProRealCode by user Nicolas.
This indicator is a normalized price representation made with candlesticks. The dynamic scale between 0 and 100% is calculated upon the last X periods (50 periods in the code, you can change it at will). It can be used to detect price exhaustion in a trend of continuation if the candlesticks remains above the 50% level.
Another utility is the use of the different levels that could be changed to Fibonacci levels for examples (23.6% 38.2% etc.) and detect rebounds of breakout of these levels.

Global Liquidity Index (Candles)The Global Liquidity Index (Candles) provides a comprehensive overview of major central bank balance sheets worldwide, presenting values converted to USD for consistency and comparability, following relevant forex rates. This indicator, based on the code developed by user ingeforberg , incorporates essential US accounts including the Treasury General Account (TGA) and Reverse Repurchase Agreements (RRP), subtracted from the Federal Reserve's balance sheet to offer a nuanced perspective on US liquidity. Users can tailor their analysis by selectively enabling or disabling specific central banks and special accounts according to their preferences. The index exclusively includes central banks abstaining from currency pegging and with reliable data accessible since late 2007, ensuring a robust aggregated liquidity model.
The calculation of the Global Liquidity Index involves subtracting the Treasury General Account (TGA) and Reverse Repurchase Agreements (RRP) from the Federal Reserve System (FED) and adding the balance sheets of major central banks worldwide: the European Central Bank (ECB), the People's Bank of China (PBC), the Bank of Japan (BOJ), the Bank of England (BOE), the Bank of Canada (BOC), the Reserve Bank of Australia (RBA), the Reserve Bank of India (RBI), the Swiss National Bank (SNB), the Central Bank of the Russian Federation (CBR), the Central Bank of Brazil (BCB), the Bank of Korea (BOK), the Reserve Bank of New Zealand (RBNZ), Sweden's Central Bank (Riksbank), and the Central Bank of Malaysia (BNM).
This tool proves invaluable for individuals seeking a consolidated perspective on global liquidity to interpret macroeconomic trends. Analyzing these balance sheets enables users to discern policy trajectories and assess the global economic landscape, providing insights into asset pricing and assisting investors in making well-informed capital allocation decisions. Historically, assets perceived as riskier, such as small caps and cryptocurrencies, have tended to perform favorably during periods of escalating liquidity. Thus, investors may exercise caution regarding additional risk exposure unless a sustained upward trend in global liquidity is evident.
Main differences between the original and updated indicators:
The "Global Liquidity Index (Candles)" script, compared to the original "Global Liquidity Index" script, offers a more detailed and visually rich representation of liquidity data.
"Global Liquidity Index (Candles)" employs candlestick visualization to represent liquidity data. Each candlestick encapsulates open, high, low, and close prices over a given period. This format provides granular insights into liquidity fluctuations, facilitating a more nuanced analysis.
By using candlesticks, the script offers traders detailed information about liquidity dynamics. They can analyze the patterns formed by candlesticks to discern trends, reversals, and market sentiment shifts, aiding in making informed trading decisions.

Logical Trading Indicator V.1Features of the Logical Trading Indicator V.1
ATR-Based Trailing Stop Loss
The Logical Trading Indicator V.1 utilizes the Average True Range (ATR) to implement a dynamic trailing stop loss. You can customize the sensitivity of your alerts by adjusting the ATR Multiple and ATR Period settings.
Higher ATR Multiple values create wider stops, while lower values result in tighter stops. This feature ensures that your trades are protected against adverse price movements. For best practice, use higher values on higher timeframes and lower values on lower term timeframes.
Bollinger Bands
The Logical Trading Indicator V.1 includes Bollinger Bands, which can be customized to use either a Simple Moving Average (SMA) or an Exponential Moving Average (EMA) as the basis.
You can adjust the length and standard deviation multiplier of the Bollinger Bands to fine-tune your strategy. The color of the basis line changes to green when price is above and red when price is below the line to represent the trend.
The bands show a range vs a single band that also represents when the price is in overbought and oversold ranges similar to an RSI. These bands also control the take profit signals.
You also have the ability to change the band colors as well as toggle them off, which only affects the view, they are still active which will still fire the take profit signals.
Momentum Indicator
Our indicator offers a momentum filter option that highlights market momentum directly on the candlesticks, identifying periods of bullish, bearish, or consolidation phases. You can enable or disable this filter as needed, providing valuable insights into market conditions.
By default, you will see the candlestick colors represent the momentum direction as green or red, and consolidation periods as white, but the filter on the BUY and SELL signals is not active. The view options and filter can be toggled on and off in the settings.
Buy and Sell Signals
The Logical Trading Indicator V.1 generates buy and sell signals based on a combination of ATR-based filtering, Bollinger Band basis crossover, and optional momentum conditions if selected in the settings. These signals help you make informed decisions about when to enter or exit a trade. You can also enable a consolidation filter to stay out of trades during tight ranges.
Basically a BUY signal fires when the price closes above the basis line, and the price meets or exceeds the ATR multiple from the previous candle length, which is also editable in the settings.
If the momentum filter is engaged, it will not fire BUY signals when in consolidation periods. It works just the opposite for SELL signals.
Take Profit Signals
We've integrated a Take Profit feature that helps you identify points to exit your trades with profits. The indicator marks Long Take Profit when prices close below the upper zone line of the Bollinger Bands after the previous candle closes inside the band, suggesting an optimal point to exit a long trade or consider a short position.
Conversely, Short Take Profit signals appear when prices close above the lower zone after the previous candle closes inside of it, indicating the right time to exit a short trade or contemplate a long position.
Alerts for Informed Trading
The Logical Trading Indicator V.1 comes equipped with alert conditions for buy signals, sell signals, take profit points, and more. Receive real-time notifications to your preferred devices or platforms to stay updated on market movements and trading opportunities.

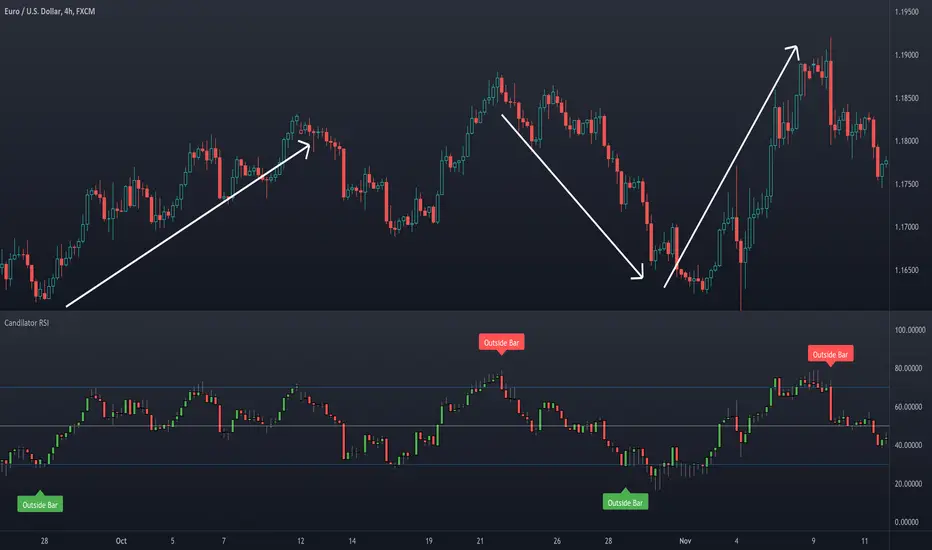
Candilator RSI [AstrideUnicorn]OVERVIEW
The name Candilator comes from blending the words "candlestick" and "oscillator". And as the name suggests, this indicator is a good old RSI plotted as a candlestick chart. To produce a candlestick chart, Candilator RSI calculates four RSI's based on the open, high, low, and close time series. It also has a candlestick patterns detection feature.
HOW TO USE
You can use Candilator RSI as a normal RSI to analyze momentum, detect overbought and oversold markets, and find the oscillator's divergences with the price. You can also get creative and apply all sorts of technical analysis to the RSI candlestick chart, including candlestick patterns analysis.
Candilator RSI can automatically scan the price for some candlestick patterns in the overbought and oversold zones. This feature can help detect price reversals early.
SETTINGS
The indicator settings are divided into two groups: Main Settings and Pattern Detection. In the Main Settings, you can find standard RSI settings. In the Pattern Detection part, you can turn on and off the automatic search for a particular candlestick pattern.
Vervoort Heiken Ashi Candlestick OscillatorHeiken-Ashi Candlestick Oscillator (HACO), by Sylvian Vervoort, is a digital oscillator version of the colored candlesticks.
Explanation from Vervoort:
"HACO is not meant to be an automatic trading system, so when there is a buy or sell signal from HACO, make sure it is confirmed by other TA techniques. HACO will certainly aid in signaling buy/sell opportunities and help you hold on to a trade, making it more profitable. The behavior of HACO is closely related to the level and speed of price change. It can be used on charts of any time frame ranging from intraday to monthly."
HACO has 2 configurable length parameters - "UP TEMA length" and "Down TEMA length". Vervoort suggests having them the same value.
I have also added an option to color the bars (overlay mode).
More info:
Trading with the Heiken-Ashi Candlestick Oscillator - Sylvian Vervoort
List of my other indicators:
- GDoc: docs.google.com
- Chart:

CM Heikin-Ashi Candlesticks_V1Heikin-Ashi Paint Bars.
Paints Candlesticks or OHLC Bars The Exact Same as Traditional Heikin-Ashi Bars
