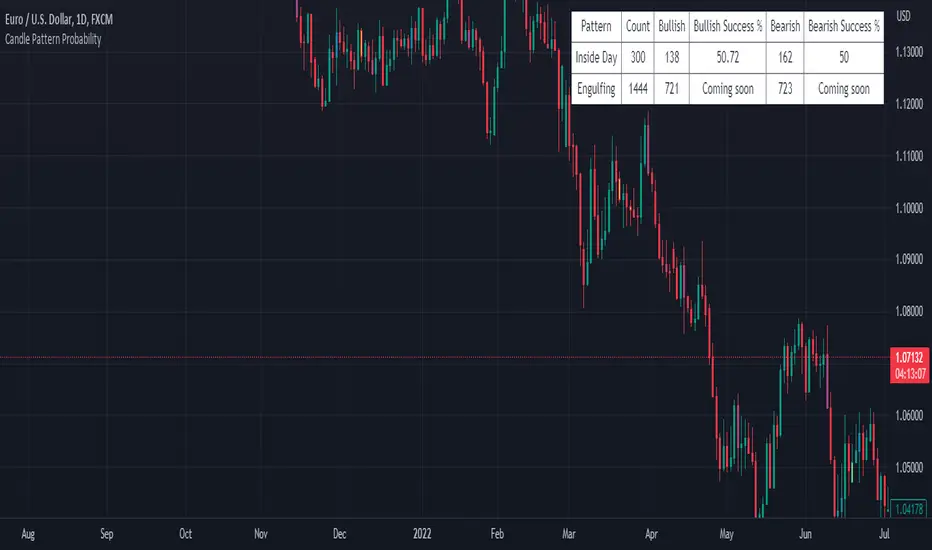
Candle Pattern ProbabilityThe "Candle Pattern Probability" indicator is a technical analysis tool designed specifically for traders who want to assess the probability of success for different candlestick patterns in the financial markets.
Japanese candlesticks, also known as candlesticks, provide valuable information about price action within a specific time period. These candlestick patterns can help identify potential trend reversals as well as signal entry and exit points in the market.
The "Candle Pattern Probability" indicator uses a data-driven approach to calculate the likelihood of a specific candlestick pattern resulting in a successful price movement. It operates on the premise that certain candlestick patterns tend to repeat and have a higher probability of leading to predictable market movements.
The indicator analyzes a wide variety of candlestick patterns such as the hammer, shooting star, bullish/bearish engulfing, doji, hanging man, among others. It employs specific statistics and algorithms to evaluate the frequency and effectiveness of these patterns in the past, thereby estimating the probability of their repetition in the future.
The indicator's output is visually presented as a percentage value or a color scale, facilitating interpretation by traders. The higher the percentage value or the more intensified the color, the greater the estimated probability of success for the analyzed candlestick pattern.
It is important to note that the "Candle Pattern Probability" indicator is a supplementary tool and should not be considered as a definitive signal for trading decisions. It is recommended to use it in conjunction with other technical indicators, fundamental analysis, and a sound understanding of the market before making trades.
Please remember that the analysis of candlestick patterns and the use of this indicator require practice, experience, and trading knowledge. It is always advisable to conduct additional testing and validation before basing decisions solely on the results provided by this indicator.
在腳本中搜尋"Candlestick"
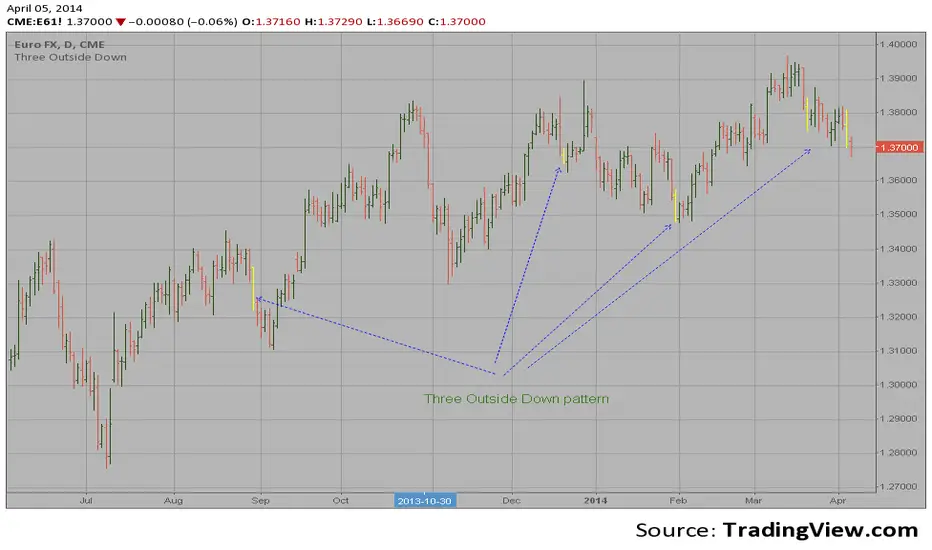
Three Outside Down automatic finding scriptHi
Let me introduce my Three Outside Down automatic finding script.
This is a three candlestick bearish reversal pattern consisting of a bearish
engulfing pattern formed by the first two candlesticks then followed by a down
candlestick with a lower close than the prior candlestick.
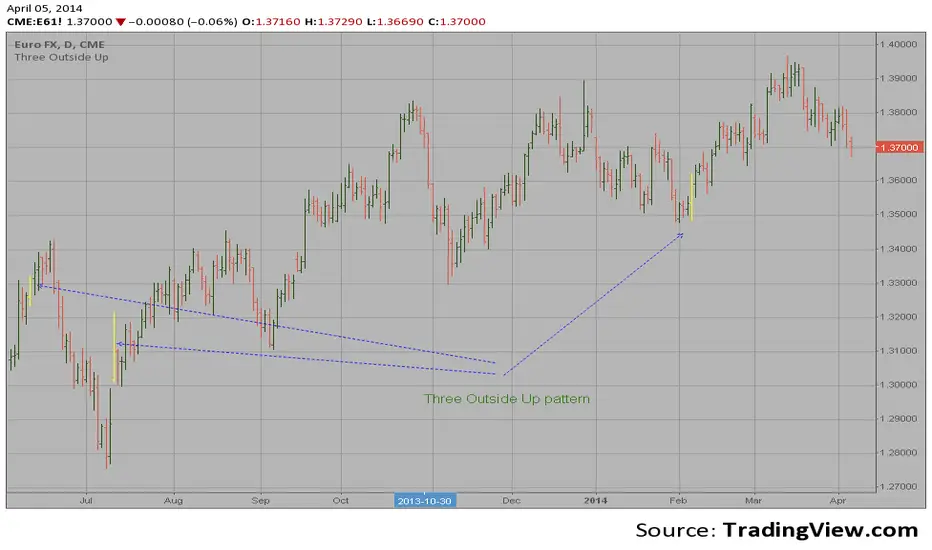
Three Outside Up automatic finding scriptHi
Let me introduce my Three Outside Up automatic finding script.
This is a three candlestick bullish reversal pattern consisting of a bullish
engulfing pattern formed by the first two candlesticks then followed by an up
candlestick with a higher close than the prior candlestick.
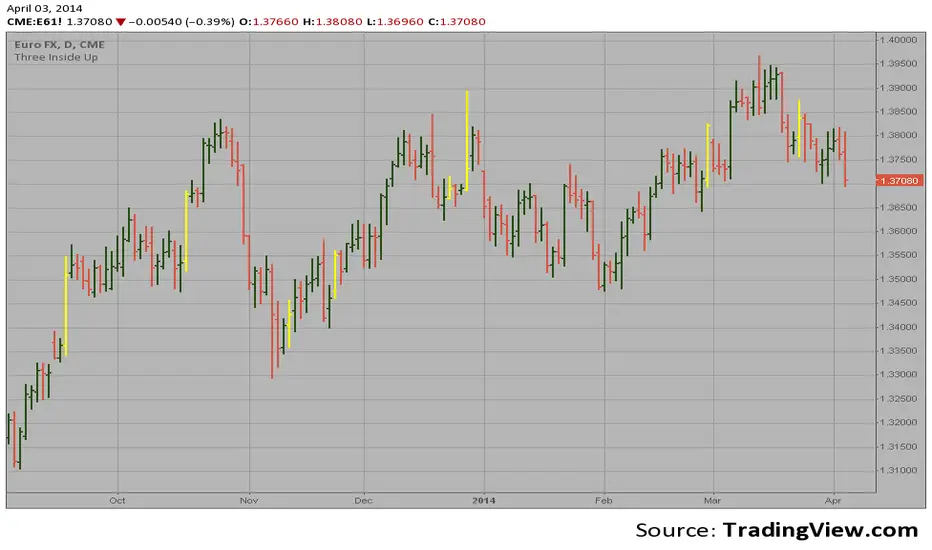
Three Inside Down automatic finding scriptHi
Let me introduce my Three Inside Down automatic finding script.
This is a three candlestick bearish reversal pattern consisting of a bearish
harami pattern formed by the first 2 candlesticks then followed by down
candlestick with a lower close than the prior candlestick.
This pattern marked as yellow.

Three Inside Up automatic finding scriptHi
Let me introduce my Three Inside Up automatic finding script.
This is a three candlestick bullish reversal pattern consisting of a
bullish harami pattern formed by the first 2 candlesticks then followed
by up candlestick with a higher close than the prior candlestick.
This pattern marked as yellow.
FVG - MTF Confirmed Tracker [JP/EN]Indicator Description: FVG MTF Concluded Bar Tracker
This indicator is a highly functional tool that identifies FVG for the currently displayed bar or a higher-level bar (MTF) and determines its "resolution" when the candlestick is resolved.
Its most notable feature is that it only displays history (gray) on the chart and sends an alert when a "significant level that has been continuously observed for a certain period of time" is resolved.
1. Timeframe Settings
Base Timeframe: Select the timeframe on which to detect FVG. Select "Same as chart" to use the current bar, or select another bar (1-hour, 4-hour, etc.) to project the FVG of the higher-level bar onto the current chart.
2. Active FVG Settings
Sets the currently active support/resistance area that has not yet been filled by price.
Show Bull/Bear: Individually toggles whether to display bull (buy) and bear (sell) FVG.
Color: Specifies the color of the box for the unresolved state.
Extend Right (Active): When enabled, the box will continue to extend indefinitely toward the right edge of the chart until the FVG is resolved.
Max Active FVG: This sets the maximum number of unresolved boxes to display on the chart. When a new FVG is detected, the oldest unresolved box will be automatically deleted if it exceeds this limit, saving resources.
3. Filled FVG Settings (Resolved, Grayed Out, Determination Logic)
These are very important settings for displaying history when the price fills an FVG.
Show Filled: Select whether to leave resolved FVGs grayed out (default color) as "history."
Color: Specifies the color of boxes that have been resolved (Filled).
Extend Right (Filled): When this is turned off, the box extension will stop at the candlestick where the resolution is confirmed, making the resolution point clear.
Max Filled FVG: This sets the maximum number of grayed out boxes to display as history. When the limit is reached, the oldest history will be deleted.
Min Bars to Keep & Alert (Important): This is the threshold for the number of bars elapsed between the occurrence of an FVG and its resolution.
If the threshold is not met: The event is considered a temporary reaction, and no alert will be sounded. The event will also be deleted without being recorded in the history (gray).
If the threshold is met or exceeded: The event is considered a significant market event, and the box will turn gray and an alert will be sent.
4. Alert Settings (Alert Notification Logic)
Alerts are executed in perfect sync with the "resolution of significant levels (graying out)."
Alert when Bull / Bear turns Gray: A notification will be sent the moment a bullish or bearish FVG is resolved after meeting the threshold and turning gray.
Execution Timing: A notification will only be sent when the candlestick is confirmed. It will not be triggered if the candlestick is only momentarily touched by the wick midway through the candlestick. This allows you to know for sure that the event was resolved at the time of closing.
インジケーター解説:FVG MTF 確定足トラッカー
このインジケーターは、現在表示している足、または上位足(MTF)のFVGを特定し、その「解消」をローソク足の確定時に判定する高機能ツールです。
最大の特徴は、**「一定期間意識され続けた重要な水準」**が解消された時のみ、チャートに履歴(グレー)を残し、アラートを通知する設計にあります。
1. Timeframe Settings(時間足設定)
Base Timeframe / 基準にする時間足: FVGを検知する時間足を選択します。「Same as chart(チャートと同じ)」を選べば現在の足、それ以外(1時間足、4時間足など)を選べば上位足のFVGを現在のチャートに投影します。
2. Active FVG Settings(未解消時の設定ロジック)
まだ価格に埋められていない、現在有効なサポート・レジスタンス領域の設定です。
Show Bull / Bear: ブル(買い)およびベア(売り)のFVGを表示するかどうかを個別に切り替えます。
Color: 未解消状態のボックスの色を指定します。
Extend Right (Active): 有効にすると、FVGが解消されるまでボックスをチャートの右端に向かって無制限に延長し続けます。
Max Active FVG: チャート上に表示する未解消ボックスの最大数です。新しいFVGが検知された際、この上限を超えていると最も古い未解消ボックスが自動的に削除され、リソースを節約します。
3. Filled FVG Settings(解消済み・グレー化・判定本数ロジック)
価格がFVGを埋めた際の、履歴表示に関する非常に重要な設定項目です。
Show Filled: 解消されたFVGを「履歴」としてグレー表示(デフォルト色)で残すかどうかを選択します。
Color: 解消済み(Filled)状態になったボックスの色を指定します。
Extend Right (Filled): これをOFFにすると、解消が確定したローソク足の位置でボックスの延長が止まり、解消地点が明確になります。
Max Filled FVG: 履歴として残すグレーボックスの最大数です。上限に達すると、古い履歴から順に削除されます。
Min Bars to Keep & Alert (重要): FVGが発生してから解消されるまでの「経過本数」の閾値です。
判定本数に満たない場合: 一時的な反応とみなし、アラートを鳴らさず、履歴(グレー)にも残さず削除します。
判定本数以上の場合: 市場で十分に意識された「重要な水準」とみなし、ボックスをグレーに変更し、アラートを通知します。
4. Alert Settings(アラート通知ロジック)
アラートは「重要水準の解消(グレー化)」と完全に同期して実行されます。
Alert when Bull / Bear turns Grey: ブル/ベアそれぞれのFVGが、上記の「判定本数」を満たした状態で解消され、グレーに変化した瞬間に通知を送ります。
実行タイミング: ローソク足の確定時にのみ通知されます。足の途中のヒゲで一時的に触れただけでは鳴りません。これにより、クローズ時点で確実に解消されたことのみを把握できます。

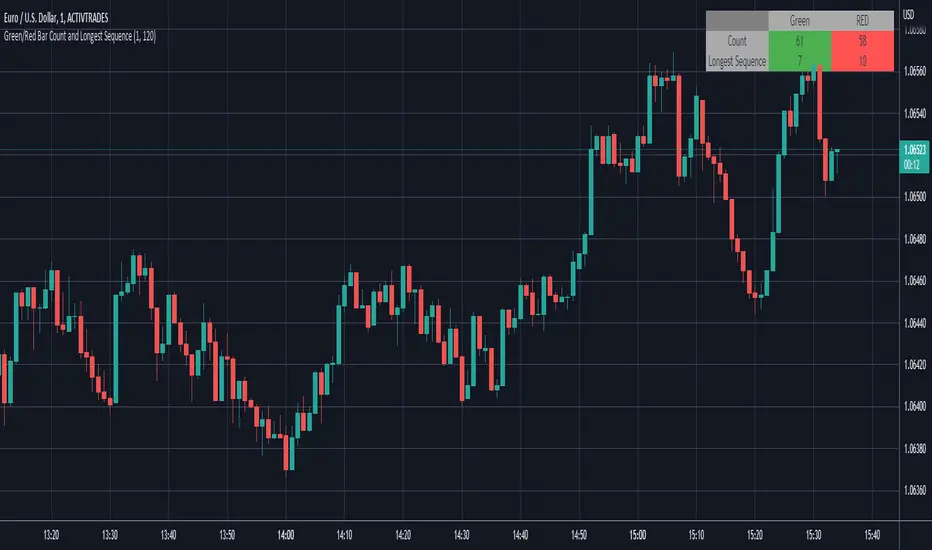
Green/Red Bar Count and Longest SequenceThis script counts the number of green and red candlesticks of a range you determine.
Default is from 1 to 120, which means the latest 120 candlesticks.
It also counts the most extended sequence of greens and reds.
IBS markerIndicator Description
This indicator provides a detailed analysis of the structure and volatility of each candlestick. It is designed to help traders better understand the balance between buying and selling pressure within individual bars, as well as the short-term volatility environment.
📌 Features
Candlestick Structure Analysis
Calculates the relative percentage of the upper wick, lower wick, and real body of each candle.
Helps traders visually and numerically evaluate whether a candle is dominated by bullish, bearish, or indecisive pressure.
IBS (Intraday Bar Strength)
Computes the Intraday Bar Strength value, showing where the close is located relative to the high-low range.
A high IBS indicates strong closing near the high, while a low IBS indicates weakness near the low.
Range Measurements
Displays the candlestick range in both price units and ticks.
Useful for traders who need precise range data for scalping or range-based strategies.
ATR (Average True Range) Volatility Filter
ATR is included with a configurable period setting.
Provides a contextual measure of volatility, helping traders compare current bar size against recent market behavior.
Dynamic Chart Labels
Key values (such as wick percentages, IBS, and range) are displayed directly on the chart through dynamic labels.
This allows for quick interpretation without opening extra panels or indicators.
📈 How to Use
Add the indicator to any chart and configure the settings (ATR period, label visibility, etc.) according to your trading style.
Use wick/body ratios to spot candles with unusual buying/selling pressure.
Combine IBS with ATR to identify potential exhaustion or continuation setups.
The dynamic labels are best used on lower timeframes for scalpers, but they can also provide insights on higher timeframes for swing traders.
🔍 Practical Applications
Identify reversal candles where one wick dominates.
Measure strength of breakouts by comparing candle body % and IBS values.
Detect volatility shifts by monitoring when bar ranges deviate from the ATR baseline.
Support scalping strategies that rely on tick-based range detection.
✅ Notes
This is a standalone indicator and does not require any other script to function.
Works on all markets (stocks, futures, forex, crypto).
For best results, use in conjunction with price action analysis or your preferred trading strategy.

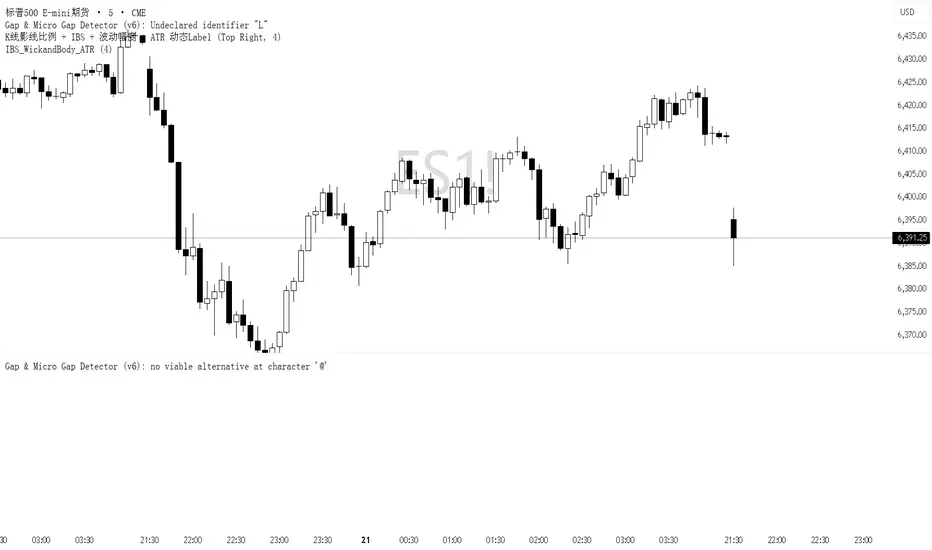
IBS_WickandBody_ATRIndicator Description
This indicator provides a detailed analysis of the structure and volatility of each candlestick. It is designed to help traders better understand the balance between buying and selling pressure within individual bars, as well as the short-term volatility environment.
📌 Features
Candlestick Structure Analysis
Calculates the relative percentage of the upper wick, lower wick, and real body of each candle.
Helps traders visually and numerically evaluate whether a candle is dominated by bullish, bearish, or indecisive pressure.
IBS (Intraday Bar Strength)
Computes the Intraday Bar Strength value, showing where the close is located relative to the high-low range.
A high IBS indicates strong closing near the high, while a low IBS indicates weakness near the low.
Range Measurements
Displays the candlestick range in both price units and ticks.
Useful for traders who need precise range data for scalping or range-based strategies.
ATR (Average True Range) Volatility Filter
ATR is included with a configurable period setting.
Provides a contextual measure of volatility, helping traders compare current bar size against recent market behavior.
Dynamic Chart Labels
Key values (such as wick percentages, IBS, and range) are displayed directly on the chart through dynamic labels.
This allows for quick interpretation without opening extra panels or indicators.
📈 How to Use
Add the indicator to any chart and configure the settings (ATR period, label visibility, etc.) according to your trading style.
Use wick/body ratios to spot candles with unusual buying/selling pressure.
Combine IBS with ATR to identify potential exhaustion or continuation setups.
The dynamic labels are best used on lower timeframes for scalpers, but they can also provide insights on higher timeframes for swing traders.
🔍 Practical Applications
Identify reversal candles where one wick dominates.
Measure strength of breakouts by comparing candle body % and IBS values.
Detect volatility shifts by monitoring when bar ranges deviate from the ATR baseline.
Support scalping strategies that rely on tick-based range detection.
✅ Notes
This is a standalone indicator and does not require any other script to function.
Works on all markets (stocks, futures, forex, crypto).
For best results, use in conjunction with price action analysis or your preferred trading strategy.
Wick to Candle Ratio with Multiple ColorsThe display in question likely provides visual representations or data related to the concept of the dot-based wick-to-body ratio. This ratio is a term often used in financial markets, particularly in the context of candlestick charts.
In candlestick charts, each candlestick represents a specific time period (such as a minute, hour, day, etc.) and provides four pieces of price data: the opening price, closing price, highest price, and lowest price of an asset within that timeframe. The "body" of the candlestick is the area between the opening and closing prices, while the "wicks" (or shadows) are the lines extending from the body, representing the highest and lowest prices during the period.
The dot-based wick-to-body ratio refers to a method of quantifying the relative lengths of the wicks compared to the body using dots or points. In this context, a display illustrating this ratio might show different candlesticks with highlighted dots representing the ratio between the length of the wick and the body. A higher ratio could indicate more volatility in price movements during that timeframe, while a lower ratio might suggest comparatively stable price action.

CRT TBSThe CRT Candle Marker is a custom indicator designed to identify and highlight specific candlestick patterns on a chart. This indicator focuses on detecting candles where the body of the candlestick is larger than the combined size of its wicks (upper and lower). Such candles often indicate strong momentum in the market, making them valuable for traders who rely on price action analysis.
Features
Automatic Detection: The indicator automatically scans all candlesticks on the chart to identify CRT candles.
Visual Marking: Once a CRT candle is detected, it places a label with the text "CRT" above the candlestick for easy identification.
Customizable Design: The label is styled with a blue background and white text, ensuring it stands out clearly on the chart.
Use Case
The CRT Candle Marker is particularly useful for traders who:
Want to identify strong momentum candles that could signal potential trend continuation or reversal points.
Rely on price action strategies and need visual cues to spot significant patterns quickly.
Analyze candlestick behavior to confirm entry or exit points in their trading strategies.
How to Use
Copy the Pine Script code and paste it into the Pine Editor in TradingView.
Click Add to Chart to apply the indicator.
Look for candles marked with the "CRT" label to identify strong momentum candles.
Example Scenario
Imagine you're analyzing a chart and looking for strong bullish momentum. With the CRT Candle Marker, you can easily spot candles where the buyers dominated the session, as indicated by a large body relative to the wicks. Similarly, bearish CRT candles could indicate strong selling pressure.
Conclusion
The CRT Candle Marker is a simple yet powerful tool for traders who want to enhance their candlestick analysis. By highlighting significant momentum candles, this indicator helps traders make more informed decisions and improve their overall trading performance.
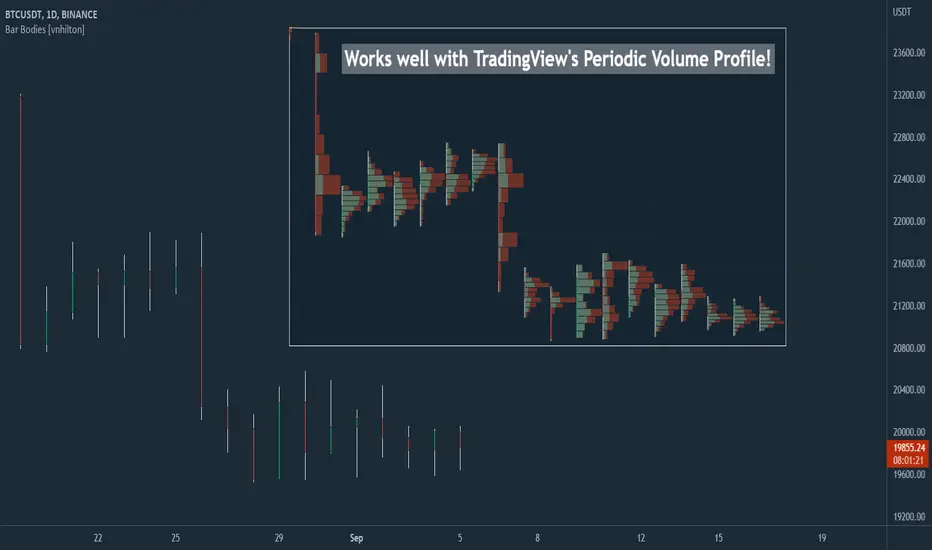
Bar Bodies [vnhilton]Note: Go to "Chart Settings" & hide "Body" & "Borders". Also uncheck "Labels on price scale" & "Values in status line" as they're not needed.
This script plots candlestick bodies with the same thickness as the wicks (similar to the bar chart, but without the horizontal lines to represent the open & close). To do this, it plots an invisible candlestick body with an invisible candlestick border from the high to the close/open for a green/red candle respectively, & uses the low wick as the candlestick body itself by plotting it from the low price to the open/close for a green/red candle respectively.
My personal use for this script is to use it in conjunction with TradingView's Periodic Volume Profile, in order to still see OHLC data without obstructing the candlesticks' volume profiles, as seen in the chart snapshot image above.
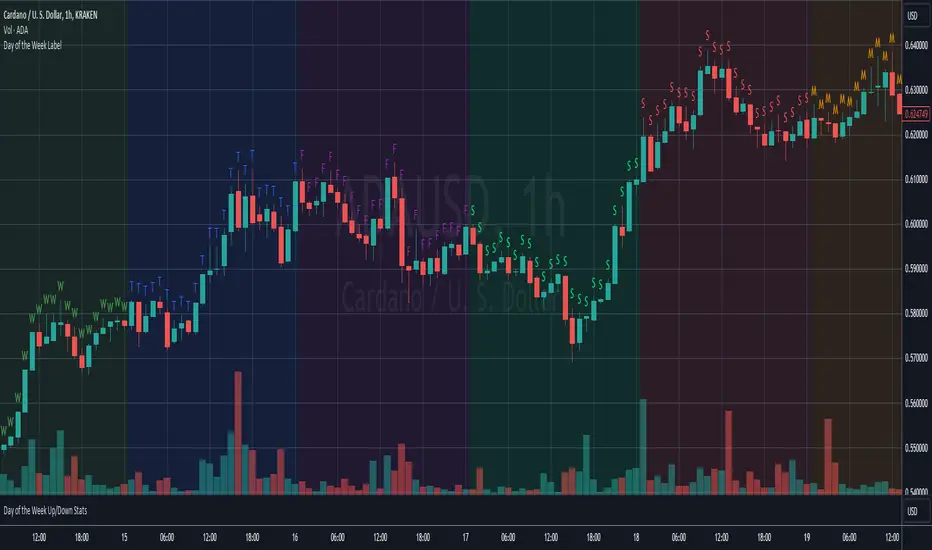
Day of the Week LabelOverview:
The "Day of the Week Label Indicator" is a simple yet powerful tool designed for traders and analysts who use TradingView for chart analysis. This indicator adds a clear visual cue to your charts by displaying the first letter of each day of the week directly above the corresponding candlestick. With this indicator, you can easily identify the day of the week at a glance without cluttering your chart.
Key Features:
Day Identification: Marks each candle with the first letter of the corresponding day of the week (e.g., "M" for Monday, "T" for Tuesday, and so on), providing immediate day recognition.
Color-Coded Labels: Each day is color-coded for better visibility and quick identification. Sundays and Saturdays are distinguished from the trading week, making it easier to spot the beginning and end of the trading week.
Overlay Design: As an overlay, this indicator seamlessly integrates with your existing chart setup, enhancing your analysis without interfering with other technical indicators or chart elements.
Benefits:
Enhanced Chart Analysis: Quickly discern patterns or trends that may be specific to certain days of the week, aiding in the refinement of trading strategies.
Time Management: Helps in planning trading activities or analysis by visually highlighting the days directly on the chart.
User-Friendly: Simple and non-intrusive, this indicator is designed to complement your chart without overwhelming it with information.
How to Use:
Simply add the "Day of the Week Label Indicator" to your chart, and the first letter of each day will automatically appear above the corresponding candlestick. No additional configuration is required, making it suitable for both novice and experienced traders.
Whether you're conducting a detailed market analysis, looking for day-specific patterns, or simply want a clearer visual representation of the time on your charts, this indicator is an essential addition to your TradingView toolkit.
Price Action Patterns DetectorIt's something like "Price Action Candlestick Pattern Detector." That is, it's an indicator that detects not only Pinbars and Engulfing but also all popular candlesticks in Price Action (Doji, Hammer, Shooting Star, Inside Bar, etc.)

CandlestickUtilitiesThis library provides essential functions for candlestick chart analysis and pattern recognition in Pine Script®.
It includes:
• Candle structure analysis (bodies, shadows, lengths)
• Trend detection using EMAs
• Common candlestick pattern recognition
This library is under construction.
Designed to support strategy development and improve signal accuracy for traders.
Created by @xprophetx — under MPL-2.0 license.

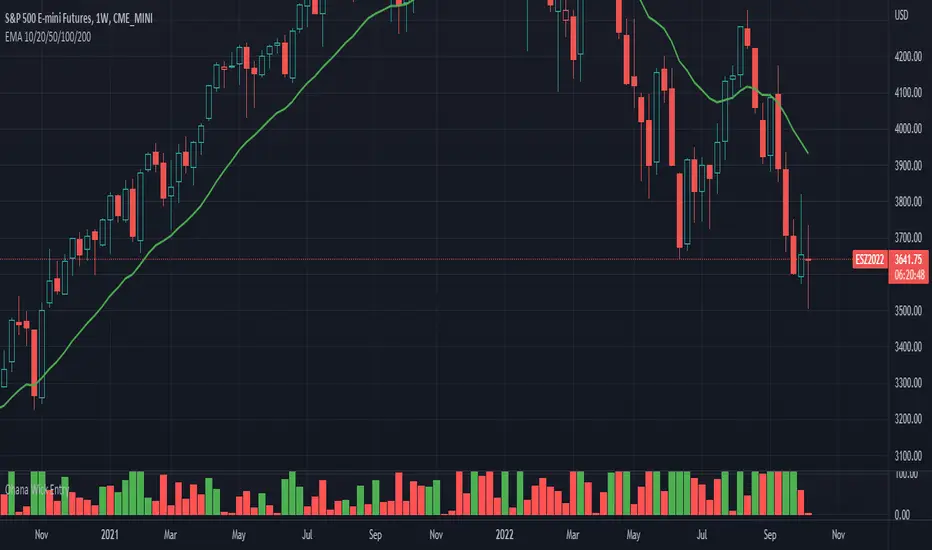
Ohana_Wick_EntryIndicator will change color depending if a wick comprises of less than 35% of the candlestick.
Strategy involves taking trades on stops above a green signal (<35% wick) to a target of the size of the candle body (expressed as the value in the indicator)
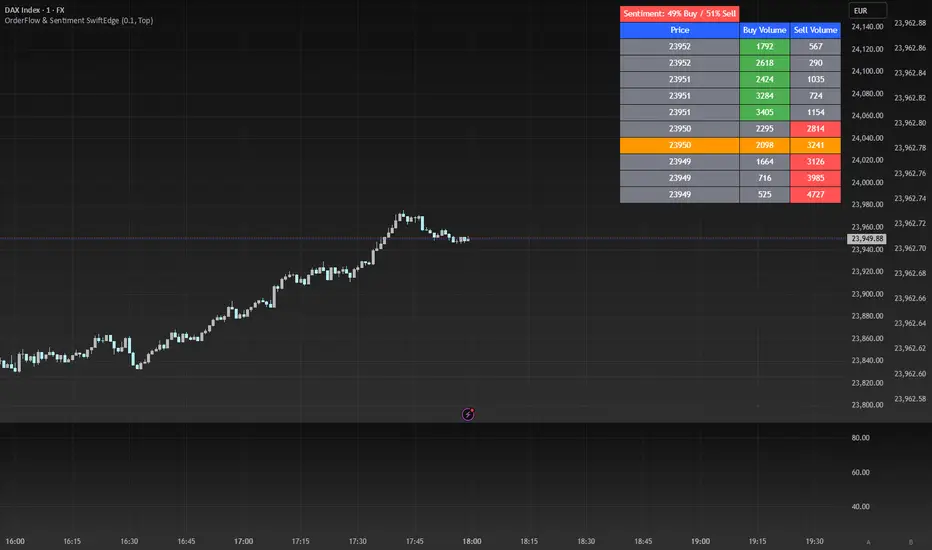
OrderFlow Sentiment SwiftEdgeOrderFlow Sentiment SwiftEdge
Overview
OrderFlow Sentiment SwiftEdge is a visual indicator designed to help traders analyze market dynamics through a simulated orderbook and market sentiment display. It breaks down the current candlestick into 10 price bins, estimating buy and sell volumes, and presents this data in an orderbook table alongside a sentiment row showing the buy vs. sell bias. This tool provides a quick and intuitive way to assess orderflow activity and market sentiment directly on your chart.
How It Works
The indicator consists of two main components: an Orderbook Table and a Market Sentiment Row.
Orderbook Table:
Simulates buy and sell volumes for the current candlestick by distributing total volume into 10 price bins based on price movement and proximity to open/close levels.
Displays the price bins in a table with columns for Price, Buy Volume, and Sell Volume, sorted from highest to lowest price.
Highlights the current price level in orange for easy identification, while buy and sell dominance is indicated with green (buy) or red (sell) backgrounds.
Market Sentiment Row:
Calculates the overall buy and sell sentiment (as a percentage) for the current candlestick based on the simulated orderflow data.
Displays the sentiment above the orderbook table, with the background colored green if buyers dominate or red if sellers dominate.
Features
Customizable Colors: Choose colors for buy (default: green), sell (default: red), and current price (default: orange) levels.
Lot Scaling Factor: Adjust the volume scaling factor (default: 0.1 lots per volume unit) to simulate realistic lot sizes.
Table Position: Select the table position on the chart (Top, Middle, or Bottom; default: Middle).
Default Properties
Positive Color: Green
Negative Color: Red
Current Price Color: Orange
Lot Scaling Factor: 0.1
Table Position: Middle
Usage
This indicator is ideal for traders who want to visualize orderflow dynamics and market sentiment in real-time. The orderbook table provides a snapshot of buy and sell activity at different price levels within the current candlestick, helping you identify areas of high buying or selling pressure. The sentiment row offers a quick overview of market bias, allowing you to gauge whether buyers or sellers are currently dominating. Use this information to complement your trading decisions, such as identifying potential breakout levels or confirming trend direction.
Limitations
This indicator simulates orderflow data based on candlestick price movement and volume, as TradingView does not provide tick-by-tick data. The volume distribution is an approximation and should be used as a visual aid rather than a definitive measure of market activity.
The indicator operates on the chart's current timeframe and does not incorporate higher timeframe data.
The simulated volumes are scaled using a user-defined lot scaling factor, which may not reflect actual market lot sizes.
Disclaimer
This indicator is for informational purposes only and does not guarantee trading results. Always conduct your own analysis and manage risk appropriately. The simulated orderflow data is an estimation and may not reflect real market conditions.
Arrow-SimplyTrade vol1.5-FinalTitle: Arrow-SimplyTrade vol1.5-Final
Description:
This advanced trading indicator is designed to assist traders in analyzing market trends and identifying optimal entry signals. It combines several popular technical analysis tools and strategies, including EMA (Exponential Moving Average), MA (Simple Moving Averages), Bollinger Bands, and candlestick patterns. This indicator provides both trend-following and counter-trend signals, making it suitable for various trading styles, such as scalping and swing trading.
Main Features:
EMA (Exponential Moving Average):
EMA200 is the main trend line that helps determine the overall market direction. When the price is above EMA200, the trend is considered bullish, and when the price is below EMA200, the trend is considered bearish.
It helps filter out signals that go against the prevailing market trend.
Simple Moving Averages (MA5 and MA15):
This indicator uses two Simple Moving Averages: MA5 (Fast) and MA15 (Slow). Their crossovers create buy or sell signals:
Buy Signal: When MA5 crosses above MA15, signaling a potential upward trend.
Sell Signal: When MA5 crosses below MA15, signaling a potential downward trend.
Bollinger Bands:
Bollinger Bands measure market volatility and can identify periods of overbought or oversold conditions. The Upper and Lower Bands help detect potential breakout points, while the Middle Line (Basis) serves as dynamic support or resistance.
This tool is particularly useful for identifying volatile conditions and potential reversals.
Arrows:
The indicator plots arrows on the chart to signal entry opportunities:
Green Arrows signal buy opportunities (when MA5 crosses above MA15 and price is above EMA200).
Red Arrows signal sell opportunities (when MA5 crosses below MA15 and price is below EMA200).
Opposite Arrows: Optionally, the indicator can also display arrows for counter-trend signals, triggered by MA5 and MA15 crossovers, regardless of the price's position relative to EMA200.
Candlestick Patterns:
The indicator detects popular candlestick patterns such as Bullish Engulfing, Bearish Engulfing, Hammer, and Doji.
These patterns are important for confirming entry points or anticipating trend reversals.
How to Use:
EMA200: The main trend line. If the price is above EMA200, consider long positions. If the price is below EMA200, consider short positions.
MA5 and MA15: Short-term trend indicators. The crossover of these averages generates buy or sell signals.
Bollinger Bands: Use these bands to spot overbought/oversold conditions. Breakouts from the bands may signal potential entry points.
Arrows: Green arrows represent buy signals, and red arrows represent sell signals. Opposite direction arrows can be used for counter-trend strategies.
Candlestick Patterns: Patterns like Bullish Engulfing or Doji can help confirm the signals.
Customizable Settings:
Fully customizable colors, line styles, and display settings for EMA, MAs, Bollinger Bands, and arrows.
The Candlestick Patterns feature can be toggled on or off based on user preference.
Important Notes:
This indicator is intended to be used in conjunction with other analysis tools.
Past performance does not guarantee future results.
Polish:
Tytuł: Arrow-SimplyTrade vol1.5-Final
Opis:
Ten zaawansowany wskaźnik handlowy jest zaprojektowany, aby pomóc traderom w analizie trendów rynkowych oraz identyfikowaniu optymalnych sygnałów wejścia. Łączy w sobie kilka popularnych narzędzi analizy technicznej i strategii, w tym EMA (Wykładnicza Średnia Ruchoma), MA (Prosta Średnia Ruchoma), Bollinger Bands oraz formacje świecowe. Wskaźnik generuje zarówno sygnały podążające za trendem, jak i przeciwnym trendowi, co sprawia, że jest odpowiedni do różnych stylów handlu, takich jak scalping oraz swing trading.
Główne Funkcje:
EMA (Wykładnicza Średnia Ruchoma):
EMA200 to główna linia trendu, która pomaga określić ogólny kierunek rynku. Gdy cena znajduje się powyżej EMA200, trend jest uznawany za wzrostowy, a gdy poniżej EMA200, za spadkowy.
Pomaga to filtrować sygnały, które są niezgodne z głównym trendem rynkowym.
Proste Średnie Ruchome (MA5 i MA15):
Wskaźnik używa dwóch Prostych Średnich Ruchomych: MA5 (szybka) oraz MA15 (wolna). Ich przecięcia generują sygnały kupna lub sprzedaży:
Sygnał Kupna: Kiedy MA5 przecina MA15 od dołu, sygnalizując potencjalny wzrost.
Sygnał Sprzedaży: Kiedy MA5 przecina MA15 od góry, sygnalizując potencjalny spadek.
Bollinger Bands:
Bollinger Bands mierzą zmienność rynku i mogą pomóc w identyfikowaniu okresów wykupienia lub wyprzedania rynku. Górna i dolna linia pomagają wykrywać punkty wybicia, a Środkowa Linia (Basis) działa jako dynamiczny poziom wsparcia lub oporu.
Narzędzie to jest szczególnie przydatne w wykrywaniu warunków zmienności i potencjalnych odwróceń trendu.
Strzałki:
Wskaźnik wyświetla strzałki na wykresie, które wskazują sygnały kupna i sprzedaży:
Zielona strzałka wskazuje sygnał kupna (gdy MA5 przecina MA15 i cena jest powyżej EMA200).
Czerwona strzałka wskazuje sygnał sprzedaży (gdy MA5 przecina MA15 i cena jest poniżej EMA200).
Strzałki w przeciwnym kierunku: Opcjonalna funkcja, która pokazuje strzałki w przeciwnym kierunku, uruchamiane przez przecięcia MA5 i MA15, niezależnie od pozycji ceny względem EMA200.
Formacje Świecowe:
Wskaźnik wykrywa popularne formacje świecowe, takie jak Bullish Engulfing, Bearish Engulfing, Hammer oraz Doji.
Formacje te pomagają traderom potwierdzić punkty wejścia i przewidzieć możliwe odwrócenia trendu.
Jak Używać:
EMA200: Główna linia trendu. Jeśli cena jest powyżej EMA200, rozważaj pozycje długie. Jeśli cena jest poniżej EMA200, rozważaj pozycje krótkie.
MA5 i MA15: Śledzą krótkoterminowe zmiany trendu. Przecięcia tych średnich generują sygnały kupna lub sprzedaży.
Bollinger Bands: Używaj tych pasm do wykrywania wykupionych lub wyprzedanych warunków. Wybicia z pasm mogą wskazywać potencjalne punkty wejścia.
Strzałki: Zielona strzałka wskazuje sygnał kupna, a czerwona strzałka sygnał sprzedaży. Strzałki w przeciwnym kierunku mogą być używane do strategii przeciwtrendowych.
Formacje Świecowe: Formacje takie jak Bullish Engulfing czy Doji mogą pomóc w potwierdzaniu sygnałów.
Ustawienia Personalizacji:
W pełni personalizowalne kolory, style linii i ustawienia wyświetlania dla EMA, MAs, Bollinger Bands oraz strzałek.
Funkcja Formacji Świecowych może być włączana lub wyłączana według preferencji użytkownika.
Ważne Uwagi:
Ten wskaźnik powinien być używany w połączeniu z innymi narzędziami analizy rynku.
Wyniki z przeszłości nie gwarantują wyników w przyszłości.

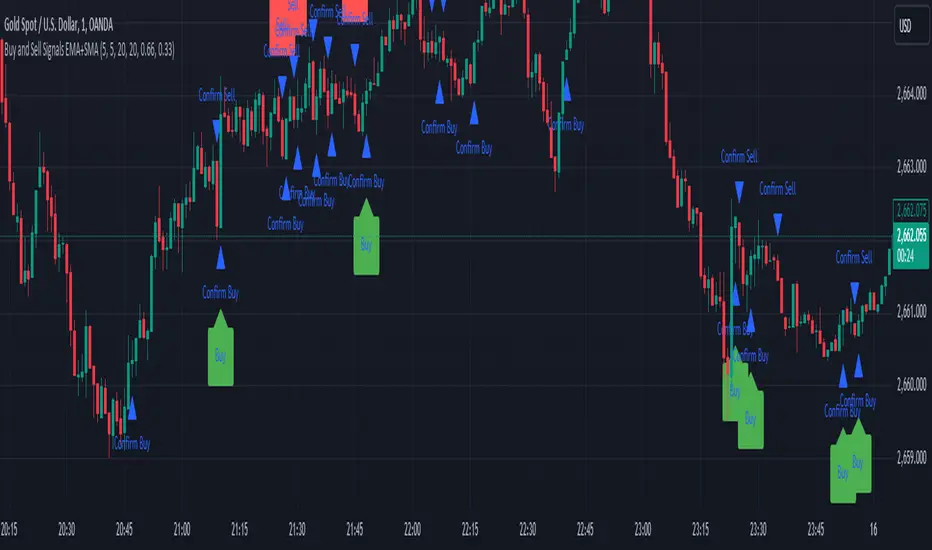
Sell Signals EMA+SMAIndicator Overview:
This indicator identifies sell signals based on candlestick patterns, volume conditions, and moving average confirmations. It also plots support and resistance levels based on pivot highs and pivot lows. You can configure different settings like pivot lengths, moving average periods, and candlestick pattern conditions for the sell signals.
Configurable Settings:
Pivot High Length: Defines the number of bars used to calculate the resistance levels (pivot highs).
Pivot Low Length: Defines the number of bars used to calculate the support levels (pivot lows).
Volume SMA Length: The period of the simple moving average (SMA) for volume. Used to filter signals based on high volume.
Close SMA Length: The period of the simple moving average (SMA) for the close price. Used for confirmation of sell signals.
Pin Bar High Ratio: The ratio for defining the size of the upper wick in a bearish pin bar.
Pin Bar Low Ratio: The ratio for defining the size of the lower wick in a bearish pin bar.
How It Works:
Support and Resistance:
The indicator plots red lines for resistance (pivot highs) and green lines for support (pivot lows).
These levels are updated as new pivot points are detected based on the configured pivot lengths.
Sell Signal Conditions:
Candlestick Patterns: The indicator checks for two bearish patterns:
Bearish Pin Bar: A candle with a large upper wick and small lower wick where the close is below the open.
Bearish Engulfing: A candle where the current close is lower than the previous low, and the current open is higher than the previous high.
Volume Condition: The volume must be above the configured simple moving average (SMA) of the volume.
Confirmation: A sell signal is confirmed only when the price crosses below the configured SMA for the close price.
Sell Signals:
If all the conditions (candlestick pattern, volume, and confirmation) are met, the indicator will plot a red "Sell" label above the candle.
Additionally, a blue triangle will appear above the candle to indicate that the sell signal has been confirmed.
How to Use:
Adjust the Settings:
Open the settings of the indicator and adjust the parameters like pivot lengths, moving average periods, and candlestick pattern ratios based on your preferences.
Identify Key Levels:
Watch the red resistance and green support lines to identify key levels where price may reverse.
Look for Sell Signals:
When a red "Sell" label appears, it indicates a possible sell opportunity.
Ensure that a blue triangle (confirmation) also appears to validate the sell signal.
Manage Risk:
Use the support and resistance levels along with the sell signals to define your entry, stop-loss, and take-profit levels.
This indicator helps you identify potential bearish reversal points with configurable settings for added flexibility.
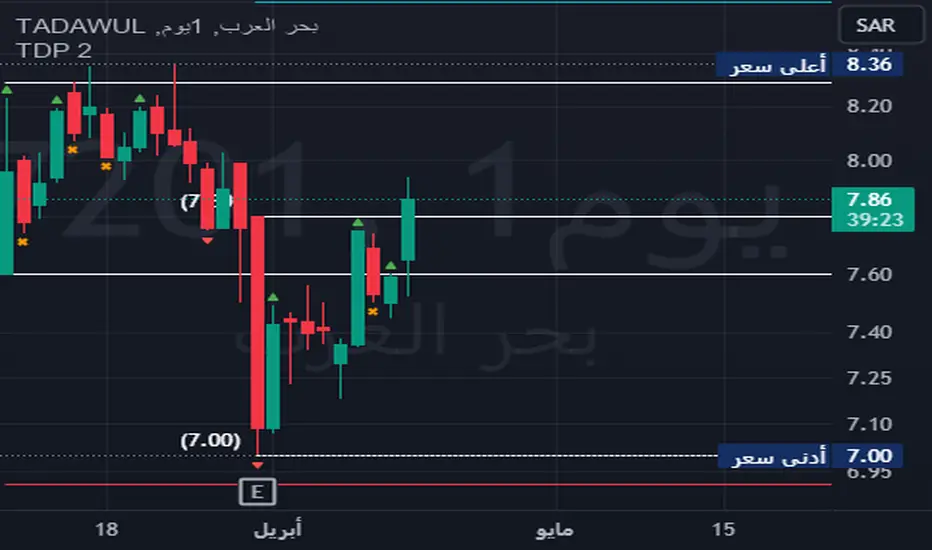
TDP 2Title: Enhanced Candlestick Pattern Identifier with Body Ratio Analysis
Description:
This Pine Script, titled "Enhanced Candlestick Pattern Identifier with Body Ratio Analysis," is designed to aid traders in visualizing key candlestick formations that have significant implications for trend reversals and continuations. It uses the body ratio of candles to identify strong directional movements, enhancing decision-making processes in trading strategies.
Key Features:
Body Ratio Calculation: The script calculates the body ratio of each candle, which is the proportion of the candle's body to its total range. This helps in distinguishing between candles that show decisive market movements versus those with indecision.
Bullish Candle Identification: Identifies bullish candles where the close is greater than the open and the body constitutes at least 55% of the total candle range, indicating strong buying pressure.
Bearish Candle Identification: Flags bearish candles where the open is above the close with a body ratio of 55% or more, highlighting strong selling pressure.
Comparative Analysis: The script not only identifies bearish candles but also categorizes them based on whether they close below the lowest point of the last qualifying bullish candle, offering insights into potential breakdowns or supports.
Visual Markers: Uses distinct shapes and colors to mark each type of candle directly on the chart, making it easy to spot these patterns in real-time trading scenarios.
Utility:
This tool is invaluable for traders who utilize technical analysis to make informed decisions. By providing clear visual cues about significant bullish and bearish candlestick formations, the script facilitates quick interpretations of potential market moves, helping traders to capitalize on trends or protect against losses from reversals.
How to Use:
Simply add this script to your chart, and it will automatically highlight the qualifying candles. Green labels indicate strong bullish candles, red labels signify bearish candles closing below the last bullish candle's low, and orange labels show bearish candles that do not close below the bullish low.
Ideal for use in various markets including forex, equities, and commodities, this script is a must-have tool for both novice and experienced traders aiming to enhance their trading strategy with detailed candlestick pattern analysis.
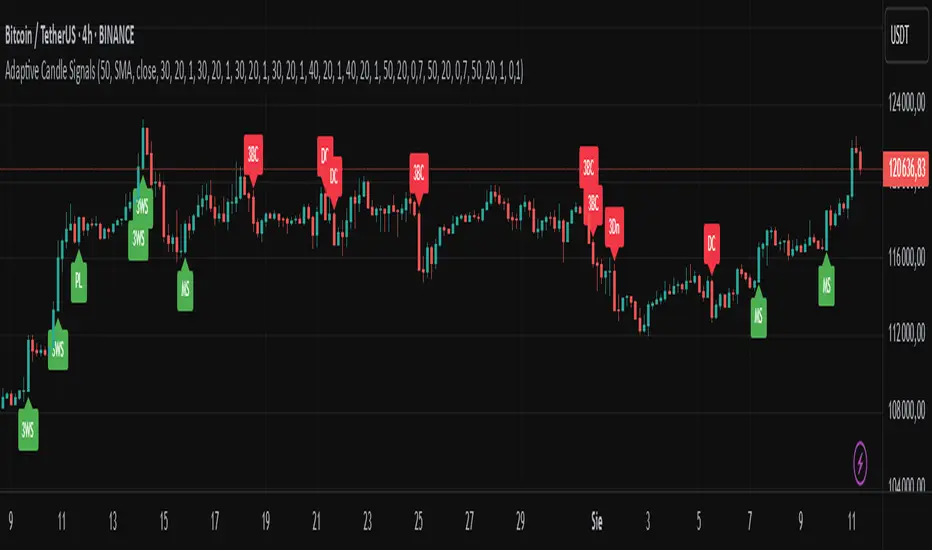
Adaptive Candle Signals█ OVERVIEW
The Adaptive Candle Signals indicator is a Pine Script® tool designed to identify key candlestick patterns on the chart, such as Bullish Engulfing, Bearish Engulfing, Piercing Line, Dark Cloud Cover, Morning Star, Evening Star, Three White Soldiers, Three Black Crows, and Three Inside Up/Down. The indicator allows customization of settings, including a Moving Average (MA) filter, candle size control, and maximum wick percentage, enabling precise adaptation to various trading strategies. Signals are displayed as labels on the chart, and each pattern can trigger alerts for user convenience.
█ CONCEPTS
The indicator is designed with flexibility and readability in mind. Its main features include:
Features
Signal Filtering: Enables the use of a Moving Average (MA) filter to confirm signals based on trend direction. Bullish signals are generated when the price is above the MA, and bearish signals when below.
Pattern Customization: Users can enable or disable individual candlestick patterns and adjust their parameters, such as maximum wick percentage or candle size multiplier. The candle size multiplier applies to the largest candle in the pattern and determines its minimum size relative to the average candle body size over a specified volatility period.
Labels and Colors: Signals are displayed as clear labels with customizable colors for bullish and bearish patterns.
Alerts: Each pattern has a dedicated alert function, facilitating integration with automated trading strategies.
List of Patterns
The indicator recognizes the following candlestick patterns (labels displayed in parentheses):
Bullish Engulfing (BE): Signals a potential upward reversal after a downtrend.
Bearish Engulfing (BE): Indicates a possible downward reversal after an uptrend.
Piercing Line (PL): A bullish pattern suggesting a bounce from support.
Dark Cloud Cover (DC): A bearish pattern indicating a potential downward reversal.
Morning Star (MS): A three-candle bullish pattern signaling an upward reversal.
Evening Star (ES): A three-candle bearish pattern indicating a downward reversal.
Three White Soldiers (3WS): A strong bullish signal based on three large bullish candles.
Three Black Crows (3BC): A strong bearish signal based on three large bearish candles.
Three Inside Up/Down (3Up/3Dn): Patterns indicating trend reversal based on an inside bar structure.
Settings
Settings are organized as follows:
MA Filter: Allows enabling a Moving Average (SMA, EMA, WMA) to filter signals based on trend direction.
Pattern Parameters: Each pattern has its own settings, such as volatility period, candle size multiplier, and maximum wick percentage. The size of the largest candle in the pattern is compared to the average candle body size over the specified volatility period.
Colors and Labels: Users can customize label colors and their distance from candles to improve readability.
█ SETTINGS
Detailed description of the indicator’s settings:
MA Filter:
Use MA Filter: Enables/disables the Moving Average filter.
MA Length: Specifies the period of the Moving Average (default: 50).
MA Type: Choose between SMA, EMA, or WMA.
MA Source: Select the data source (default: close price).
Pattern Settings:
Enable Pattern: Checkbox for each pattern (e.g., Bullish Engulfing, Morning Star).
Maximum Wick Percentage: Defines the maximum allowable wick size as a percentage of the candle body.
Big Candle Filter: Enables/disables checking if the largest candle in the pattern is larger than the average over the specified volatility period.
Volatility Period: Sets the period for calculating the average candle body size.
Candle Multiplier: Multiplier determining the minimum size of the largest candle in the pattern relative to the average candle body size over the specified volatility period.
Appearance:
Signal Text Color: Color of the label text (default: white).
Bullish Label Color: Color for bullish signals (default: green).
Bearish Label Color: Color for bearish signals (default: red).
Label Offset Factor: Controls the distance of labels from candles (from 0.0 to 1.0).
█ HOW TO USE
Add the indicator to your TradingView chart.
Configure the settings in the indicator’s dialog box:
Enable desired candlestick patterns.
Adjust the MA filter parameters to restrict signals to the trend.
Set colors and label offset for better readability.
Enable alerts for selected patterns to receive real-time notifications.
Monitor the labels on the chart and use them alongside other technical analysis tools.
█ LIMITATIONS
The indicator relies on historical price data and may produce false signals in volatile market conditions.
The big candle filter may be less effective on charts with low volatility.
The indicator performs best when combined with other analysis methods, such as support and resistance levels.
Pinbar DetectorPinbar Detector is original from Naked Candlestick Trading Method
Pinbar Definition: A candlestick where the dominant shadow exceeds 2/3 of the entire candle length
Key Features:
Bearish Pinbar: Red downward triangle when upper shadow exceeds 2/3 of total candle length
Bullish Pinbar: Green upward triangle when lower shadow exceeds 2/3 of total candle length
Background highlighting for easy identification
Alert conditions for both bullish and bearish pinbars
Original candlestick display preserved

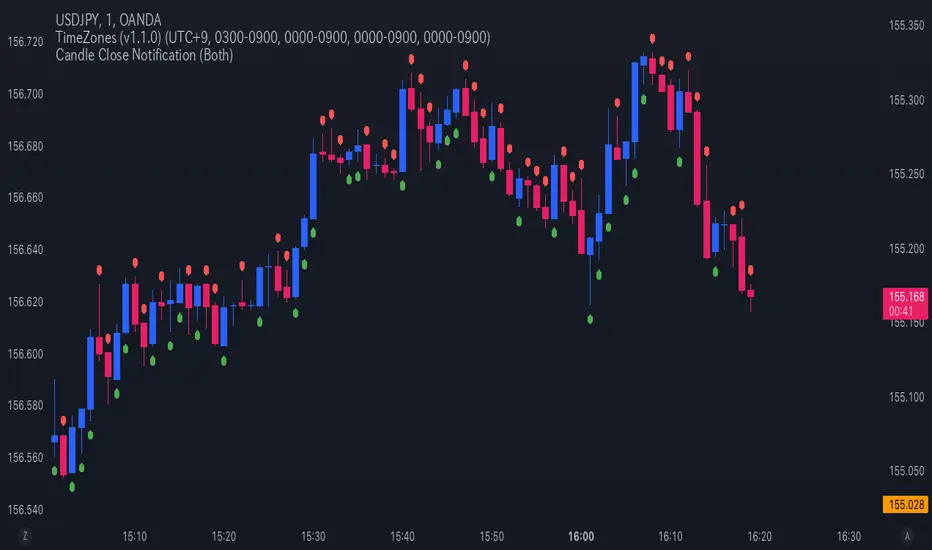
Candle Close NotificationCandle Close Notification Indicator - Specification
1. 概要 (Overview)
本インジケーターは、TradingView 上でローソク足が確定した際に、そのローソク足が陰線(Bearish)または陽線(Bullish)であった場合に通知を送信するものです。
また、該当するローソク足の上または下にマークを表示し、視覚的にも識別しやすくなっています。
This indicator for TradingView sends notifications when a candlestick closes as either a bearish (red) or bullish (green) candle. It also marks the corresponding candles on the chart for visual reference.
2. 機能 (Features)
2.1 通知機能 (Notification Function)
ローソク足の確定時に、以下の条件に基づき アラート(通知) を送信します。
「Both」(両方): 陰線・陽線のどちらでも通知
「Bearish」(陰線のみ): 陰線の時のみ通知
「Bullish」(陽線のみ): 陽線の時のみ通知
When a candlestick closes, an alert notification is sent based on the selected option:
"Both" (Default): Notifies for both bearish and bullish candles.
"Bearish": Notifies only bearish candles.
"Bullish": Notifies only bullish candles.
2.2 チャートマーク表示機能 (Chart Marking Function)
ローソク足が確定した際、以下のルールでマークを表示します。
陰線(Bearish) の場合、赤色の「下向きマーク」を表示(ローソク足の上)
陽線(Bullish) の場合、緑色の「上向きマーク」を表示(ローソク足の下)
When a candlestick closes, a marker appears according to the following rules:
Bearish candle → A red downward marker appears above the candle.
Bullish candle → A green upward marker appears below the candle.
3. 通知オプションの設定 (Setting Notification Options)
スクリプト内の notify_option の値を変更することで、通知の種類を設定できます。
Both(デフォルト) → 陰線・陽線両方通知
Bearish → 陰線のみ通知
Bullish → 陽線のみ通知
Modify the notify_option value in the script to customize notifications:
Both (Default) → Notifies for both bearish and bullish candles.
Bearish → Notifies only bearish candles.
Bullish → Notifies only bullish candles.
TradingView の アラート機能 を有効にすることで、通知を受け取ることができます。
Enable TradingView’s Alert function to receive notifications.