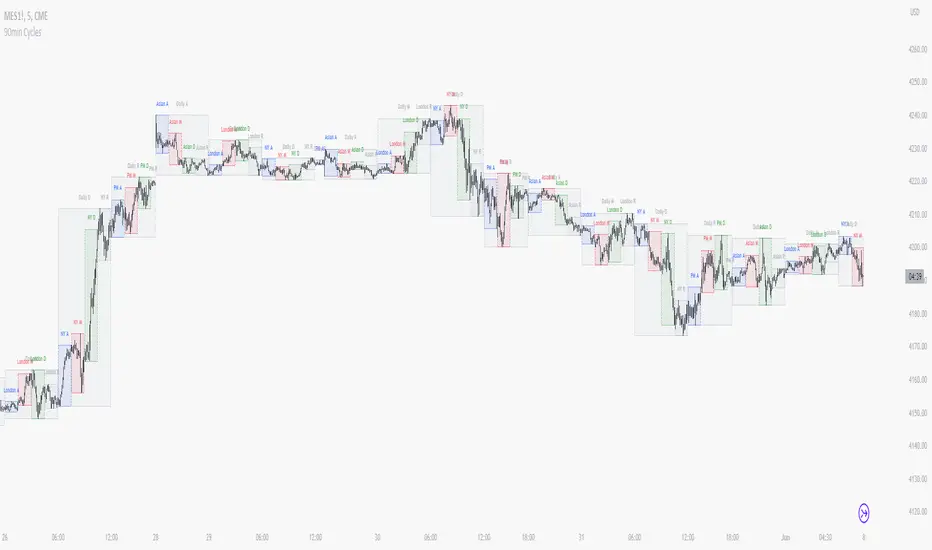
Weekly Cycles [SolQuant]The Weekly Cycles indicator maps recurring weekly behavioral phases onto the chart using colored daily boxes and labels. It divides each week into distinct phases based on observed market patterns, providing structural context for intraweek trading decisions.
█ USAGE
Weekly Phases
Each day of the week is assigned a behavioral phase:
• Sunday — Dead Gap Zone: Low-liquidity period where gaps from the weekend close can create traps. Price action during this phase is often unreliable for directional bias.
• Monday — False Move: The early-week move that frequently reverses. Monday often establishes a range extreme that gets swept later in the week.
• Tuesday — Consolidation: A transition day where the market digests Monday's move and begins building the structure for the week's main directional move.
• Wednesday/Thursday — Midweek Reversal: The highest-probability window for the week's primary directional move. This phase often sees the week's true trend establish itself.
• Friday — Model Completion: The closing phase where weekly targets are either achieved or the move stalls. Profit-taking and position squaring are common.
• Saturday — Weekend Trap: Low-liquidity continuation of Friday's action that can create misleading signals for the following week.
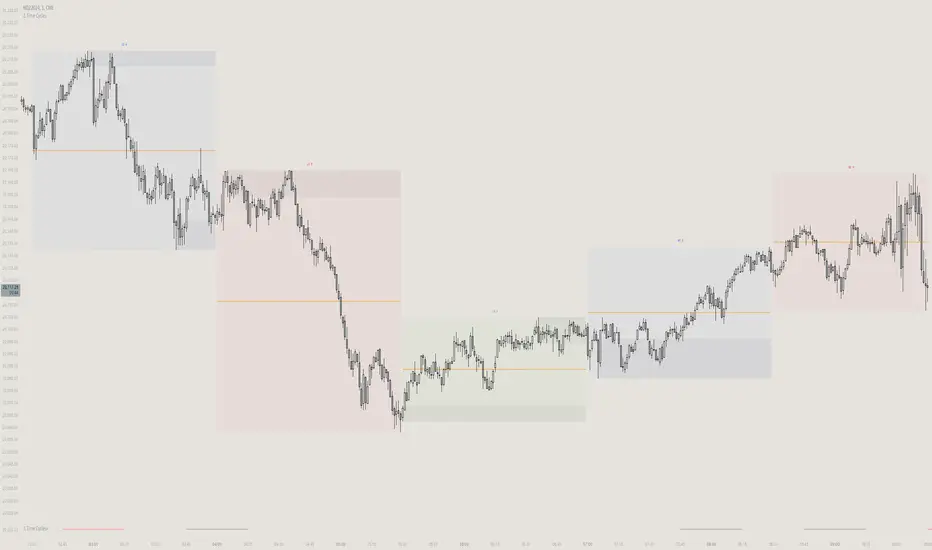
Visual Display
Each phase is represented by a colored box spanning the day's price range. Labels at the top of each box display the phase name for quick reference. The boxes update in real time as each day's high and low develop.
█ DETAILS
The indicator uses the day of the week (dayofweek) to assign phases. Box boundaries are defined by each day's opening time through the next day's opening time, with the price range tracking the high and low of bars within that window.
Historical boxes are maintained up to a configurable maximum count. Boxes are created at the start of each new day and their height is updated with each new bar as the day's range expands.
█ SETTINGS
• Show Phase Labels: Toggle the text labels above each daily box.
• Phase Colors: Customizable colors for each day/phase.
• Max Boxes: Controls how many historical weekly cycle boxes are displayed.
Weekly cycle phases are based on observed market patterns and do not guarantee that price will follow the described behavior in any given week. Market conditions vary and phases should be used as context, not as standalone signals. This indicator does not constitute financial advice.
Pine Script®指標