MACD-RSI Divergence OscillatorMACD-RSI Divergence Oscillator: Dual Confirmation with Momentum + Divergence Signals
This powerful oscillator combines MACD and RSI into a single normalized visual tool, enriched with automatic divergence detection and smart signal alerts. It’s designed to give traders advanced insights into momentum shifts and trend reversals.
Key Features:
• MACD + RSI Combo: Both indicators are scaled and merged into one oscillator for clearer interpretation.
• Automatic Divergence Detection:
• Bullish & Bearish divergences on both MACD and RSI
• Highlights strong divergences when both confirm
• Trading Signals:
• Detects MACD crossovers and RSI reversals
• Smart buy/sell signals based on momentum + divergence
• Custom Oscillator View:
• Plots MACD and RSI on the same scale
• Visual zero-line, overbought/oversold levels, and customizable colors
• Optional Dashboard Table:
• Displays live indicator values, signal states, and divergence status
Ideal For:
• Spotting early trend reversals
• Confirming trade entries/exits
• Avoiding false signals using dual indicator logic
Highly customizable and suitable for all timeframes and asset types.
在腳本中搜尋"Divergence"

(MVD) Meta-Volatility Divergence (DAFE) Meta-Volatility Divergence (MVD)
Reveal the Hidden Tension in Volatility.
The Meta-Volatility Divergence (MVD) indicator is a next-generation tool designed to expose the disagreement between multiple volatility measures—helping you spot when the market’s “volatility engines” are out of sync, and a regime shift or volatility event may be brewing.
What Makes MVD Unique?
Multi-Source Volatility Analysis:
Unlike traditional volatility indicators that rely on a single measure, MVD fuses four distinct volatility signals:
ATR (Average True Range): Captures the average range of price movement.
Stdev (Standard Deviation): Measures the dispersion of closing prices.
Range: The average difference between high and low.
VoVix: A proprietary “volatility of volatility” metric, quantifying the difference between fast and slow ATR, normalized by ATR’s own volatility.
Divergence Engine:
The core MVD line (yellow) represents the mean absolute deviation (MAD) of these volatility measures from their average. When the line is flat, all volatility measures are in agreement. When the line rises, it means the market’s volatility signals are diverging—often a precursor to regime shifts, volatility expansions, or hidden stress.
Dynamic Z-Score Normalization:
The MVD line is normalized as a Z-score, so you can easily spot when current divergence is rare or extreme compared to recent history.
Visual Clarity:
Yellow center line: Tracks the real-time divergence of volatility measures.
Green dashed thresholds: Mark the ±2.00 Z-score levels, highlighting when divergence is unusually high and action may be warranted.
Dashboard: Toggleable panel shows all key metrics (ATR, Stdev, VoVix, MVD Z) and your custom branding.
Compact Info Label : For mobile or minimalist users, a single-line summary keeps you informed without clutter.
What Makes The MVD line move?
- The MVD line rises when the included volatility measures (ATR, Stdev, Range, VoVix) are moving in different directions or at different magnitudes. For example, if ATR is rising but Stdev is falling, the line will move up, signaling disagreement.
- The line falls or flattens when all volatility measures are in sync, indicating a consensus in the market’s volatility regime.
- VoVix adds a unique dimension, making the indicator especially sensitive to sudden changes in volatility structure that most tools miss.
Inputs & Settings
ATR Length: Sets the lookback for ATR calculation. Shorter = more sensitive, longer = smoother.
Stdev Length: Sets the lookback for standard deviation. Adjust for your asset’s volatility.
Range Length: Sets the lookback for the average high-low range.
MVD Lookback: Controls the window for Z-score normalization. Higher values = more historical context, lower = more responsive.
Show Dashboard: Toggle the full dashboard panel on/off.
Show Compact Info Label: Toggle the mobile-friendly info line on/off.
Tip:
Adjust these settings to match your asset’s volatility and your trading timeframe. There is no “one size fits all”—tuning is key to extracting the most value from MVD.
How to make MVD work for you:
Threshold Crosses: When the MVD line crosses above or below the green dashed thresholds (±2.00), it signals that volatility measures are diverging more than usual. This is a heads-up that a volatility event, regime shift, or hidden market stress may be developing.
Not a Buy/Sell Signal: A threshold cross is not a direct buy or sell signal. It is an indication that the market’s volatility structure is changing. Use it as a filter, confirmation, or alert in combination with your own strategy and risk management.
Dashboard & Info Line: Use the dashboard for a full view of all metrics, or the info label for a quick glance—especially useful on mobile.
Chart: MNQ! on 5min frames
ATR: 14
StDev L: 11
Range L: 13
MDV LB: 13
Important Note
MVD is a market structure and volatility regime tool.
It is designed to alert you to potential changes in market conditions, not to provide direct trade entries or exits. Always combine with your own analysis and risk management.
Meta-Volatility Divergence:
See the market’s hidden tension. Anticipate the next wave.
For educational purposes only. Not financial advice. Always use proper risk management.
Use with discipline. Trade your edge.
— Dskyz, for DAFE Trading Systems

Triple RSI DivergenceTriple rsi divergence
Sure! Here's a clear explanation in English of the Triple RSI Divergence Pine Script I shared earlier:
---
Explanation of the Triple RSI Divergence Pine Script
This Pine Script is designed to detect triple divergence patterns between the RSI (Relative Strength Index) and price action, which can signal potential trend reversals.
---
What is Triple Divergence?
Triple divergence occurs when price creates three consecutive higher highs (in an uptrend) or lower lows (in a downtrend), while the RSI moves in the opposite direction — forming lower highs or higher lows respectively.
This pattern is considered a strong reversal signal because it indicates momentum is weakening despite price continuing its trend.
---
What This Script Does:
Calculates RSI (14-period)
Identifies three recent highs/lows in price and RSI
Checks for:
Bearish triple divergence: price makes 3 higher highs, RSI makes 3 lower highs.
**Bullish

Gioteen-NormThe "Gioteen-Norm" indicator is a versatile and powerful technical analysis tool designed to help traders identify key market conditions such as divergences, overbought/oversold levels, and trend strength. By normalizing price data relative to a moving average and standard deviation, this indicator provides a unique perspective on price behavior, making it easier to spot potential reversals or continuations in the market.
The indicator calculates a normalized value based on the difference between the selected price and its moving average, scaled by the standard deviation over a user-defined period. Additionally, an optional moving average of this normalized value (Green line) can be plotted to smooth the output and enhance signal clarity. This dual-line approach makes it an excellent tool for both short-term and long-term traders.
***Key Features
Divergence Detection: The Gioteen-Norm excels at identifying divergences between price action and the normalized indicator value. For example, if the price makes a higher high while Red line forms a lower high, it may signal a bearish divergence, hinting at a potential reversal.
Overbought/Oversold Conditions: Extreme values of Red line (e.g., significantly above or below zero) can indicate overbought or oversold conditions, helping traders anticipate pullbacks or bounces.
Trend Strength Insight: The normalized output reflects how far the price deviates from its average, providing a measure of momentum and trend strength.
**Customizable Parameters
Traders can adjust the period, moving average type, applied price, and shift to suit their trading style and timeframe.
**How It Works
Label1 (Red Line): Represents the normalized price deviation from a user-selected moving average (SMA, EMA, SMMA, or LWMA) divided by the standard deviation over the specified period. This line highlights the relative position of the price compared to its historical range.
Label2 (Green Line, Optional): A moving average of Label1, which smooths the normalized data to reduce noise and provide clearer signals. This can be toggled on or off via the "Draw MA" option.
**Inputs
Period: Length of the lookback period for normalization (default: 100).
MA Method: Type of moving average for normalization (SMA, EMA, SMMA, LWMA; default: EMA).
Applied Price: Price type used for calculation (Close, Open, High, Low, HL2, HLC3, HLCC4; default: Close).
Shift: Shifts the indicator forward or backward (default: 0).
Draw MA: Toggle the display of the Label2 moving average (default: true).
MA Period: Length of the moving average for Label2 (default: 50).
MA Method (Label2): Type of moving average for Label2 (SMA, EMA, SMMA, LWMA; default: SMA).
**How to Use
Divergence Trading: Look for discrepancies between price action and Label1. A bullish divergence (higher low in Label1 vs. lower low in price) may suggest a buying opportunity, while a bearish divergence could indicate a selling opportunity.
Overbought/Oversold Levels: Monitor extreme Label1 values. For instance, values significantly above +2 or below -2 could indicate overextension, though traders should define thresholds based on the asset and timeframe.
Trend Confirmation: Use Label2 to confirm trend direction. A rising Label2 suggests increasing bullish momentum, while a declining Label2 may indicate bearish pressure.
Combine with Other Tools: Pair Gioteen-Norm with support/resistance levels, RSI, or volume indicators for a more robust trading strategy.
**Notes
The indicator is non-overlay, meaning it plots below the price chart in a separate panel.
Avoid using a Period value of 1, as it may lead to unstable results due to insufficient data for standard deviation calculation.
This tool is best used as part of a broader trading system rather than in isolation.
**Why Use Gioteen-Norm?
The Gioteen-Norm indicator offers a fresh take on price normalization, blending statistical analysis with moving average techniques. Its flexibility and clarity make it suitable for traders of all levels—whether you're scalping on short timeframes or analyzing long-term trends. By publishing this for free, I hope to contribute to the TradingView community and help traders uncover hidden opportunities in the markets.
**Disclaimer
This indicator is provided for educational and informational purposes only. It does not constitute financial advice. Always backtest and validate any strategy before trading with real capital, and use proper risk management.

ZenAlgo - QZenAlgo - Q
Description
ZenAlgo - Q is an oscillator based on the QQE (Quantitative Qualitative Estimation) method. This version incorporates refinements for additional visualization and interpretation options. It is designed to help traders observe momentum changes and divergence patterns in price movements.
Key Features
QQE-Based Calculation : Derived from the open-source QQE script by Glaz (Metastock Version of QQE), with modifications for alternative visualization.
Dual RSI-Based Analysis : Uses two RSI calculations to provide additional context on price movements.
Adaptive Trend Bands : Adjust dynamically based on the market conditions.
Divergence Identification : Highlights potential differences between price action and oscillator movement.
Dynamic Color Coding : Displays histogram bars to illustrate shifts in oscillator values.
Configurable Alerts : Enables notifications for specific oscillator conditions.
How It Works
The indicator calculates a smoothed RSI-based oscillator that tracks the relative strength of price movement. It applies an exponential moving average (EMA) smoothing to reduce noise while maintaining responsiveness.
Two adaptive bands are calculated using a variation of the QQE method, which helps define dynamic overbought and oversold conditions.
The histogram bars shift in color based on the position of the oscillator relative to the bands. Lighter shades indicate weaker momentum, while stronger momentum is represented by more saturated colors.
The script also includes a secondary RSI component, which provides an additional layer of analysis. This secondary RSI helps refine momentum trends by smoothing out short-term fluctuations.
Divergence identification is built-in, highlighting where price action deviates from oscillator readings. Bullish divergence occurs when price forms a lower low while the oscillator forms a higher low, and bearish divergence is identified when price forms a higher high while the oscillator forms a lower high.
The indicator does not generate buy or sell signals but instead provides contextual information that can be used alongside other trading strategies.
Use Cases
Trend Observation : Traders can use the histogram to observe whether momentum is strengthening or weakening over time. A shift in color can indicate a potential change in trend strength.
Divergence Analysis : By comparing oscillator divergence with price movement, traders can identify situations where price action may be losing momentum. Divergences do not guarantee reversals but can serve as an early warning to re-evaluate positions.
Momentum Tracking : The dual RSI structure allows users to monitor both short-term and long-term momentum. When both RSI components are aligned, it suggests a more stable trend, while divergence between them may indicate potential consolidation or trend shifts.
Supplementary Analysis : This indicator is best used as a supporting tool alongside volume-based or trend-following indicators. It helps visualize underlying price behavior but should not be used in isolation for decision-making.
Market Context Interpretation : The combination of adaptive bands and histogram visualization allows traders to assess how recent price action compares to historical movement, helping to place current conditions in a broader market context.
Attribution
This script is an adaptation of the open-source QQE script originally developed by Glaz. We acknowledge and appreciate the original author's work, which served as a foundation for our modifications.
Disclaimer
This indicator is intended for informational purposes only. It should not be interpreted as financial advice. Always conduct independent research and risk management before making trading decisions.

MACD & Bollinger Bands Overbought OversoldMACD & Bollinger Bands Reversal Detector
This indicator combines the power of MACD divergence analysis with Bollinger Bands to help traders identify potential reversal points in the market.
Key Features:
MACD Calculation & Divergence:
The script calculates the standard MACD components (MACD line, Signal line, and Histogram) using configurable fast, slow, and signal lengths. It includes a simplified divergence detection mechanism that flags potential bearish divergence—when the price makes a new swing high but the MACD fails to confirm the move. This divergence can serve as an early warning that the bullish momentum is waning.
Bollinger Bands:
A 20-period simple moving average (SMA) is used as the basis, with upper and lower bands drawn at 2 standard deviations. These bands help visualize overbought and oversold conditions. For example, a close at or above the upper band suggests the market may be overextended (overbought), while a close at or below the lower band may indicate oversold conditions.
Visual Alerts:
The indicator plots the Bollinger Bands on the chart along with labels marking overbought and oversold conditions. Additionally, it marks potential bearish divergence with a downward triangle, providing a quick visual cue to traders.
Usage Suggestions:
Confluence with Other Signals:
Use the divergence signals and Bollinger Band conditions as filters. For example, even if another indicator suggests a long entry, you might avoid it if the price is overbought or if MACD divergence warns of weakening momentum.
Customization:
All key parameters, such as the MACD lengths, Bollinger Band period, and multiplier, are fully configurable. This flexibility allows you to adjust the indicator to suit different markets or trading styles.
Disclaimer:
This script is provided for educational purposes only. Always perform your own analysis and backtesting before trading with live capital.

Alex JMA RSX Clone with Price & Divergence [LazyBear]Indicator Description:
RSX Indicator (RSXC_LB): This script is based on a clone of the JMA RSX (Relative Strength Index clone by LazyBear). It is a momentum-based indicator that helps identify overbought and oversold levels, as well as potential trend reversals.
Functional Changes:
Convergence is now marked with a white line on the RSX plot.
Bullish Divergence is marked with a green line, indicating potential upward movement.
Bearish Divergence is marked with a red line, indicating potential downward movement.
The default state is marked with a blue line.
Strong Divergences (both bullish and bearish) are highlighted with triangle markers on the chart.
Updated Features:
The script now visualizes convergence and divergence more clearly using distinct colors:
White: Convergence (indicates potential trend strength).
Green: Bullish divergence (possible price increase).
Red: Bearish divergence (possible price decrease).
Blue: Neutral/default state.
Triangle markers indicate strong divergences, making it easier for the user to spot critical moments.
This visual enhancement aims to provide clearer and more intuitive signals for traders using the RSX indicator, helping them identify trend changes and reversals more effectively.

Cumulative Volume Delta DivergenceThe Cumulative Volume Delta Divergence is an indicator that helps traders visually assess the buying and selling pressures in the market by analyzing volume divergences over time. This indicator overlays directly on the price chart, offering insights into how volume shifts correlate with price movements.
Utility and Trading Benefit
Divergence Detection
The primary utility of this indicator lies in its ability to detect divergences between volume trends and price movements. Such divergences can signal potential price reversals, providing traders with early warnings about shifts in market sentiment.
Enhanced Decision Making
By integrating volume analysis directly with price action on the chart, the indicator aids traders in making more informed decisions regarding entry and exit points. This can be crucial for capitalizing on trends or avoiding potential losses.

Altcoin Total Average Divergence (YavuzAkbay)The "Average Price and Divergence" indicator is a strong tool built exclusively for cryptocurrency traders who understand the significance of comparing altcoins to Bitcoin (BTC). While traditional research frequently focusses on the value of cryptocurrencies against fiat currencies such as the US dollar, this indicator switches the focus to the value of altcoins against Bitcoin itself, allowing you to detect potential market opportunities and divergences.
The indicator allows you to compare the price of an altcoin to Bitcoin (e.g., ETHBTC, SOLBTC), which is critical for determining how well an altcoin performs against the main cryptocurrency. This is especially important for investors who expect Bitcoin's price will continue to rise logarithmically and want to ensure that their altcoin holdings retain or expand in market capitalisation compared to Bitcoin.
The indicator computes the average price of the chosen cryptocurrency relative to Bitcoin over the viewable portion of the chart. This average acts as a benchmark, indicating the normal value around which the altcoin's price moves.
The primary objective of this indicator is to calculate and plot the divergence, which is the difference between the altcoin's current price relative to Bitcoin and its average value. This divergence can reveal probable overbought or oversold conditions, allowing traders to make better decisions about entry and exit points.
The divergence is represented as a histogram, with bars representing the magnitude of the difference between the current and average prices. Positive values indicate that the altcoin is trading above its average value in comparison to Bitcoin, whereas negative values indicate that it is trading below its average.
The indicator automatically adjusts to the chart's visible range, ensuring that the average price and divergence are always calculated using the most relevant data. This makes the indicator extremely sensitive to changes in the chart view and market conditions.
How to Use:
A significant positive divergence may imply that the cryptocurrency is overbought in comparison to Bitcoin and is headed for a correction. A significant negative divergence, on the other hand, may indicate that the cryptocurrency has been oversold and is cheap in comparison to Bitcoin.
Tracking how an altcoin's price deviates from its average relative to Bitcoin can provide insights about the market's opinion towards that altcoin. Persistent positive divergence may suggest high market confidence, whilst constant negative divergence may imply a lack of interest or eroding fundamentals.
Use divergence data to better time your trades, either by entering when a cryptocurrency is discounted in comparison to its average (negative divergence) or departing when it is overpriced (positive divergence). This allows you to capture value as the price returns to its mean.
Ideal For:
Cryptocurrency Traders who want to understand how altcoins are performing relative to Bitcoin rather than just against fiat currencies.
Long-term Investors looking to ensure their altcoin investments are maintaining or growing their value relative to Bitcoin.
Market Analysts interested in identifying potential reversals or continuations in altcoin prices based on divergence from their average value relative to Bitcoin.

Fusion Traders - RSI Overbought/Oversold + Divergence IndicatorFusion Traders - RSI Overbought/Oversold + Divergence Indicator - new version
This indicator has lots of various add ons.
RSI overbought / oversold with changeable inputs
Divergence indicator
DESCRIPTION:
This script combines the Relative Strength Index ( RSI ), Moving Average and Divergence indicator to make a better decision when to enter or exit a trade.
- The Moving Average line (MA) has been made hidden by default but enhanced with an RSIMA cloud.
- When the RSI is above the selected MA it turns into green and when the RSI is below the select MA it turns into red.
- When the RSI is moving into the Overbought or Oversold area, some highlighted areas will appear.
- When some divergences or hidden divergences are detected an extra indication will be highlighted.
- When the divergence appear in the Overbought or Oversold area the more weight it give to make a decision.
- The same colour pallet has been used as the default candlestick colours so it looks familiar.
HOW TO USE:
The prerequisite is that we have some knowledge about the Elliot Wave Theory, the Fibonacci Retracement and the Fibonacci Extension tools.
We are hoping you like this indicator and added to your favourite indicators. If you have any question then comment below, and I'll do my best to help.
FEATURES:
• You can show/hide the RSI .
• You can show/hide the MA.
• You can show/hide the lRSIMA cloud.
• You can show/hide the Stoch RSI cloud.
• You can show/hide and adjust the Overbought and Oversold zones.
• You can show/hide and adjust the Overbought Extended and Oversold Extended zones.
• You can show/hide the Overbought and Oversold highlighted zones.
HOW TO GET ACCESS TO THE SCRIPT:
• Favorite the script and add it to your chart.
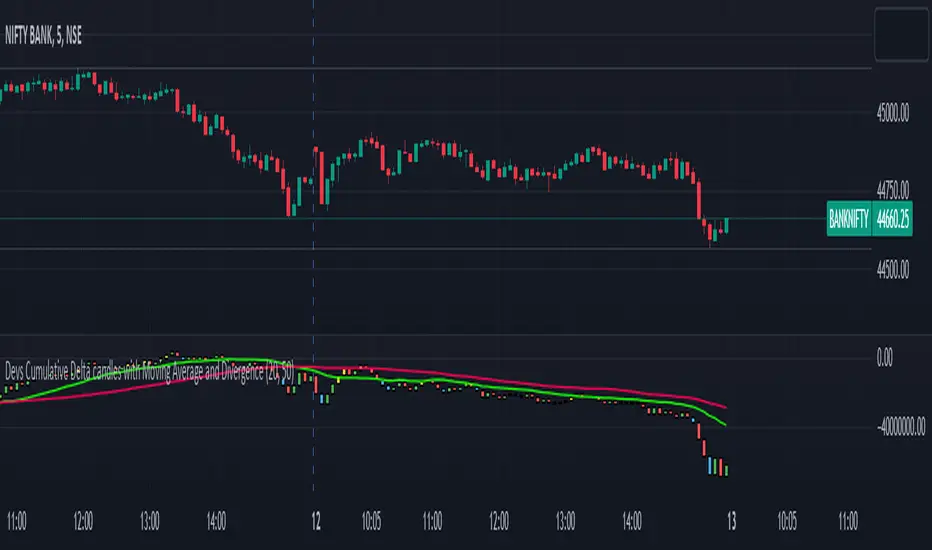
Devs Cumulative Delta candles with Moving Average and DivergenceDELTA = BUY Volume – SELL Volumes
Delta = Positive => Aggressiveness on the Buy side
Delta = Negative => Aggressiveness on the Sell side
If delta is greater than 0 you have more buying than selling pressure. If delta is less than 0, you have more selling than buying pressure.
When there is more Buying than Selling (Delta=Positive), the price candle is Green and when there is more Selling than Buying (Delta=Negative), the price candle is Red. We use delta to understand the relationship between buying or selling pressure and price.
Let’s imagine a price bar that reached the low for the day but delta was actually positive and the bar closed higher than it opened.
In simple terms we can describe this as:
Price made a new low
The bar closed higher
Delta demonstrated more buying than selling : Volume delta is a key metric to understand when making trading decisions based on volume and order flow. However, on its own it can be too much information to interpret quickly when trading in a volatile market.
What are Delta Bars?
Delta Bars is a candlestick representation of Delta. In other words, it has an Open, High (also called Delta Max), Low (also called Delta Min) and Close point in every candle (1min, 5min, 30min etc.)
The Delta Open in every candle is always 0
The Delta Close is the cumulative BUY less cumulative SELL at the close if the candle
The Delta Max is the maximum value of Delta during the candle session (lowest Delta Max possible = 0)
The Delta Min is the minimum value of Delta during the candle session (highest Delta Min possible = 0) The Delta bars are uncorrelated to the Tick Multiplier of the symbol.
Generally you would expect Price to move UP when Delta is positive and Price to move DOWN when Delta is negative. So what happens when the above rule is not followed. We have Divergence
Divergence:
Any two parameters that should be in sync (Price and Delta in this case) towards supporting a particular move (Up or Down) but are in reality not (in sync) form a Divergence
Cumulative volume delta takes the delta values for every bar and successively adds them together to visually provide as seen in the chart.
While volume delta is great for comparing delta bar to bar, cumulative volume delta is useful when determining buying or selling pressure at different price levels such as swing highs or lows. I just gave you a details regarding delta and delta bars.
What details would you see in the indicator??
When you apply this indicator on the chart, you will find the CD(Cumulative delta) candles, which move up and down the way price moves in a chart. Moreover, in case of a divergence, you will find a change in colour of delta candles. If the price is still green but the delta is negative, you will find a bullish divergence, marked with Yellow colour and if the price is red and you have a positive delta, you will have a bearish divergence, marked with blue coloured delta candle. Usually it has been seen that a repeated divergence generally depicts end of a trend or slow down of a trend.
Moreover, I have placed 2 moving averages in the script which you can customize as per your needs. I prefer 20 and 50 day MA for better accuracy as most reversals happen at 20 and 50 day MA.
This indicator works in almost all index, stocks, currencies excepting few where the volume past is invisible. This indicator purely works taking the buying and selling volume into consideration. Sometimes when you change the timeframe in chart, you may have to manually adjust for the display in chart.
Volume Accumulation Oscillator (VAO)The Volume Accumulation Oscillator (VAO) is a powerful momentum-based indicator designed to assess the strength of volume accumulation in a given asset. It helps traders identify periods of intense buying or selling pressure and potential trend reversals.
The VAO calculates the Net Volume Accumulation (NVA) by considering the volume, open, close, high, and low prices. It then applies exponential moving averages (EMAs) to smooth the NVA and calculates the VAO by comparing the smoothed NVA with its EMA over a specified signal period.
The VAO is plotted as a line chart, providing a clear visual representation of its values. Positive VAO values indicate strong bullish volume accumulation, suggesting potential upward price movement. Conversely, negative VAO values indicate significant selling pressure and the possibility of a downtrend.
To enhance the analysis, the indicator includes reference levels such as the zero line and +/-1 levels. These levels serve as important reference points for interpreting the VAO values and identifying key turning points in the market.
Additionally, the VAO histogram is included, which further illustrates the strength and direction of volume accumulation. The histogram bars are color-coded, with green bars representing positive VAO values and red bars representing negative VAO values.
The Volume Accumulation Oscillator is a versatile tool that can be used in various trading strategies. Traders can look for divergences between the VAO and the price chart to identify potential trend reversals. Combining the VAO with other technical analysis techniques can provide valuable insights into market dynamics and help traders make informed trading decisions.
Note: It is recommended to customize the indicator's parameters and conduct thorough backtesting to align it with your specific trading strategy and preferences before using it for live trading.
Disclaimer: This indicator is provided for educational and informational purposes only. Trading involves risks, and it is important to exercise caution and conduct your own analysis before making any investment decisions.

Overlay - HARSI + Divergences // All credit to © //@author=JayRogers & VuManChu Cipher B for their original Scripts (Open Source)
/ ====== ABOUT THIS INDICATOR
// I've combined some part of the code of the following indicators to get some alerts based on the Idea and Use section below :
// - RSI based Heikin Ashi candle oscillator
// - Divergence based on the VuManChu Cipher B
// -- This is the OVERLAY Version
//
// ====== ARTICLES and FURTHER READING
//
// - www.investopedia.com
//
// "Heikin-Ashi is a candlestick pattern technique that aims to reduce
// some of the market noise, creating a chart that highlights trend
// direction better than typical candlestick charts"
//
// ====== IDEA AND USE
// - The use of the HA RSI indicator when in the OverSold and OverBought
// area combined to a Divergence & a OB/OS buy/sell
// on the Cipher B by VuManChu.
// Can be useful as a confluence at S/R levels.
// *** Tip = 1 minute timeframe seems to work the best on FOREX
//
// *** Alerts :
// - The Divergence alert needs 2 bar to calculate,
// so alerts and dots as well, it will be placed on the right spot on
// the chart as per the offset added.
// - Use "Once Per Bar" for the alert, not per bar close, or you would
// have 1 extra bar delay
//
// ** Contributions : Remodel some part of the original script in order to get :
// --> Total conditions for an alert and a dot to display, resumed :
// - Buy/Sell in OB/OS
// - Divergence Buy/Sell
// - RSI Overlay is in OB/OS on current bar (or was the bar before)
// when both Buy/Sell dots from VMC appears.
//
// ====== DISCLAIMER
// For Tradingview & Pinescript moderators =
// This follow a strategy where RSI Overlay from @JayRogers script shall be
// in OB/OS zone, while combining it with the VuManChu Cipher B Divergences
// Buy&Sell + Buy/sell alerts In OB/OS areas.
// Any trade decisions you make are entirely your own responsibility.
//
// Thanks to dynausmaux for the code
// Thanks to falconCoin for inspired me to start this.
// Thanks to LazyBear for WaveTrend Oscillator
// Thanks to RicardoSantos for

HARSI + Divergences// All credit to © //@author=JayRogers & VuManChu Cipher B for their original Scripts (Open Source)
/ ====== ABOUT THIS INDICATOR
// I've combined some part of the code of the following indicators to get some alerts based on the Idea and Use section below :
// - RSI based Heikin Ashi candle oscillator
// - Divergence based on the VuManChu Cipher B
//
// ====== ARTICLES and FURTHER READING
//
// - www.investopedia.com
//
// "Heikin-Ashi is a candlestick pattern technique that aims to reduce
// some of the market noise, creating a chart that highlights trend
// direction better than typical candlestick charts"
//
// ====== IDEA AND USE
// - The use of the HA RSI indicator when in the OverSold and OverBought
// area combined to a Divergence & a OB/OS buy/sell
// on the Cipher B by VuManChu.
// Can be useful as a confluence at S/R levels.
// *** Tip = 1 minute timeframe seems to work the best on FOREX
//
// *** Alerts :
// - The Divergence alert needs 2 bar to calculate,
// so alerts and dots as well, it will be placed on the right spot on
// the chart as per the offset added.
// - Use "Once Per Bar" for the alert, not per bar close, or you would
// have 1 extra bar delay
//
// ** Contributions : Remodel some part of the original script in order to get :
// --> Total conditions for an alert and a dot to display, resumed :
// - Buy/Sell in OB/OS
// - Divergence Buy/Sell
// - RSI Overlay is in OB/OS on current bar (or was the bar before)
// when both Buy/Sell dots from VMC appears.
//
// ====== DISCLAIMER
// For Tradingview & Pinescript moderators =
// This follow a strategy where RSI Overlay from @JayRogers script shall be
// in OB/OS zone, while combining it with the VuManChu Cipher B Divergences
// Buy&Sell + Buy/sell alerts In OB/OS areas.
// Any trade decisions you make are entirely your own responsibility.
//
// Thanks to dynausmaux for the code
// Thanks to falconCoin for inspired me to start this.
// Thanks to LazyBear for WaveTrend Oscillator
// Thanks to RicardoSantos for

KINSKI RSI/RSX DivergenceThe Relative Strength Index (RSI) is a momentum indicator that measures the magnitude of recent price changes to analyse overbought or oversold conditions. RSI values range from 0 to 100.
The Relative Strength Index (RSI) is calculated using the following formula: RSI = 100 - 100 / (1 + RS) Where RS = average gain of upward phases during the specified time frame / average loss of downward phases during the specified time frame.
An asset price is considered overbought (due for a correction) if the RSI is above 70 and oversold (due for a recovery) if it is below 30. More extreme values (80/20) are also used to avoid false readings.
In a strong uptrend, the RSI often reaches 70 and above for long periods, and downtrends can remain at 30 or below for long periods.
Divergence detection in RSI is one of the important functions of this indicator. The reason is that an RSI divergence is a more reliable signal than the overbought and oversold indicators themselves. You will get overbought and oversold signals all the time. However, the divergence is a rare event.
In general, RSI divergence means that the RSI indicator is moving in the opposite direction compared to the price. So while the price is moving, the RSI is telling us in advance to expect a change in direction.
Positive RSI divergence
A positive RSI divergence is when the price trend has lower lows and lower highs, while the RSI indicator does the opposite - higher highs and higher lows. The price continues to fall while the RSI indicator begins to rise.
Negative RSI divergence
Negative RSI divergence is the opposite of positive divergence. It applies to uptrends where the price reaches higher highs and higher lows. However, the RSI shows lower highs and lower lows - the price goes up but the RSI goes down. The price closes with higher highs and higher lows, while the RSI indicator does the opposite - lower lows and lower highs, confirming a negative divergence. As a result, there is a sharp decline in the price.
RSX Indicator - Base script: SharkCIA by Jaggedsoft (Linked in the source code)
The RSX is the noise-free variant of the more popular RSI oscillator. Typically, any indicator can be smoothed by applying a moving average. However, a major disadvantage of such a method is that there is a time lag between the indicator and the price. RSX Indicator attempts to do this without signal delay.
What distinguishes this indicator from others of this type?
Display of RSI indicator together/alone with RSX and RSI smoothed
display of the RSI indicator (option: "RSI: On/Off")
display of the RSX indicator (option: "RSX: On/Off")
display of the RSI indicator as smoothed version (option: "RSI Smoothed: On/Off")
offers the possibility to choose between different view variants
many settings for additional information, layout and divergence identification
enables completely new comparison possibilities and insights with the additional RSI variants
[Sisyphe] rsi divergences [RSI side]This indicator must be completed by rsi divergences
It plots rsi regular divergences until five levels back and prioritize the largest divergence.
[Sisyphe] rsi divergences [chart side]This indicator must be completed by rsi divergences
It plots rsi regular divergences until five levels back and prioritize the largest divergence.
Histogram (MACD) with DivergencesThe focus with this MACD plot is solely towards the Histogram .
MACD & Signal can be made visible, but is made invisible by default.
The brighter line (green-red) is derived from the 'usual' MACD, the initial settings are completely different though:
- Fast Length 1
- 'Slow' Length 7
This is Histogram (1)
When this line crosses the 0 - line, this can give a nice early BUY - SELL sign,
especially combined with the 2nd Histogram, which uses a Slow Length of 49.
This latter Histogram (2) is filled ("Area") with a green/orange colour.
When Histogram (2) cross the 0 - line, this is visible as a green/red 'Cross'
These "Crosses", compared with the candles, gives possible/probable Support/Resistance lines.
Example,
if you bought on 5 March (Green Cross), and sold on 14 July, you'd have a nice profit!
A nice green area filled Histogram (2) (above 0 - line) can be considered as very Bullish,
an orange area filled Histogram (2) (below 0 - line) can be considered as Bearish.
Histogram (1) line can be used for shorter term Buy - Sell trades, the larger Bullish/Bearish Trend (of Histogram (2)) taking into account!
(see yellow dotted lines on the image).
All this is combined with a "Divergence" plot (with thanks to "Coingrats" (and "BabyWhale83") for the hard work!)
The small, more bright Triangles are triggered by Histogram (1)
The larger Triangles are triggered by Histogram (2)
- Green Triangles are Bullish Divergences
- Red Triangles are Bearish Divergences
- White Triangles (pointing upwards/downwards) are Bullish/Bearish Hidden Divergences
Very importantly, always combine the Divergence Triangles with another tool for confirmation, for example a MACD or RSI which produced an extra confirmation.
The movement of Histogram (2) above or below the 0 - line can be a confirmation as well.
As default these 3 options are enabled (for me this gives better results):
Simple MA (Oscillator)
Simple MA (Signal Line)
Simple MA (Signal Line 2)
This indicator can be used with normal "Candles", "Line", or "Heikin Ashi" (gives some differences)
Hope this is original and helpful!
AlgoZ Smart Divergence [Trend Filtered]AlgoZ Smart Divergence is a precision entry tool designed to catch market reversals by analyzing Volume Divergence combined with Multi-Timeframe Trend Filtering. Unlike standard divergence indicators that signal on every minor price fluctuation, this script uses a strict set of filters to only present high-probability trade setups that align with the broader market trend.
This is the Free Edition of the AlgoZ Suite, focused on providing clean, non-repainting Buy and Sell signals based on institutional volume flow.
How It Works The script operates on a 3-step validation process:
Volume Divergence:
It detects anomalies where volume spikes relative to price action (e.g., Price makes a Lower Low, but Volume hits a Higher High).
HTF Trend Painting:
It analyzes a Higher Timeframe (Default: 3 Hours) to determine the macro trend. If the 3H trend is Bullish, the candles turn Green. If Bearish, they turn Red.
Color Match Filtering:
The script includes a smart filter that blocks signals that go against the trend. You will only see BUY signals when the candles are Green (Uptrend) and SELL signals when the candles are Red (Downtrend).
Key Features
Volume Divergence Engine:
Identifies hidden accumulation and distribution zones.
HTF Trend Coloring:
Automatically paints your chart based on Higher Timeframe breakouts (Default: 3-Hour Trend).
Smart Signal Filtering:
Toggles are available to "Only Show Signals Matching Candle Color," ensuring you never trade against the momentum.
EMA Trend Filter:
Includes a built-in 10-period EMA filter to further refine entries.
Volatility Filters:
Optional RSI and ADX filters are included to avoid trading during low-volatility "chop."
How to Use
For Longs (Buys):
Wait for the candles to turn Green (indicating the 3-Hour trend is up) and look for a BUY label. The price must also be above the 10 EMA (if enabled).
For Shorts (Sells):
Wait for the candles to turn Red (indicating the 3-Hour trend is down) and look for a SELL label.
Risk Management:
This script is designed to catch reversals. Always place your Stop Loss below the recent swing low (for buys) or above the swing high (for sells).
Settings
Higher Timeframe:
Default is set to 3 Hours (180 minutes). You can adjust this to 1 Day or 4 Hours depending on your trading style.
EMA Length:
Default is 10.
Color Match Filter:
On by default.

Primitive Delta DivergencePrimitive Delta Divergence
This indicator detects volume-price divergences by analyzing the relationship between price direction and volume bias over a rolling lookback period, revealing potential momentum shifts before they become apparent in price action alone.
Instead of relying solely on price movements, you can identify moments when volume sentiment contradicts price direction — a core concept borrowed from footprint chart analysis, adapted for traditional bar charts.
For example, when price moves higher but volume is predominantly bearish, or when price declines while volume shows bullish accumulation.
🔹 How it works
Lookback Period (n) → defines the rolling window for analyzing price and volume relationships
Creates a "meta-candle" from the lookback period, comparing its open vs. close for price bias
Volume classification → separates each bar's volume into bullish (green candles), bearish (red candles), or neutral (doji candles)
Volume bias calculation → generates a continuous score (-1 to +1) representing the directional volume pressure
Plots divergence signals when price direction and volume bias disagree
🔹 Use cases
Spot early momentum exhaustion when price and volume move in opposite directions
Identify potential reversal zones where volume suggests underlying weakness or strength
Enhance entry/exit timing by incorporating volume-based confirmation alongside price action
Apply footprint-style analysis to any timeframe without specialized charting tools
✨ Primitive Delta Divergence reveals the hidden story volume tells about price, uncovering divergences that traditional indicators might miss.
QFisher-R™ [ParadoxAlgo]QFISHER-R™ (Regime-Aware Fisher Transform)
A research/education tool that helps visualize potential momentum exhaustion and probable inflection zones using a quantitative, non-repainting Fisher framework with regime filters and multi-timeframe (MTF) confirmation.
What it does
Converts normalized price movement into a stabilized Fisher domain to highlight potential turning points.
Uses adaptive smoothing, robust (MAD/quantile) thresholds, and optional MTF alignment to contextualize extremes.
Provides a Reversal Probability Score (0–100) to summarize signal confluence (extreme, slope, cross, divergence, regime, and MTF checks).
Key features
Non-repainting logic (bar-close confirmation; security() with no lookahead).
Dynamic exhaustion bands (data-driven thresholds vs fixed ±2).
Adaptive smoothing (efficiency-ratio based).
Optional divergence tags on structurally valid pivots.
MTF confirmation (same logic computed on a higher timeframe).
Compact visuals with subtle plotting to reduce chart clutter.
Inputs (high level)
Source (e.g., HLC3 / Close / HA).
Core lookback, fast/slow range blend, and ER length.
Band sensitivity (robust thresholding).
MTF timeframe(s) and agreement requirement.
Toggle divergence & intrabar previews (default off).
Signals & Alerts
Turn Candidate (Up/Down) when multiple conditions align.
Trade-Grade Turn when score ≥ threshold and MTF agrees.
Divergence Confirmed when structural criteria are met.
Alerts are generated on confirmed bar close by default. Optional “preview” mode is available for experimentation.
How to use
Start on your preferred timeframe; optionally enable an HTF (e.g., 4×) for confirmation.
Look for RPS clusters near the exhaustion bands, slope inflections, and (optionally) divergences.
Combine with your own risk management, liquidity, and trend context.
Paper test first and calibrate thresholds to your instrument and timeframe.
Notes & limitations
This is not a buy/sell signal generator and does not predict future returns.
Readings can remain extreme during strong trends; use HTF context and your own filters.
Parameters are intentionally conservative by default; adjust carefully.
Compliance / Disclaimer
Educational & research tool only. Not financial advice. No recommendation to buy/sell any security or derivative.
Past performance, backtests, or examples (if any) are not indicative of future results.
Trading involves risk; you are responsible for your own decisions and risk management.
Built upon the Fisher Transform concept (Ehlers); all modifications, smoothing, regime logic, scoring, and visualization are original work by Paradox Algo.

🧪 Yuri Garcia Smart Money Strategy FULL (Slope Divergence))📣 Yuri Garcia – Smart Money Strategy FULL
This is my private Smart Money Concept strategy, designed for my family and community to learn, trade, and grow sustainably.
🔑 How it works:
✅ Volume Cluster Zones: Automatically detects areas where strong buyers or sellers concentrate, acting as dynamic S/R levels.
✅ HTF Institutional Zones (4H): Higher timeframe trend filter ensures you’re always trading in the direction of major flows.
✅ Wick Pullback Filter: Confirms price rejects the zone, catching smart money traps and reversals.
✅ Cumulative Delta (CVD): Confirms whether buyers or sellers are truly in control.
✅ Slope-Based Divergence: Optional hidden divergence between price & CVD to spot reversals others miss.
✅ ATR Dynamic SL/TP: Adapts stop loss and take profit to live volatility with adjustable risk/reward.
🧩 Visual Markers Explained:
🟦 Blue X: Price inside HTF zone
🟨 Yellow X: Price inside Volume Cluster zone
🟧 Orange Circle: Wick pullback detected
🟥 Red Square: CVD confirms order flow strength
🔼 Aqua Triangle Up: Bullish slope divergence
🔽 Purple Triangle Down: Bearish slope divergence
🟢 Green Triangle Up: Final Long Entry confirmed
🔴 Red Triangle Down: Final Short Entry confirmed
⚡ Who is this for?
This strategy is best suited for traders who understand smart money concepts, order flow, and want an adaptive framework to trade major assets like BTC, Gold, SP500, NASDAQ, or FX pairs.
🔒 Important
Use responsibly, backtest extensively, and combine with solid risk management. This is for educational purposes only.
✨ Credits
Built with ❤️ by Yuri Garcia – dedicated to my family & community.
✅ How to use it
1️⃣ Add to chart
2️⃣ Adjust inputs for your asset & timeframe
3️⃣ Enable/disable slope divergence filter to match your style
4️⃣ Set your alerts with built-in conditions

RSI Divergence Indicator - Trading VidhyalayaThis indicator automatically identifies RSI-based bullish and bearish divergences and visually marks them directly on the candlestick chart, making it easier for traders to spot potential reversals.
✅ Key Features:
Bullish Divergence
When the price makes a lower low, but the RSI makes a higher low, the indicator highlights the candle with a green arrow or label to signal potential upward reversal.
Bearish Divergence
When the price makes a higher high, but the RSI forms a lower high, the indicator marks the candle with a red arrow or label to indicate a possible downside move.
Real-time Detection
Divergences are plotted in real-time, helping traders react quickly to changing market conditions.
Candlestick Overlay
Signals are shown directly on the chart, rather than below in a separate panel, allowing for faster and clearer decision-making.
📊 Benefits:
Helps in identifying early trend reversals
Works well with other indicators like MACD, Moving Averages, or Volume
Great for both beginners and advanced traders
Saves time by automating divergence spotting, reducing manual errors
