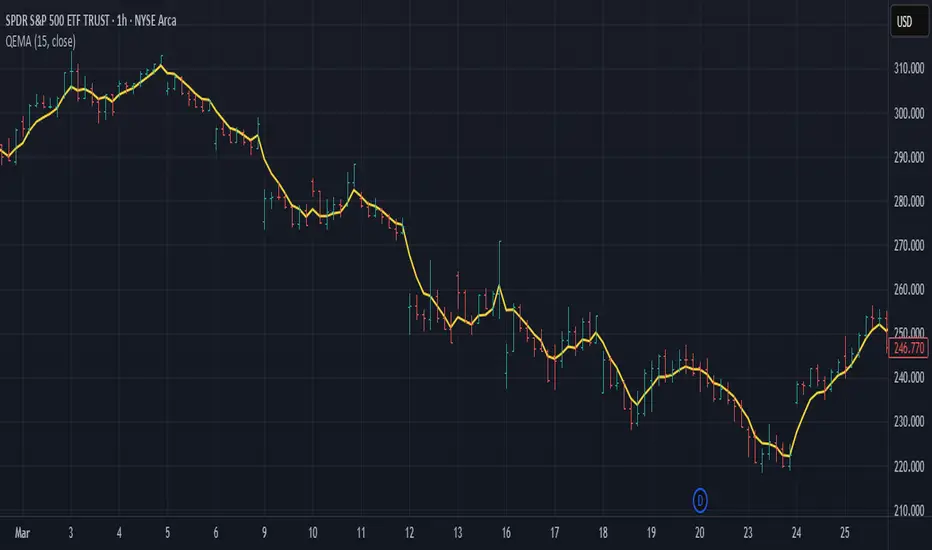
Quadruple EMA (QEMA)The Quadruple Exponential Moving Average (QEMA) is an advanced technical indicator that extends the concept of lag reduction beyond TEMA (Triple Exponential Moving Average) to a fourth order. By applying a sophisticated four-stage EMA cascade with optimized coefficient distribution, QEMA provides the ultimate evolution in EMA-based lag reduction techniques.
Unlike traditional compund moving averages like DEMA and TEMA, QEMA implements a progressive smoothing system that strategically distributes alphas across four EMA stages and combines them with balanced coefficients (4, -6, 4, -1). This approach creates an indicator that responds extremely quickly to price changes while still maintaining sufficient smoothness to be useful for trading decisions. QEMA is particularly valuable for traders who need the absolute minimum lag possible in trend identification.
▶️ **Core Concepts**
Fourth-order processing: Extends the EMA cascade to four stages for maximum possible lag reduction while maintaining a useful signal
Progressive alpha system: Uses mathematically derived ratio-based alpha progression to balance responsiveness across all four EMA stages
Optimized coefficients: Employs calculated weights (4, -6, 4, -1) to effectively eliminate lag while preserving compound signal stability
Numerical stability control: Implements initialization and alpha distribution to ensure consistent results from the first calculation bar
QEMA achieves its exceptional lag reduction by combining four progressive EMAs with mathematically optimized coefficients. The formula is designed to maximize responsiveness while minimizing the overshoot problems that typically occur with aggressive lag reduction techniques. The implementation uses a ratio-based alpha progression that ensures each EMA stage contributes appropriately to the final result.
▶️ **Common Settings and Parameters**
Period: Default: 15| Base smoothing period | When to Adjust: Decrease for extremely fast signals, increase for more stable output
Alpha: Default: auto | Direct control of base smoothing factor | When to Adjust: Manual setting allows precise tuning beyond standard period settings
Source: Default: Close | Data point used for calculation | When to Adjust: Change to HL2 or HLC3 for more balanced price representation
Pro Tip: Professional traders often use QEMA with longer periods than other moving averages (e.g., QEMA(20) instead of EMA(10)) since its extreme lag reduction provides earlier signals even with longer periods.
▶️ **Calculation and Mathematical Foundation**
Simplified explanation:
QEMA works by calculating four EMAs in sequence, with each EMA taking the previous one as input. It then combines these EMAs using balancing weights (4, -6, 4, -1) to create a moving average with extremely minimal lag and high level of smoothness. The alpha factors for each EMA are progressively adjusted using a mathematical ratio to ensure balanced responsiveness across all stages.
Technical formula:
QEMA = 4 × EMA₁ - 6 × EMA₂ + 4 × EMA₃ - EMA₄
Where:
EMA₁ = EMA(source, α₁)
EMA₂ = EMA(EMA₁, α₂)
EMA₃ = EMA(EMA₂, α₃)
EMA₄ = EMA(EMA₃, α₄)
α₁ = 2/(period + 1) is the base smoothing factor
r = (1/α₁)^(1/3) is the derived ratio
α₂ = α₁ × r, α₃ = α₂ × r, α₄ = α₃ × r are the progressive alphas
Mathematical Rationale for the Alpha Cascade:
The QEMA indicator employs a specific geometric progression for its smoothing factors (alphas) across the four EMA stages. This design is intentional and aims to optimize the filter's performance. The ratio between alphas is **r = (1/α₁)^(1/3)** - derived from the cube root of the reciprocal of the base alpha.
For typical smoothing (α₁ < 1), this results in a sequence of increasing alpha values (α₁ < α₂ < α₃ < α₄), meaning that subsequent EMAs in the cascade are progressively faster (less smoothed). This specific progression, when combined with the QEMA coefficients (4, -6, 4, -1), is chosen for the following reasons:
1. Optimized Frequency Response:
Using the same alpha for all EMA stages (as in a naive multi-EMA approach) can lead to an uneven frequency response, potentially causing over-shooting of certain frequencies or creating undesirable resonance. The geometric progression of alphas in QEMA helps to create a more balanced and controlled filter response across a wider range of movement frequencies. Each stage's contribution to the overall filtering characteristic is more harmonized.
2. Minimized Phase Lag:
A key goal of QEMA is extreme lag reduction. The specific alpha cascade, particularly the relationship defined by **r**, is designed to minimize the cumulative phase lag introduced by the four smoothing stages, while still providing effective noise reduction. Faster subsequent EMAs contribute to this reduced lag.
🔍 Technical Note: The ratio-based alpha progression is crucial for balanced response. The ratio r is calculated as the cube root of 1/α₁, ensuring that the combined effect of all four EMAs creates a mathematically optimal response curve. All EMAs are initialized with the first source value rather than using progressive initialization, eliminating warm-up artifacts and providing consistent results from the first bar.
▶️ **Interpretation Details**
QEMA provides several key insights for traders:
When price crosses above QEMA, it signals the beginning of an uptrend with minimal delay
When price crosses below QEMA, it signals the beginning of a downtrend with minimal delay
The slope of QEMA provides immediate insight into trend direction and momentum
QEMA responds to price reversals significantly faster than other moving averages
Multiple QEMA lines with different periods can identify immediate support/resistance levels
QEMA is particularly valuable in fast-moving markets and for short-term trading strategies where speed of signal generation is critical. It excels at capturing the very beginning of trends and identifying reversals earlier than any other EMA-derived indicator. This makes it especially useful for breakout trading and scalping strategies where getting in early is essential.
▶️ **Limitations and Considerations**
Market conditions: Can generate excessive signals in choppy, sideways markets due to its extreme responsiveness
Overshooting: The aggressive lag reduction can create some overshooting during sharp reversals
Calculation complexity: Requires four separate EMA calculations plus coefficient application, making it computationally more intensive
Parameter sensitivity: Small changes in the base alpha or period can significantly alter behavior
Complementary tools: Should be used with momentum indicators or volatility filters to confirm signals and reduce false positives
▶️ **References**
Mulloy, P. (1994). "Smoothing Data with Less Lag," Technical Analysis of Stocks & Commodities .
Ehlers, J. (2001). Rocket Science for Traders . John Wiley & Sons.
在腳本中搜尋"Exponential Moving Average"
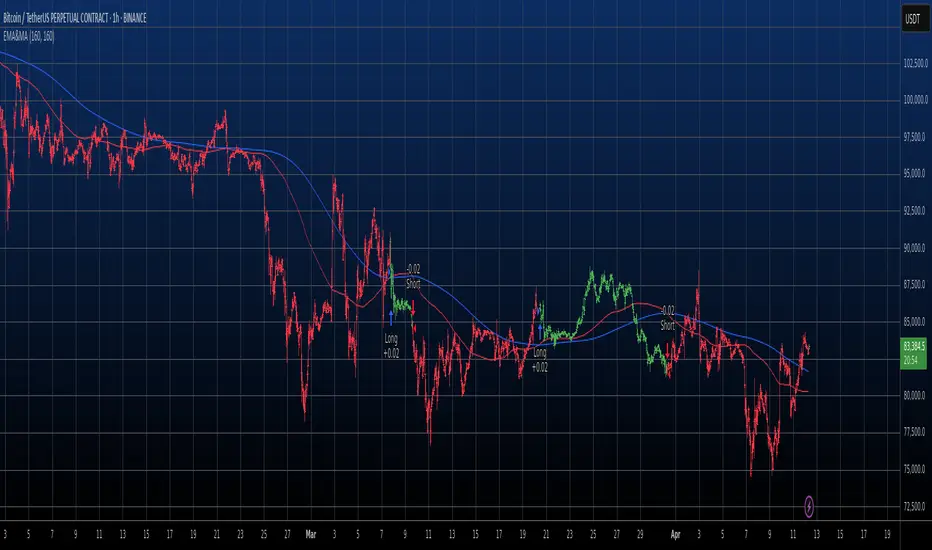
EMA & MA Crossover StrategyGuys, you asked, we did. Strategy for crossing moving averages .
The Moving Average Crossover trading strategy is possibly the most popular
trading strategy in the world of trading. First of them were written in the
middle of XX century, when commodities trading strategies became popular.
This strategy is a good example of so-called traditional strategies.
Traditional strategies are always long or short. That means they are never
out of the market. The concept of having a strategy that is always long or
short may be scary, particularly in today’s market where you don’t know what
is going to happen as far as risk on any one market. But a lot of traders
believe that the concept is still valid, especially for those of traders who
do their own research or their own discretionary trading.
This version uses crossover of moving average and its exponential moving average.
Strategy parameters:
Take Profit % - when it receives the opposite signal
Stop Loss % - when it receives the opposite signal
Current Backtest:
Account: 1000$
Trading size: 0.01
Commission: 0.05%
WARNING:
- For purpose educate only
- This script to change bars colors.
EMA 21 and SMA 50 Low ConditionsDescription:
This indicator highlights trend zones on a daily chart using the 21-day Exponential Moving Average (EMA) and 50-day Simple Moving Average (SMA). It’s designed to identify bullish conditions with two distinct background colors:
• Green Background: Signals a strong bullish trend. Appears when the low of the candle stays above the 21 EMA for 3 or more consecutive days, with either the 3rd or 4th day closing higher than its open (an “up” day). The green zone persists until a candle closes below the 21 EMA.
• Yellow Background: Indicates a potential support zone. Triggers when the low of the candle remains above the 50 SMA after the green condition ends, suggesting the price is still holding above a longer-term average. The yellow zone lasts until a candle closes below the 50 SMA.
Features:
• Plots the 21 EMA (blue line) and 50 SMA (orange line) for visual reference.
• Uses background colors to mark trend zones, making it easy to spot bullish phases and support levels.
• Optimized for daily timeframes, ideal for swing traders or long-term trend followers.
How to Use:
1. Apply the indicator to a daily chart.
2. Watch for the green background to identify strong bullish momentum (lows holding above the 21 EMA with an up close confirmation).
3. Look for the yellow background as a sign of potential support after the short-term trend weakens (lows above the 50 SMA).
4. Exit zones are triggered by closes below the respective averages (21 EMA for green, 50 SMA for yellow).
Notes:
• Best used on symbols with sufficient historical data to ensure accurate EMA and SMA calculations.
• The indicator prioritizes the green condition over yellow—green will override if both could apply.
Author’s Intent:
Created to help traders visualize sustained bullish trends and key support levels using simple moving average rules. Perfect for confirming uptrends and monitoring pullbacks within a broader bullish context.

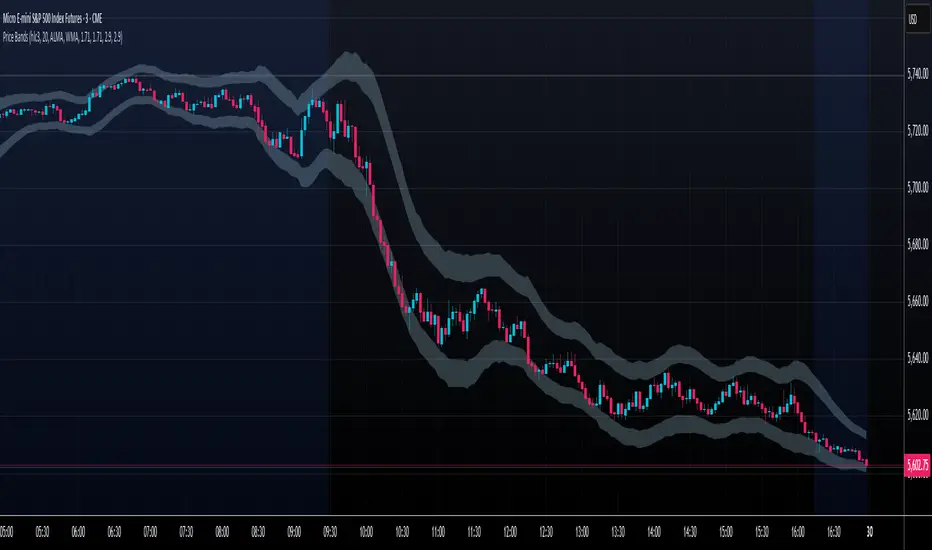
Price Extreme BandsPrice Extreme Bands Description
This indicator calculates and displays Price Extreme Bands based on an Exponential Moving Average (EMA) and True Range Average True Range (TR ATR). It utilizes a custom "Super Smoother" function to smooth the bands, providing a clearer representation of potential price extremes without sacrificing accuracy.
Usage
Built for specifically for intraday timeframes, this indicator identifies short term price extremes and volatility ranges. Traders can observe when price moves towards the outer bands, suggesting strong momentum or potential overbought/oversold conditions. The filled zones highlight areas of increased volatility which can used as exit criteria for a trade, possible reversal points in ranging markets or price ranges where price momentum could slow in trending markets.
Key Features
Length Input: Controls the length of the EMA and TR ATR calculations.
Multiplier Inputs: Uses two fixed multipliers (1.71 and 2.50) to create bands.
Super Smoother: Applies a custom smoothing function to the bands for reduced noise.
Fill Zones: Fills the areas between the inner and outer bands to highlight potential volatility ranges.
Calculation:
1. EMA (Basis): Calculates the Exponential Moving Average of the selected source.
2. TR ATR: Calculates the True Range and then smoothes it using RMA (Rolling Moving Average).
3. Bands: Calculates upper and lower bands using the EMA and ATR, with multipliers of 1.71 and 2.50.
4. Super Smoother: Applies a smoothing function to the calculated bands.
Visuals:
Basis Line: Plots the EMA (basis) (invisible by default).
Inner Bands (1.71 Multiplier): Plots the smoothed bands with a distinct color (e.g., orange) (invisible by default).
Outer Bands (2.50 Multiplier): Plots the smoothed bands with a different color (e.g., purple) (invisible by default).
Fill Zones: Fills the region between the inner and outer upper bands and the inner and outer lower bands with a translucent color (e.g. light blue).
// Note: The plot lines are invisible by default. To view the basis, upper and lower band lines, adjust the visibility settings in the indicator's settings.
Uniqueness: Ready of the box. Code and parameters built specifically for 1m to 15m timeframes provides users with an indicator to easily identify price extremes. The use of TR ATR and addition of the Super Smoother calculation create a easier visualization and implementation compared to existing price band options.
[F.B]_ZLEMA MACD ZLEMA MACD – A Zero-Lag Variant of the Classic MACD
Introduction & Motivation
The Moving Average Convergence Divergence (MACD) is a standard indicator for measuring trend strength and momentum. However, it suffers from the latency of traditional Exponential Moving Averages (EMAs).
This variant replaces EMAs with Zero Lag Exponential Moving Averages (ZLEMA), reducing delay and increasing the indicator’s responsiveness. This can potentially lead to earlier trend change detection, especially in highly volatile markets.
Calculation Methodology
2.1 Zero-Lag Exponential Moving Average (ZLEMA)
The classic EMA formula is extended with a correction factor:
ZLEMA_t = EMA(2 * P_t - EMA(P_t, L), L)
where:
P_t is the closing price,
L is the smoothing period length.
2.2 MACD Calculation Using ZLEMA
MACD_t = ZLEMA_short,t - ZLEMA_long,t
with standard parameters of 12 and 26 periods.
2.3 Signal Line with Adaptive Methodology
The signal line can be calculated using ZLEMA, EMA, or SMA:
Signal_t = f(MACD, S)
where f is the chosen smoothing function and S is the period length.
2.4 Histogram as a Measure of Momentum Changes
Histogram_t = MACD_t - Signal_t
An increasing histogram indicates a relative acceleration in trend strength.
Potential Applications in Data Analysis
Since the indicator is based solely on price time series, its effectiveness as a standalone trading signal is limited. However, in quantitative models, it can be used as a feature for trend quantification or for filtering market phases with strong trend dynamics.
Potential use cases include:
Trend Classification: Segmenting market phases into "trend" vs. "mean reversion."
Momentum Regime Identification: Analyzing histogram dynamics to detect increasing or decreasing trend strength.
Signal Smoothing: An alternative to classic EMA smoothing in more complex multi-factor models.
Important: Using this as a standalone trading indicator without additional confirmation mechanisms is not recommended, as it does not demonstrate statistical superiority over other momentum indicators.
Evaluation & Limitations
✅ Advantages:
Reduced lag compared to the classic MACD.
Customizable signal line smoothing for different applications.
Easy integration into existing analytical pipelines.
⚠️ Limitations:
Not a standalone trading system: Like any moving average, this indicator is susceptible to noise and false signals in sideways markets.
Parameter sensitivity: Small changes in period lengths can lead to significant signal deviations, requiring robust optimization.
Conclusion
The ZLEMA MACD is a variant of the classic MACD with reduced latency, making it particularly useful for analytical purposes where faster adaptation to price movements is required.
Its application in trading strategies should be limited to multi-factor models with rigorous evaluation. Backtests and out-of-sample analyses are essential to avoid overfitting to past market data.
Disclaimer: This indicator is provided for informational and educational purposes only and does not constitute financial advice. The author assumes no responsibility for any trading decisions made based on this indicator. Trading involves significant risk, and past performance is not indicative of future results.

Mile Runner - Swing Trade LONGMile Runner - Swing Trade LONG Indicator - By @jerolourenco
Overview
The Mile Runner - Swing Trade LONG indicator is designed for swing traders who focus on LONG positions in stocks, BDRs (Brazilian Depositary Receipts), and ETFs. It provides clear entry signals, stop loss, and take profit levels, helping traders identify optimal buying opportunities with a robust set of technical filters. The indicator is optimized for daily candlestick charts and combines multiple technical analysis tools to ensure high-probability trades.
Key Features
Entry Signals: Visualized as green triangles below the price bars, indicating a potential LONG entry.
Stop Loss and Take Profit Levels: Automatically plotted on the chart for easy reference.
Stop Loss: Based on the most recent pivot low (support level).
Take Profit: Calculated using a Fibonacci-based projection from the entry price to the stop loss.
Trend and Momentum Filters: Ensures trades align with the prevailing trend and have sufficient momentum.
Volume and Volatility Confirmation: Verifies market interest and price movement potential.
How It Works
The indicator uses a combination of technical tools to filter and confirm trade setups:
Exponential Moving Averages (EMAs):
A short EMA (default: 9 periods) and a long EMA (default: 21 periods) identify the trend.
A bullish crossover (EMA9 crosses above EMA21) signals a potential upward trend.
Money Flow Index (MFI):
Confirms buying pressure when MFI > 50.
Average True Range (ATR):
Ensures sufficient volatility by checking if ATR exceeds its 20-period moving average.
Volume:
Confirms market interest when volume exceeds its 20-period moving average.
Pivot Lows:
Identifies recent support levels (pivot lows) to set the stop loss.
Ensures the pivot low is recent (within the last 10 bars by default).
Additional Trend Filter:
Confirms the long EMA is rising, reinforcing the bullish trend.
Inputs and Customization
The indicator is highly customizable, allowing traders to tailor it to their strategies:
EMA Periods: Adjust the short and long EMA lengths.
ATR and MFI Periods: Modify lookback periods for volatility and momentum.
Pivot Lookback: Control the sensitivity of pivot low detection.
Fibonacci Level: Adjust the Fibonacci retracement level for take profit.
Take Profit Multiplier: Fine-tune the aggressiveness of the take profit target.
Max Pivot Age: Set the maximum bars since the last pivot low for relevance.
Usage Instructions
Apply the Indicator:
Add the "Mile Runner - Swing Trade LONG" indicator to your TradingView chart.
Best used on daily charts for swing trading.
Look for Entry Signals:
A green triangle below the price bar signals a potential LONG entry.
Set Stop Loss and Take Profit:
Stop Loss: Red dashed line indicating the stop loss level.
Take Profit: Purple dashed line showing the take profit level.
Monitor the Trade:
The entry price is marked with a green dashed line for reference.
Adjust trade management based on the plotted levels.
Set Alerts:
Use the built-in alert condition to get notified of new LONG entry signals.
Important Notes
For LONG Positions Only : Designed exclusively for swing trading LONG positions.
Timeframe: Optimized for daily charts but can be tested on other timeframes.
Asset Types: Works best with stocks, BDRs, and ETFs.
Risk Management: Always align stop loss and take profit levels with your risk tolerance.
Why Use Mile Runner?
The Mile Runner indicator simplifies swing trading by integrating trend, momentum, volume, and volatility filters into one user-friendly tool. It helps traders:
Identify high-probability entry points.
Establish clear stop loss and take profit levels.
Avoid low-volatility or low-volume markets.
Focus on assets with strong buying pressure and recent support.
By following its signals and levels, traders can make informed decisions and enhance their swing trading performance. Customize the inputs and test it on your favorite assets—happy trading!

Trend Strength & Direction📌 Assumptions of the "Trend Strength & Direction" Model
This model is designed to measure both trend strength and trend direction, using a modified version of the ADX (Average Directional Index) while also identifying ranging markets. Below is a detailed breakdown of all key assumptions.
1️⃣ Using ADX as the Basis for Trend Strength
Why ADX?
The ADX (Average Directional Index) is one of the most commonly used indicators for measuring trend strength, regardless of direction.
How is it calculated?
ATR (Average True Range) is used to normalize volatility.
Directional movement (+DM and -DM) is smoothed with an Exponential Moving Average (EMA) to obtain the +DI (Positive Directional Indicator) and -DI (Negative Directional Indicator).
Trend strength is derived by normalizing the absolute difference between +DI and -DI, divided by the sum of both.
🔹 Assumption: A high ADX means the trend is strong (whether bullish or bearish).
2️⃣ 50-Period Moving Average for Trend Strength
Why add a moving average?
ADX can be very volatile in the short term.
A 50-period SMA (Simple Moving Average) is used to smooth out trend strength and identify sustained trends.
🔹 Assumption: The SMA reduces false signals caused by short-term ADX spikes.
3️⃣ Identifying a Ranging Market (ADX Below 35)
How is a ranging market defined?
If the trend strength (ADX) is below 35, the market is considered "ranging".
The 35-level threshold is chosen empirically since ADX values below this level often indicate a lack of strong price direction.
When the market is ranging, the background color turns yellow.
🔹 Assumption: ADX < 35 indicates a sideways market, so the indicator colors the background yellow.
4️⃣ Determining Trend Direction Using +DI and -DI
How is direction determined?
If +DI > -DI, the trend is bullish (green).
If -DI > +DI, the trend is bearish (red).
If ADX is below 35, the market is ranging and turns yellow.
🔹 Assumption: Trend direction is determined by the relationship between +DI and -DI, not ADX values.
5️⃣ Background Color to Highlight Market Conditions
Yellow background if ADX < 35 → Ranging market.
Green background if ADX ≥ 35 and bullish.
Red background if ADX ≥ 35 and bearish.
🔹 Assumption: The background color visually differentiates trending vs. ranging phases.
6️⃣ Reference Levels for ADX
Lateral Threshold (35) → Below this, the trend is weak or ranging.
Neutral Threshold (50) → Intermediate level indicating moderate trend strength.
Strong Trend Threshold (75) → Above this, the trend is very strong and possibly overextended.
🔹 Assumption: ADX above 75 indicates a very strong trend, potentially near exhaustion.
🔹 Summary of Key Assumptions
1️⃣ ADX is the core strength metric → Strong trends when ADX > 35, weak below 35.
2️⃣ The 50-period SMA smooths out volatility → Prevents false signals.
3️⃣ Ranging markets are defined as ADX < 35 → Yellow background color.
4️⃣ Trend direction is based on +DI vs. -DI → Green = bullish, Red = bearish.
5️⃣ Background colors enhance readability → Helps distinguish different market phases.
6️⃣ ADX reference levels (35, 50, 75) indicate increasing trend strength.
Conclusion
This model combines ADX with a moving average and color-based logic to highlight trend strength, trend direction, and sideways markets. It helps traders quickly identify the best conditions for entering or exiting trades. 🚀

Consecutive Bars Above/Below EMA Buy the Dip Strategy█ STRATEGY DESCRIPTION
The "Consecutive Bars Above/Below EMA Buy the Dip Strategy" is a mean-reversion strategy designed to identify potential buying opportunities when the price dips below a moving average for a specified number of consecutive bars. It enters a long position when the dip condition is met and exits when the price shows strength by exceeding the previous bar's high. This strategy is suitable for use on various timeframes.
█ WHAT IS THE MOVING AVERAGE?
The strategy uses either a Simple Moving Average (SMA) or an Exponential Moving Average (EMA) as a reference for identifying dips. The type and length of the moving average can be customized in the settings.
█ SIGNAL GENERATION
1. LONG ENTRY
A Buy Signal is triggered when:
The close price is below the selected moving average for a specified number of consecutive bars (`consecutiveBarsTreshold`).
The signal occurs within the specified time window (between `Start Time` and `End Time`).
2. EXIT CONDITION
A Sell Signal is generated when the current closing price exceeds the high of the previous bar (`close > high `). This indicates that the price has shown strength, potentially confirming the reversal and prompting the strategy to exit the position.
█ ADDITIONAL SETTINGS
Consecutive Bars Threshold: The number of consecutive bars the price must remain below the moving average to trigger a Buy Signal. Default is 3.
MA Type: The type of moving average used (SMA or EMA). Default is SMA.
MA Length: The length of the moving average. Default is 5.
Start Time and End Time: The time window during which the strategy is allowed to execute trades.
█ PERFORMANCE OVERVIEW
This strategy is designed for mean-reverting markets and performs best when the price frequently oscillates around the moving average.
It is sensitive to the number of consecutive bars below the moving average, which helps to identify potential dips.
Backtesting results should be analysed to optimize the Consecutive Bars Threshold, MA Type, and MA Length for specific instruments.

BBSS+This Pine Script implements a custom indicator overlaying Bollinger Bands with additional features for trend analysis using Exponential Moving Averages (EMAs). Here's a breakdown of its functionality:
Bollinger Bands:
The script calculates the Bollinger Bands using a 20-period Simple Moving Average (SMA) as the basis and a multiplier of 2 for the standard deviation.
It plots the Upper Band and Lower Band in red.
EMA Calculations:
Three EMAs are calculated for the close price with periods of 5, 10, and 40.
The EMAs are plotted in green (5-period), cyan (10-period), and orange (40-period) to distinguish between them.
Trend Detection:
The script determines bullish or bearish EMA alignments:
Bullish Order: EMA 5 > EMA 10 > EMA 40.
Bearish Order: EMA 5 < EMA 10 < EMA 40.
Entry Signals:
Long Entry: Triggered when:
The close price crosses above the Upper Bollinger Band.
The Upper Band is above its 5-period SMA (indicating momentum).
The EMAs are in a bullish order.
Short Entry: Triggered when:
The close price crosses below the Lower Bollinger Band.
The Lower Band is below its 5-period SMA.
The EMAs are in a bearish order.
Trend State Tracking:
A variable tracks whether the market is in a Long or Short trend based on conditions:
A Long trend continues unless conditions for a Short Entry are met or the Upper Band dips below its average.
A Short trend continues unless conditions for a Long Entry are met or the Lower Band rises above its average.
Visual Aids:
Signal Shapes:
Triangle-up shapes indicate Long Entry points below the bar.
Triangle-down shapes indicate Short Entry points above the bar.
Bar Colors:
Green bars indicate a Long trend.
Red bars indicate a Short trend.
This script combines Bollinger Bands with EMA crossovers to generate entry signals and visualize market trends, making it a versatile tool for identifying momentum and trend reversals.

Advanced MA and MACD PercentageIntroduction
The "Advanced MA and MACD Percentage" indicator is a powerful and innovative tool designed to help traders analyze financial markets with ease and precision. This indicator combines Moving Averages (MA) with the MACD indicator to assess the market’s overall trend and calculate the percentage of buy and sell signals based on current data.
Features
Multi-Timeframe Analysis:
Allows selecting your preferred timeframe for trend analysis, such as minute, hourly, daily, or weekly charts.
Support for Multiple Moving Average Types:
Offers the option to use either Simple Moving Average (SMA) or Exponential Moving Average (EMA), based on user preference.
Comprehensive MACD Analysis:
Analyzes the relationship between multiple moving averages (e.g., 20/50, 50/100) using MACD to provide deeper insights into market dynamics.
Calculation of Buy and Sell Percentages:
Computes the percentage of indicators signaling buy or sell conditions, providing a clear summary to assist trading decisions.
Intuitive Visual Interface:
Displays buy and sell percentages as two visible lines (green and red) on the chart.
Includes reference lines to clarify the range of percentages (100% to 0%).
How It Works
Moving Averages Calculation:
Calculates moving averages (20, 50, 100, 150, and 200) for the selected timeframe.
MACD Pair Analysis:
Computes the MACD to compare the performance between various moving average pairs, such as (20/50) and (50/100).
Identifying Buy and Sell Signals:
Counts the number of indicators signaling buy (price above MAs or positive MACD histogram).
Converts the count into percentages for both buy and sell signals.
Visual Representation:
Plots buy and sell percentages as clear lines (green for buy, red for sell).
Adds reference lines (100% and 0%) for easier interpretation.
How to Use the Indicator?
Settings:
Choose the type of moving average (SMA or EMA).
Select the timeframe that suits your strategy (e.g., 15 minutes, 1 hour, or daily).
Reading the Results:
If the buy percentage (green line) is above 50%, the overall trend is bullish (buy).
If the sell percentage (red line) is above 50%, the overall trend is bearish (sell).
Integrating Into Your Strategy:
Combine it with other indicators to confirm entry and exit signals.
Use it to quickly understand the market’s overall trend without needing complex manual analysis.
Benefits of the Indicator
Simplified Analysis: Provides a straightforward summary of the market's overall trend.
Adaptable to All Timeframes: Works perfectly on all timeframes.
Customizable: Allows users to adjust settings according to their needs.
Important Notes
This indicator does not provide direct buy or sell signals. Instead, it offers a summary of the market’s condition based on a combination of indicators.
It is recommended to use it alongside other technical analysis tools for precise trading signals.
Conclusion
The "Advanced MA and MACD Percentage" indicator is an ideal tool for traders who want to analyze the market using a combination of Moving Averages and MACD. It gives you a comprehensive overview of the overall trend, helping you make informed and quick trading decisions. Try it now and see the difference!

Triple EMA Crossover StrategyTriple EMA Crossover Strategy
Overview
The Triple EMA Crossover Strategy is a trend-following trading system that utilizes three Exponential Moving Averages (EMAs) to identify potential entry and exit points in the market. This strategy is based on the principle that when shorter-term prices cross above longer-term prices, it can indicate a bullish trend, and conversely when they cross below, it can signal a bearish trend.
Components
Exponential Moving Averages (EMAs):
Short EMA: A fast-moving average that reacts quickly to price changes (commonly set to 9 periods).
Medium EMA: A medium-term average that smooths out price data and helps confirm trends (commonly set to 21 periods).
Long EMA: A slow-moving average that helps identify the overall trend direction (commonly set to 55 periods).
Trading Signals:
Buy Signal: A long entry is triggered when:
The Short EMA (9) crosses above the Medium EMA (21).
The Medium EMA (21) is above the Long EMA (55).
Sell Signal: A short entry is signaled when:
The Short EMA (9) crosses below the Medium EMA (21).
The Medium EMA (21) is below the Long EMA (55).
Stop Loss and Take Profit:
Stop Loss: Implement a predefined percentage or ATR-based stop loss to limit potential losses.
Take Profit: Set a target based on a risk-to-reward ratio that reflects your trading strategy's goals.
Advantages
Trend Identification: The EMA crossover system allows traders to identify the current trend dynamically, focusing on upward or downward price movements.
Simplicity: The strategy is straightforward, making it accessible for both new and experienced traders.
Flexibility: This method can be applied across multiple timeframes and asset classes, making it versatile for various trading styles.
Disadvantages
Lagging Indicator: Moving averages are lagging indicators, meaning signals may come later than the actual price movement, which can lead to missed opportunities.
Whipsaw Effect: In ranging markets, the strategy may produce false signals leading to potential losses.

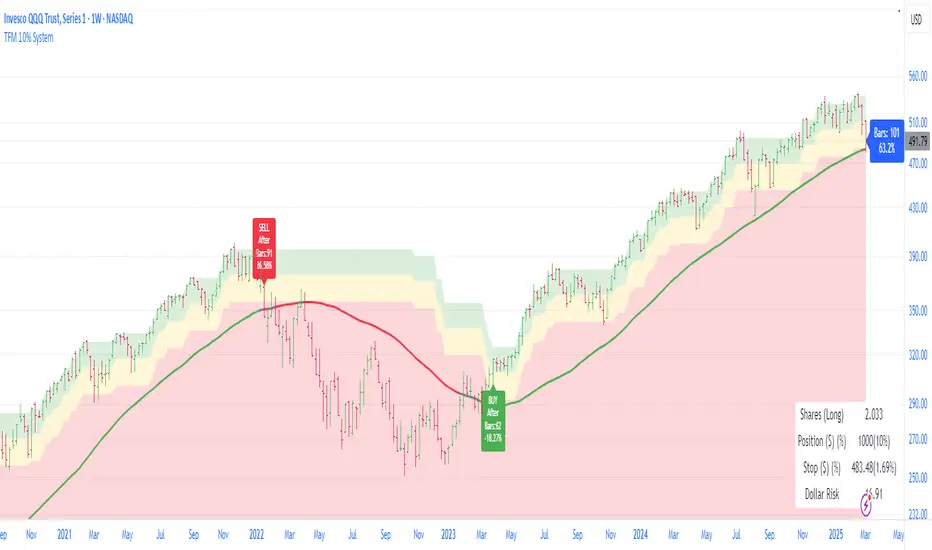
Trend Following Moron TFM 10% System
Trend Following Moron TFM 10% System
The TFM 10% Market Timing System
The Trend Following Moron TFM 10% System is a powerful trading tool designed using Pine Script™, following the principles outlined by Dave S. Landry. This script helps traders identify optimal entry and exit points based on moving averages and market trends.
What the Script Does:
Visual representation of trend strength.
As long as it is trending in green band, trend is very strong and price is contained within 5% of the high.
As price drops to yellow band, strength is weakening and caution is advised. Price is between 5% to 10% away from52 week high.
As price drops in red band, it is to be avoided as trend is rolling over. Price is more than 10% way from 52 week high.
Moving Averages Calculation:
Users can choose between Simple Moving Average (SMA) and Exponential Moving Average (EMA) for daily, weekly, and monthly periods. The script calculates the moving averages to provide trend direction.
Trend Color Coding:
Moving averages are displayed in different colors based on market conditions: green indicates an uptrend, red for a downtrend, and gray for neutral conditions.
Highs Calculation:
The script calculates the 52-week and 12-month closing highs, which are crucial for identifying potential breakout points.
Level Definition:
Traders can set levels based on either Average True Range (ATR) or percentage changes from these highs, allowing for flexible risk management strategies.
Buy and Sell Conditions:
The script defines specific buy conditions: when the price is within 10% of the highest close and trading above the moving averages, and sell conditions: when the price falls below these thresholds.
Visual Indicators:
Buy and sell signals are visually represented on the chart with arrows, making it easy for traders to see potential trading opportunities at a glance.
Performance Labels:
The script includes performance labels that track the number of bars above or below the moving averages and the percentage change from the moving average, providing users with key metrics to evaluate their trades.
Interactive Table:
A table summarizing the buy and sell rules is displayed on the chart, ensuring that traders have quick access to the system’s trading logic.
Benefits of Using the TFM 10% System:
Streamlined Decision Making:
The script simplifies the trading process by clearly outlining buy and sell signals, making it accessible even for novice traders.
Customizable Parameters:
Users can tailor the script to their preferences by adjusting moving average types and lengths, ATR levels, and percentage thresholds. Bands are interchange able for ATR and Percent below 52 week high for volatility looks. But buy and sell are fixed in 10% threshold.
Risk Management:
By utilizing ATR and percentage levels, traders can effectively manage their risk, making the trading process more systematic.
Comprehensive Market Analysis:
The combination of multiple time frames (daily, weekly, monthly) allows for a well-rounded analysis of market trends, enhancing trading accuracy.
Post-Open Long Strategy with ATR-based Stop Loss and Take ProfitThe "Post-Open Long Strategy with ATR-Based Stop Loss and Take Profit" is designed to identify buying opportunities after the German and US markets open. It combines various technical indicators to filter entry signals, focusing on breakout moments following price lateralization periods.
Key Components and Their Interaction:
Bollinger Bands (BB):
Description: Uses BB with a 14-period length and standard deviation multiplier of 1.5, creating narrower bands for lower timeframes.
Role in the Strategy: Identifies low volatility phases (lateralization). The lateralization condition is met when the price is near the simple moving average of the BB, suggesting an imminent increase in volatility.
Exponential Moving Averages (EMA):
10-period EMA: Quickly detects short-term trend direction.
200-period EMA: Filters long-term trends, ensuring entries occur in a bullish market.
Interaction: Positions are entered only if the price is above both EMAs, indicating a consolidated positive trend.
Relative Strength Index (RSI):
Description: 7-period RSI with a threshold above 30.
Role in the Strategy: Confirms the market is not oversold, supporting the validity of the buy signal.
Average Directional Index (ADX):
Description: 7-period ADX with 7-period smoothing and a threshold above 10.
Role in the Strategy: Assesses trend strength. An ADX above 10 indicates sufficient momentum to justify entry.
Average True Range (ATR) for Dynamic Stop Loss and Take Profit:
Description: 14-period ATR with multipliers of 2.0 for Stop Loss and 4.0 for Take Profit.
Role in the Strategy: Adjusts exit levels based on current volatility, enhancing risk management.
Resistance Identification and Breakout:
Description: Analyzes the highs of the last 20 candles to identify resistance levels with at least two touches.
Role in the Strategy: A breakout above this level signals a potential continuation of the bullish trend.
Time Filters and Market Conditions:
Trading Hours: Operates only during the opening of the German market (8:00 - 12:00) and US market (15:30 - 19:00).
Panic Candle: The current candle must close negative, leveraging potential emotional reactions in the market.
Avoiding Entry During Pullbacks:
Description: Checks that the two previous candles are not both bearish.
Role in the Strategy: Avoids entering during a potential pullback, improving trade success probability.
Post-Open Long Strategy with ATR-Based Stop Loss and Take Profit
The "Post-Open Long Strategy with ATR-Based Stop Loss and Take Profit" is designed to identify buying opportunities after the German and US markets open. It combines various technical indicators to filter entry signals, focusing on breakout moments following price lateralization periods.
Key Components and Their Interaction:
Bollinger Bands (BB):
Description: Uses BB with a 14-period length and standard deviation multiplier of 1.5, creating narrower bands for lower timeframes.
Role in the Strategy: Identifies low volatility phases (lateralization). The lateralization condition is met when the price is near the simple moving average of the BB, suggesting an imminent increase in volatility.
Exponential Moving Averages (EMA):
10-period EMA: Quickly detects short-term trend direction.
200-period EMA: Filters long-term trends, ensuring entries occur in a bullish market.
Interaction: Positions are entered only if the price is above both EMAs, indicating a consolidated positive trend.
Relative Strength Index (RSI):
Description: 7-period RSI with a threshold above 30.
Role in the Strategy: Confirms the market is not oversold, supporting the validity of the buy signal.
Average Directional Index (ADX):
Description: 7-period ADX with 7-period smoothing and a threshold above 10.
Role in the Strategy: Assesses trend strength. An ADX above 10 indicates sufficient momentum to justify entry.
Average True Range (ATR) for Dynamic Stop Loss and Take Profit:
Description: 14-period ATR with multipliers of 2.0 for Stop Loss and 4.0 for Take Profit.
Role in the Strategy: Adjusts exit levels based on current volatility, enhancing risk management.
Resistance Identification and Breakout:
Description: Analyzes the highs of the last 20 candles to identify resistance levels with at least two touches.
Role in the Strategy: A breakout above this level signals a potential continuation of the bullish trend.
Time Filters and Market Conditions:
Trading Hours: Operates only during the opening of the German market (8:00 - 12:00) and US market (15:30 - 19:00).
Panic Candle: The current candle must close negative, leveraging potential emotional reactions in the market.
Avoiding Entry During Pullbacks:
Description: Checks that the two previous candles are not both bearish.
Role in the Strategy: Avoids entering during a potential pullback, improving trade success probability.
Entry and Exit Conditions:
Long Entry:
The price breaks above the identified resistance.
The market is in a lateralization phase with low volatility.
The price is above the 10 and 200-period EMAs.
RSI is above 30, and ADX is above 10.
No short-term downtrend is detected.
The last two candles are not both bearish.
The current candle is a "panic candle" (negative close).
Order Execution: The order is executed at the close of the candle that meets all conditions.
Exit from Position:
Dynamic Stop Loss: Set at 2 times the ATR below the entry price.
Dynamic Take Profit: Set at 4 times the ATR above the entry price.
The position is automatically closed upon reaching the Stop Loss or Take Profit.
How to Use the Strategy:
Application on Volatile Instruments:
Ideal for financial instruments that show significant volatility during the target market opening hours, such as indices or major forex pairs.
Recommended Timeframes:
Intraday timeframes, such as 5 or 15 minutes, to capture significant post-open moves.
Parameter Customization:
The default parameters are optimized but can be adjusted based on individual preferences and the instrument analyzed.
Backtesting and Optimization:
Backtesting is recommended to evaluate performance and make adjustments if necessary.
Risk Management:
Ensure position sizing respects risk management rules, avoiding risking more than 1-2% of capital per trade.
Originality and Benefits of the Strategy:
Unique Combination of Indicators: Integrates various technical metrics to filter signals, reducing false positives.
Volatility Adaptability: The use of ATR for Stop Loss and Take Profit allows the strategy to adapt to real-time market conditions.
Focus on Post-Lateralization Breakout: Aims to capitalize on significant moves following consolidation periods, often associated with strong directional trends.
Important Notes:
Commissions and Slippage: Include commissions and slippage in settings for more realistic simulations.
Capital Size: Use a realistic trading capital for the average user.
Number of Trades: Ensure backtesting covers a sufficient number of trades to validate the strategy (ideally more than 100 trades).
Warning: Past results do not guarantee future performance. The strategy should be used as part of a comprehensive trading approach.
With this strategy, traders can identify and exploit specific market opportunities supported by a robust set of technical indicators and filters, potentially enhancing their trading decisions during key times of the day.

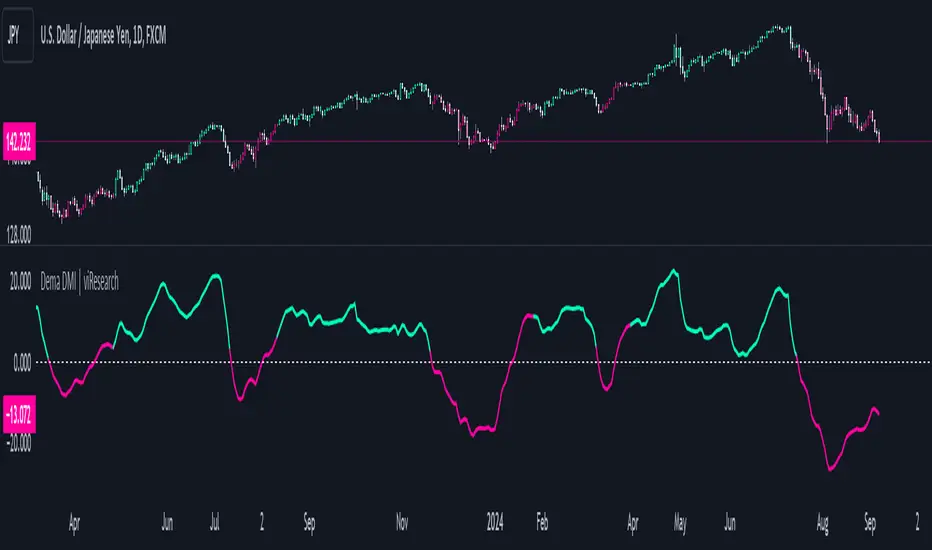
Dema DMI | viResearchDema DMI | viResearch
Conceptual Foundation and Innovation
The "Dema DMI" indicator integrates the Double Exponential Moving Average (DEMA) with the Directional Movement Index (DMI), creating a more responsive and precise trend-following system. The DEMA is used to smooth price data while minimizing lag, making it highly effective for trend detection. The DMI, on the other hand, measures the strength and direction of a trend by analyzing positive and negative directional movements. By combining these two elements, the "Dema DMI" offers traders a powerful tool for identifying trend changes and evaluating the strength of ongoing trends. This combination helps filter out noise in price data while maintaining sensitivity to market movements, providing better trend signals and decision-making opportunities.
Technical Composition and Calculation
The "Dema DMI" script uses two main components: the Double Exponential Moving Average (DEMA) and the Directional Movement Index (DMI). The DEMA is applied to both the high and low prices, creating smoothed versions of these prices based on a user-defined length. The DMI is then calculated by comparing changes in the smoothed high and low prices to measure directional movement. Positive directional movement (DM+) and negative directional movement (DM−) are calculated by evaluating whether the price is trending upward or downward, and the Average Directional Index (ADX) is computed to measure the strength of the trend. The ADX is smoothed to provide a more stable signal of trend strength.
Features and User Inputs
The "Dema DMI" script provides several customizable inputs, enabling traders to tailor the indicator to their strategies. The DEMA Length controls the period over which the DEMA is calculated for both high and low prices. The DMI Length sets the window for calculating directional movement, while the ADX Smoothing Length determines how smooth the ADX line appears, making it easier to assess whether a trend is strengthening or weakening. The script also includes customizable bar colors and alert conditions, providing traders with clear visual cues and notifications when a trend change occurs.
Practical Applications
The "Dema DMI" indicator is designed for traders looking to assess trend strength and direction more effectively. The DEMA smooths price movements, while the DMI highlights shifts in directional movement, providing early signals of potential trend reversals. The ADX helps gauge whether a trend is gaining momentum, allowing traders to improve the timing of trade entries and exits. Additionally, the customizable inputs make the indicator adaptable to different market conditions, ensuring its usefulness in both trending and ranging environments.
Advantages and Strategic Value
The "Dema DMI" script offers significant value by merging the smoothing effects of DEMA with the directional analysis of the DMI. This combination reduces the lag commonly associated with trend-following indicators, providing more timely and accurate trend signals. The ADX further enhances the indicator’s utility by measuring the strength of the trend, helping traders filter out weak signals and stay aligned with stronger trends. This makes the "Dema DMI" an ideal tool for traders seeking to improve their trend-following strategies and optimize their market positioning.
Alerts and Visual Cues
The script includes alert conditions that notify traders when a significant trend change occurs. The "Dema DMI Long" alert is triggered when the indicator detects an upward trend, while the "Dema DMI Short" alert signals a potential downward trend. Visual cues, such as changes in the bar color and the difference between positive and negative directional movement, help traders quickly identify trend shifts and act accordingly.
Summary and Usage Tips
The "Dema DMI | viResearch" indicator combines the smoothing benefits of the DEMA with the directional analysis of the DMI, providing traders with a reliable tool for detecting trend changes and confirming trend strength. By incorporating this script into your trading strategy, you can improve your ability to detect early trend reversals, confirm trend direction, and reduce noise in price data. The "Dema DMI" is a flexible and adaptable solution for traders looking to enhance their technical analysis in various market conditions.
Note: Backtests are based on past results and are not indicative of future performance.
Inverted SD Dema RSI | viResearchInverted SD Dema RSI | viResearch
The "Inverted SD Dema RSI" developed by viResearch introduces a new approach to trend analysis by combining the Double Exponential Moving Average (DEMA), Standard Deviation (SD), and Relative Strength Index (RSI). This unique indicator provides traders with a tool to capture market trends by integrating volatility-based thresholds. By using the smoothed DEMA along with standard deviation, the indicator offers improved responsiveness to price fluctuations, while RSI thresholds offer insight into overbought and oversold market conditions.
At the core of the "Inverted SD Dema RSI" is the combination of DEMA and standard deviation for a more nuanced view of market volatility. The use of RSI further aids in detecting price extremes and potential trend reversals.
DEMA Calculation (sublen): The Double Exponential Moving Average (DEMA) smoothes out price data over a user-defined period, reducing lag compared to traditional moving averages. This provides a clearer representation of the market's overall direction.
Standard Deviation Calculation (sublen_2): The standard deviation of the DEMA is used to define the upper (u) and lower (d) bands, highlighting areas where price volatility may signal a change in trend. These dynamic bands help traders gauge price volatility and potential breakouts or breakdowns.
RSI Calculation (len): The script applies the Relative Strength Index (RSI) to the smoothed DEMA values, allowing traders to detect momentum shifts based on a modified data set. This provides a more accurate reflection of market strength when combined with the DEMA.
Thresholds: The RSI is compared to user-defined thresholds (70 for overbought and 55 for oversold conditions). These thresholds help in identifying potential market reversals, especially when the price breaks outside of the calculated standard deviation bands.
Uptrend (L): An uptrend signal is generated when the RSI exceeds the upper threshold (70) and the price is not above the upper standard deviation band, indicating that there may be room for further price appreciation.
Downtrend (S): A downtrend signal occurs when the RSI falls below the lower threshold (55), indicating that the price may continue to decline.
The "Inverted SD Dema RSI" offers a wide range of customizable settings, allowing traders to adjust the indicator based on their trading style or market conditions.
DEMA Length (sublen): Controls the period used to smooth the price data, impacting the sensitivity of the DEMA to recent price movements.
Standard Deviation Length (sublen_2): Defines the length over which the standard deviation is calculated, helping traders control the width of the upper and lower bands.
RSI Length (len): Adjusts the period used for the RSI calculation, providing flexibility in determining overbought and oversold conditions.
RSI Thresholds: Traders can define their own levels for detecting trend reversals, with default values of 70 for an uptrend and 55 for a downtrend.
The "Inverted SD Dema RSI" is particularly well-suited for traders looking to capture trends while accounting for volatility and momentum. By using a smoothed DEMA as the foundation, it effectively filters out noise, making it ideal for detecting reliable trends in volatile markets.
Key Uses:
Trend Following: The indicator’s combination of DEMA, standard deviation, and RSI helps traders follow trends more effectively by reducing noise and identifying key momentum shifts.
Volatility Filtering: The use of standard deviation bands provides a dynamic measure of volatility, ensuring that traders are aware of potential breakouts or breakdowns in the market.
Momentum Detection: The inclusion of RSI ensures that the indicator is not only focused on trend direction but also on the strength of the underlying momentum, helping traders avoid entering trades during weak trends.
The "Inverted SD Dema RSI" provides several key advantages over traditional trend-following indicators:
Reduced Lag: The use of DEMA ensures faster trend detection, reducing the lag associated with simple moving averages.
Noise Reduction: The integration of standard deviation helps filter out irrelevant price movements, making it easier to identify significant trends.
Momentum Awareness: The addition of RSI provides valuable insight into the strength of trends, helping traders avoid false signals during periods of weak momentum.
The "Inverted SD Dema RSI" offers a powerful blend of trend-following and momentum detection, making it a versatile tool for modern traders. By integrating DEMA, standard deviation, and RSI, the indicator provides a comprehensive view of market trends and volatility. Traders are encouraged to experiment with different settings for the DEMA length, standard deviation, and RSI thresholds to fine-tune the indicator for their specific trading strategies. Whether used for trend confirmation, volatility assessment, or momentum analysis, the "Inverted SD Dema RSI" offers a valuable tool for traders seeking a comprehensive approach to market analysis.

Brooks Always In [KintsugiTrading]Brooks Always In
Overview:
The "Brooks Always In Indicator" by KintsugiTrading is a tool designed for traders who follow price action methodologies inspired by Al Brooks. This indicator identifies key bar patterns and breakouts, plots an Exponential Moving Average (EMA), and highlights consecutive bullish and bearish bars. It is intended to assist traders in making informed decisions based on price action dynamics.
Features:
Consecutive Bar Patterns:
Identifies and highlights consecutive bullish and bearish bars.
Differentiates between bars that are above/below the EMA and those that are not.
Customizable EMA:
Option to display an Exponential Moving Average (EMA) with user-defined length and offset.
The EMA can be smoothed using various methods such as SMA, EMA, SMMA (RMA), WMA, and VWMA.
Breakout Patterns:
Recognizes bullish and bearish breakout bars and outside bars.
Tracks inside bars and prior bar conditions to better understand the market context.
Customizable Display:
Users can display or hide the EMA, consecutive bar patterns, and consecutive bars relative to the moving average.
How to Use:
Customize Settings:
First, I like to navigate to the top right corner of the chart (bolt icon), and change both the bull and bear body color to match the background (white/black) - this helps the user visualize the indicator far better.
Next, Toggle to display EMA, consecutive bar patterns, and consecutive bars relative to the moving average using the provided input options.
Adjust the EMA length, source, and offset as per your trading strategy.
Select the smoothing method and length for the EMA if desired.
Analyze Key Patterns:
Observe the highlighted bars on the chart to identify consecutive bullish and bearish patterns.
Use the plotted EMA to gauge the general trend and analyze the relationship between price bars and the moving average.
Informed Decision Making:
Utilize the identified bar patterns and breakouts to make informed trading decisions, such as identifying potential entry and exit points based on price action dynamics.
Good luck with your trading!

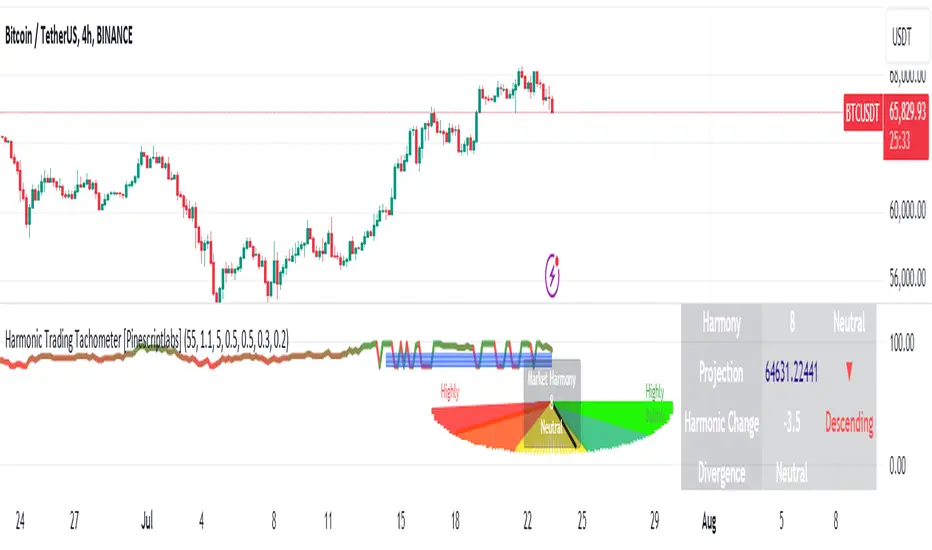
Harmonic Trading Tachometer [Pinescriptlabs]Key Features:
Visual Tachometer:
Represents market harmony through a speedometer on the chart.
The tachometer displays a range of harmony from "Highly Bearish" to "Highly Bullish."
Harmony Calculation:
Harmony Score: Based on ATR (Average True Range) range calculations for short, medium, and long periods. The harmony score is a weighted combination of these scores.
Interpretation: Harmony is translated into an interpretive category that can be "Highly Bearish," "Bearish," "Neutral," "Bullish," or "Highly Bullish."
Price Projection:
Estimates future price movement considering the current trend and the weight of each trend period (short, medium, and long).
Harmonic Change Detection:
Identifies significant changes in market harmony and adjusts sensitivity with predefined thresholds.
Confirmation and Divergence Signals:
Detects bullish or bearish confirmation signals as well as divergences, based on market harmony and price projection.
Additional Visualization:
Includes an optional market pentagram chart to visualize harmony on a broader scale.
Provides detailed information in a table about harmony, price projection, and harmonic changes.
How the Script Works:
Initial Calculations:
Ranges and Scores: Calculates ATR ranges for different periods (short, medium, and long). Then, evaluates the harmony score using the given formula.
Harmony: Obtained through the weighted combination of short, medium, and long-term scores.
Price Projection:
The projection is adjusted based on the difference between the current closing price and the exponential moving averages (EMAs) for different periods, weighted by the defined factors.
How to Use :
Tachometer Interpretation:
Observe the needle's position on the tachometer to assess the current market harmony.
Use the colors and labels to quickly interpret the market's state.
Projection and Changes:
Use the price projection to identify potential support or resistance levels.
Monitor harmonic changes and their strengths to adjust your trading strategies.
Confirmations and Divergences:
Pay attention to confirmation and divergence signals to decide on potential entries or exits.
Customization:
Adjust the indicator parameters, such as base length, harmony factor, change detection period, and trend weights, to fit your trading style and timeframe.
Español:
**Tacómetro Visual:
- Representa la armonía del mercado mediante un velocímetro en el gráfico.
- El tacómetro muestra un rango de armonía desde "Altamente Bajista" hasta "Altamente Alcista."
Cálculo de Armonía:
- Puntuación de Armonía:** Basada en los cálculos del rango ATR (Average True Range) para períodos cortos, medios y largos. La puntuación de armonía es una combinación ponderada de estas puntuaciones.
- Interpretación: La armonía se traduce en una categoría interpretativa que puede ser "Altamente Bajista," "Bajista," "Neutral," "Alcista," o "Altamente Alcista."
**Proyección de Precios:
- Estima el movimiento futuro de los precios considerando la tendencia actual y el peso de cada período de tendencia (corto, medio y largo).
**Detección de Cambios Armonicos:
- Identifica cambios significativos en la armonía del mercado y ajusta la sensibilidad con umbrales predefinidos.
**Señales de Confirmación y Divergencia:
- Detecta señales de confirmación alcista o bajista, así como divergencias, basadas en la armonía del mercado y la proyección de precios.
**Visualización Adicional:**
- Incluye un gráfico opcional de un pentagrama de mercado para visualizar la armonía en una escala más amplia.
- Proporciona información detallada en una tabla sobre la armonía, la proyección de precios y los cambios armónicos.
**Cómo Funciona el Script:**
Cálculos Iniciales:
- **Rangos y Puntuaciones:** Calcula los rangos del ATR para diferentes períodos (corto, medio y largo). Luego, evalúa la puntuación de armonía utilizando la fórmula dada.
- **Armonía:** Se obtiene a través de la combinación ponderada de las puntuaciones de corto, medio y largo plazo.
**Proyección de Precios:**
- La proyección se ajusta según la diferencia entre el precio de cierre actual y las medias móviles exponenciales (EMA) para diferentes períodos, ponderadas por los factores definidos.
**Cómo Usar:**
**Interpretación del Tacómetro:**
- Observa la posición de la aguja en el tacómetro para evaluar la armonía actual del mercado.
- Usa los colores y las etiquetas para interpretar rápidamente el estado del mercado.
**Proyección y Cambios:**
- Usa la proyección de precios para identificar posibles niveles de soporte o resistencia.
- Monitorea los cambios armónicos y sus fortalezas para ajustar tus estrategias de trading.
**Confirmaciones y Divergencias:**
- Presta atención a las señales de confirmación y divergencia para decidir posibles entradas o salidas.
**Personalización:**
- Ajusta los parámetros del indicador, como la longitud base, el factor de armonía, el período de detección de cambios y los pesos de tendencia, para adaptarlo a tu estilo de trading y marco de tiempo.
Chandelier Exit Strategy with 200 EMA FilterStrategy Name and Purpose
Chandelier Exit Strategy with 200EMA Filter
This strategy uses the Chandelier Exit indicator in combination with a 200-period Exponential Moving Average (EMA) to generate trend-based trading signals. The main purpose of this strategy is to help traders identify high-probability entry points by leveraging the Chandelier Exit for stop loss levels and the EMA for trend confirmation. This strategy aims to provide clear rules for entries and exits, improving overall trading discipline and performance.
Originality and Usefulness
This script integrates two powerful indicators to create a cohesive and effective trading strategy:
Chandelier Exit : This indicator is based on the Average True Range (ATR) and identifies potential stop loss levels. The Chandelier Exit helps manage risk by setting stop loss levels at a distance from the highest high or lowest low over a specified period, multiplied by the ATR. This ensures that the stop loss adapts to market volatility.
200-period Exponential Moving Average (EMA) : The EMA acts as a trend filter. By ensuring trades are only taken in the direction of the overall trend, the strategy improves the probability of success. For long entries, the close price must be above the 200 EMA, indicating a bullish trend. For short entries, the close price must be below the 200 EMA, indicating a bearish trend.
Combining these indicators adds layers of confirmation and risk management, enhancing the strategy's effectiveness. The Chandelier Exit provides dynamic stop loss levels based on market volatility, while the EMA ensures trades align with the prevailing trend.
Entry Conditions
Long Entry
A buy signal is generated by the Chandelier Exit.
The close price is above the 200 EMA, indicating a strong bullish trend.
Short Entry
A sell signal is generated by the Chandelier Exit.
The close price is below the 200 EMA, indicating a strong bearish trend.
Exit Conditions
For long positions: The position is closed when a sell signal is generated by the Chandelier Exit.
For short positions: The position is closed when a buy signal is generated by the Chandelier Exit.
Risk Management
Account Size: 1,000,00 yen
Commission and Slippage: 17 pips commission and 1 pip slippage per trade
Risk per Trade: 10% of account equity
Stop Loss: For long trades, the stop loss is placed slightly below the candle that generated the buy signal. For short trades, the stop loss is placed slightly above the candle that generated the sell signal. The stop loss levels are dynamically adjusted based on the ATR.
Settings Options
ATR Period: Set the period for calculating the ATR to determine the Chandelier Exit levels.
ATR Multiplier: Set the multiplier for ATR to define the distance of stop loss levels from the highest high or lowest low.
Use Close Price for Extremums: Choose whether to use the close price for calculating the extremums.
EMA Period: Set the period for the EMA to adjust the trend filter sensitivity.
Show Buy/Sell Labels: Choose whether to display buy and sell labels on the chart for visual confirmation.
Highlight State: Choose whether to highlight the bullish or bearish state on the chart.
Sufficient Sample Size
The strategy has been backtested with a sufficient sample size to evaluate its performance accurately. This ensures that the strategy's results are statistically significant and reliable.
Notes
This strategy is based on historical data and does not guarantee future results.
Thoroughly backtest and validate results before using in live trading.
Market volatility and other external factors can affect performance and may not yield expected results.
Acknowledgment
This strategy uses the Chandelier Exit indicator. Special thanks to the original contributors for their work on the Chandelier Exit concept.
Clean Chart Explanation
The script is published with a clean chart to ensure that its output is readily identifiable and easy to understand. No other scripts are included on the chart, and any drawings or images used are specifically to illustrate how the script works.

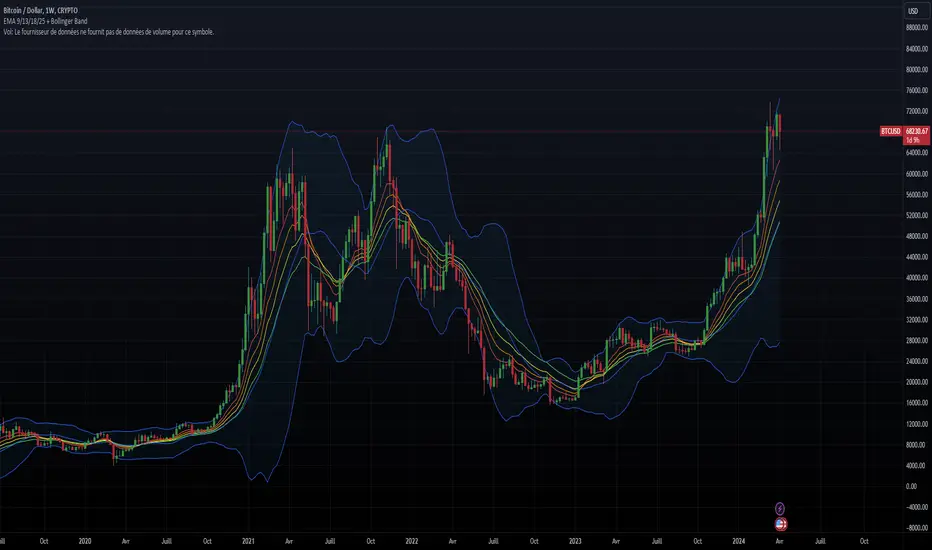
EMA 9/13/18/25 + Bollinger BandThe indicator combines two components: Exponential Moving Averages (EMAs) and Bollinger Bands.
Exponential Moving Averages (EMAs): The indicator calculates four EMAs with different periods: 9, 13, 18, and 25. An Exponential Moving Average is a type of moving average that places a greater weight and significance on the most recent data points. As the name suggests, it's an average of the asset's price over a certain period, with recent prices given more weight in the calculation, making it more responsive to recent price changes.
Bollinger Bands: Bollinger Bands consist of a simple moving average (the basis) and two standard deviations plotted away from it. The standard deviations are multiplied by a factor (usually 2) to determine the distance from the basis. These bands dynamically adjust themselves based on recent price movements. The upper band represents the highest price level reached in the given period, while the lower band represents the lowest price level.
Combining these components provides traders with insights into both trend direction and volatility. The EMAs help identify trends by smoothing out price data, while the Bollinger Bands offer insights into volatility and potential price reversal points. Traders often use the crossovers of EMAs and interactions with Bollinger Bands to make trading decisions. For example, when the price touches the upper Bollinger Band, it may indicate overbought conditions, while touching the lower band may suggest oversold conditions. Additionally, crossovers of EMAs (such as the shorter-term EMA crossing above or below the longer-term EMA) may signal changes in trend direction.
MTF BB+KC Avg
Bollinger Bands (BB) are a widely used technical analysis created by John Bollinger in the early 1980’s. Bollinger Bands consist of a band of three lines which are plotted in relation to instrument prices. The line in the middle is usually a Simple Moving Average (SMA) set to a period of 20 days (The type of trend line and period can be changed by the trader; however a 20 day moving average is by far the most popular). This indicator does not plot the middle line. The Upper and Lower Bands are used as a way to measure volatility by observing the relationship between the Bands and price. Typically the Upper and Lower Bands are set to two standard deviations away from the middle line, however the number of standard deviations can also be adjusted in the indicator.
Keltner Channels (KC) are banded lines similar to Bollinger Bands and Moving Average Envelopes. They consist of an Upper Envelope above a Middle Line (not plotted in this indicator) as well as a Lower Envelope below the Middle Line. The Middle Line is a moving average of price over a user-defined time period. Either a simple moving average or an exponential moving average are typically used. The Upper and Lower Envelopes are set a (user-defined multiple) of a range away from the Middle Line. This can be a multiple of the daily high/low range, or more commonly a multiple of the Average True Range.
This indicator is built on AVERAGING the BB and KC values for each bar, so you have an efficient metric of AVERAGE volatility. The indicator visualizes changes in volatility which is of course dynamic.
What to look for
High/Low Prices
One thing that must be understood about this indicator's plots is that it averages by adding BB levels to KC levels and dividing by 2. So the plots provide a relative definition of high and low from two very popular indicators. Prices are almost always within the upper and lower bands. Therefore, when prices move up near the upper or lower bands or even break through the band, many traders would see that price action as OVER-EXTENDED (either overbought or oversold, as applicable). This would preset a possible selling or buying opportunity.
Cycling Between Expansion and Contraction
Volatility can generally be seen as a cycle. Typically periods of time with low volatility and steady or sideways prices (known as contraction) are followed by period of expansion. Expansion is a period of time characterized by high volatility and moving prices. Periods of expansion are then generally followed by periods of contraction. It is a cycle in which traders can be better prepared to navigate by using Bollinger Bands because of the indicators ability to monitor ever changing volatility.
Walking the Bands
Of course, just like with any indicator, there are exceptions to every rule and plenty of examples where what is expected to happen, does not happen. Previously, it was mentioned that price breaking above the Upper Band or breaking below the Lower band could signify a selling or buying opportunity respectively. However this is not always the case. “Walking the Bands” can occur in either a strong uptrend or a strong downtrend.
During a strong uptrend, there may be repeated instances of price touching or breaking through the Upper Band. Each time that this occurs, it is not a sell signal, it is a result of the overall strength of the move. Likewise during a strong downtrend there may be repeated instances of price touching or breaking through the Lower Band. Each time that this occurs, it is not a buy signal, it is a result of the overall strength of the move.
Keep in mind that instances of “Walking the Bands” will only occur in strong, defined uptrends or downtrends.
Inputs
TimeFrame
You can select any timeframe froom 1 minute to 12 months for the bar measured.
Length of the internal moving averages
You can select the period of time to be used in calculating the moving averages which create the base for the Upper and Lower Bands. 20 days is the default.
Basis MA Type
Determines the type of Moving Average that is applied to the basis plot line. Default is SMA and you can select EMA.
Source
Determines what data from each bar will be used in calculations. Close is the default.
StdDev/Multiplier
The number of Standard Deviations (for BB) or Multiplier (for KC) away from the moving averages that the Upper and Lower Bands should be. 2 is the default value for each indicator.

Kendall's Tau Correlation Regimes [NariCapitalTrading]The "Kendall's Tau Correlation Regimes" indicator is designed to analyze price data and determine market regimes based on Kendall's Tau correlation coefficient. It provides insight into the strength and direction of the correlation between two data series: close price and a selected moving average.
User Inputs:
Period: Defines the lookback period for calculating Kendall's Tau correlation. It can be adjusted using the input slider, with a minimum value of 1.
Threshold: Sets the threshold for identifying bullish and bearish market regimes. The user can adjust this value within the range of 0.1 to 1.0 with step increments of 0.1.
MA Type: Allows users to select the type of moving average to be used in the correlation calculation. Options include Simple Moving Average (SMA), Exponential Moving Average (EMA), and Hull Moving Average (HMA).
Kendall's Tau Correlation Calculation:
Calculates Kendall's Tau correlation coefficient between the closing price and the selected moving average.
Kendall's Tau measures the strength and direction of the ordinal association between two data series. It assesses whether the data pairs are in the same order or not.
The calculation involves counting concordant and discordant pairs of data points and then computing the coefficient.
Market Regime Identification:
Based on the threshold defined by the user, the indicator identifies two market regimes: bullish and bearish.
A regime is considered bullish when the Kendall's Tau correlation coefficient is greater than the threshold.
A regime is considered bearish when the Kendall's Tau correlation coefficient is less than the negative of the threshold.
Plotting:
The indicator plots the calculated Kendall's Tau correlation coefficient as a blue line on a separate indicator pane.
It also highlights bullish regimes with a green background and bearish regimes with a red background.
Conclusion:
The "Kendall's Tau Correlation Regimes" indicator provides traders with a visual aid for assessing market regimes based on the strength of correlation between price and a selected moving average.
Disclaimer: This indicator is for educational and informational purposes only.

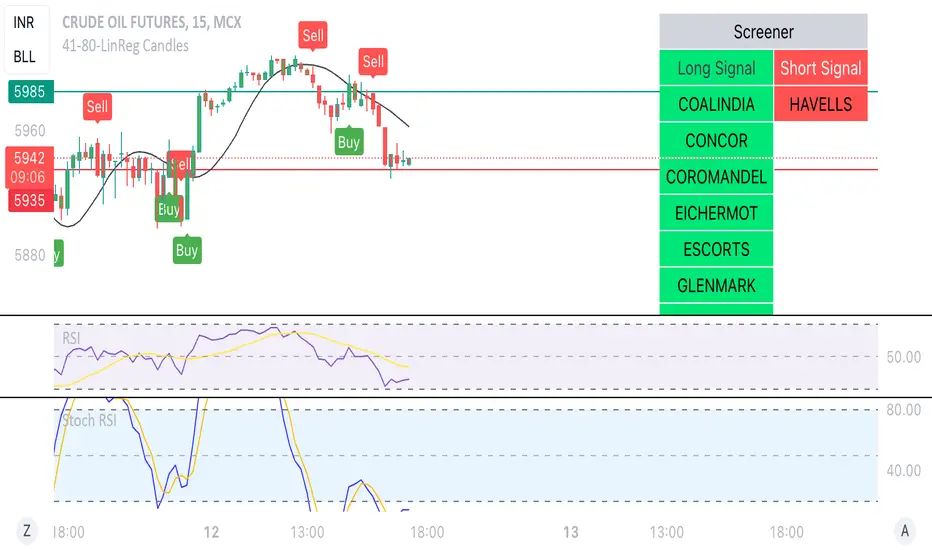
Linear Reg CandlesThe provided Pine Script is a TradingView script for creating a technical analysis indicator called "Humble LinReg Candles." This script includes features such as linear regression for open, high, low, and close prices, signal smoothing with simple or exponential moving averages, and a trailing stop based on Average True Range (ATR). Additionally, the script contains a screener section to display signals for a list of specified symbols.
Here is a breakdown of the script:
Indicator Settings:
It defines various input parameters such as signal smoothing length, linear regression settings, and options for using simple moving averages.
Linear regression is applied to open, high, low, and close prices based on user-defined settings.
ATR Trailing Stop:
It calculates the Average True Range (ATR) and uses it to determine a trailing stop for buy and sell signals.
Signals are generated based on whether the close price is above or below the ATR trailing stop.
Plotting:
The script plots the calculated signal on the chart using the plot function.
Buy and Sell Conditions:
Buy and sell conditions are defined based on the relationship between the close price and the ATR trailing stop.
Plot shapes and bar colors are used to visually represent buy and sell signals on the chart.
Alerts:
Alerts are triggered when buy or sell conditions are met.
Screener Section:
The script defines a screener section to display a watchlist of symbols with long and short signals.
The watchlist includes a set of predefined symbols with corresponding long and short signals.
Table Theme Settings:
The script allows customization of the table theme, including background color, frame color, and text color.
The size and location of the table on the chart can also be customized.
Screener Function:
A function getSignal is defined to determine long and short signals for each symbol in the watchlist.
The getSym function is used to extract the symbol name from the symbol string.
Dashboard Creation:
The script creates a table (dashboard) to display long and short signals for the symbols in the watchlist.
The table includes headers for "Long Signal" and "Short Signal" and lists the symbols with corresponding signals.
Overall, the script combines technical analysis indicators and a screener to help traders identify potential buy and sell signals for a set of specified symbols.
Choose Symbol, Mode with HullThis Pine Script code is designed to create a customizable indicator on the TradingView platform. Below is an introduction to its features and purpose:
Introduction:
This script serves as a versatile indicator on TradingView, allowing users to choose between different modes (Heikin-Ashi, Linear, and Normal) and apply a Hull Moving Average (Hull) for trend analysis. The primary features include mode selection, the choice of using different calculation methods, and the option to incorporate the Hull Moving Average for enhanced trend visibility.
Key Features:
Mode Selection:
Users can choose between "Heikin-Ashi," "Linear," or "Normal" modes, influencing how the open, high, low, and close prices are calculated.
Hull Moving Average:
The script incorporates the Hull Moving Average (Hull) to provide a smoothed trend line for better trend identification.
Calculation Methods:
Users can select different calculation methods for the open, high, low, and close prices, including Simple Moving Average (SMA), Exponential Moving Average (EMA), Smoothed Moving Average (SMMA or RMA), Weighted Moving Average (WMA), and Volume Weighted Moving Average (VWMA).
Customizable Lengths:
Length parameters are customizable, allowing users to adjust the period lengths for the Hull Moving Average and other calculation methods.
Buy and Sell Signals:
Buy and sell signals are generated based on crossovers and crossunders between the Hull Moving Average and the price. These signals are visually displayed on the chart with corresponding labels.
Color-Coding:
The script utilizes color-coding to distinguish between bullish (lime) and bearish (red) trends, making it easier for users to identify potential changes in market direction.
Customizable Symbol and Resolution:
Users have the option to choose a specific trading symbol and resolution for analysis.
Important Note:
This script is provided for educational purposes and does not constitute financial advice. Traders and investors should conduct thorough research and analysis before making any trading decisions. Additionally, customization options should be explored to align the script with individual trading preferences.
