在腳本中搜尋"Exponential Moving Average"
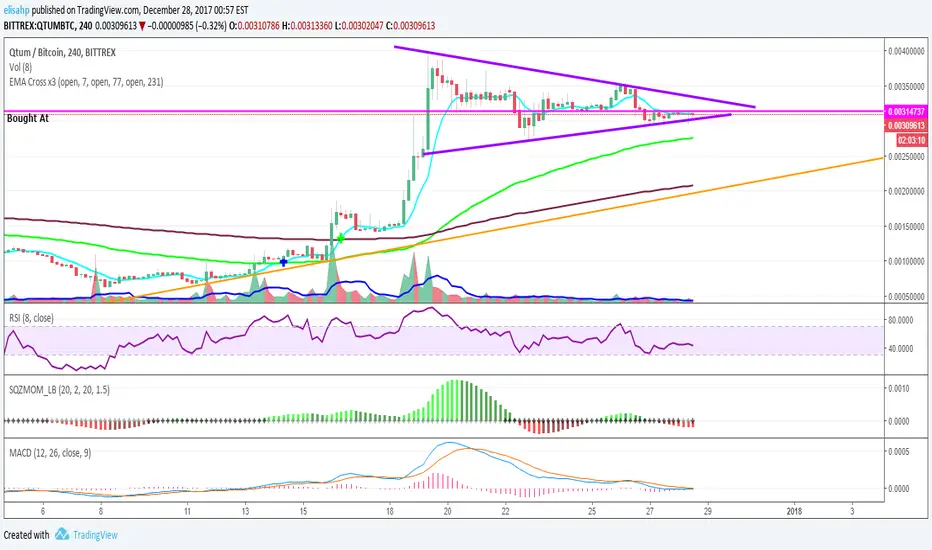
EMA Cross x3 (7, 77, 231)Exponential Moving Average at periods, 7, 77, 231. You will see a blue cross when the short EMA crosses the medium EMA, and a green cross when it crosses the long EMA.
EMA SpreadExponential Moving Average Spread is the percentage spread difference between EMA1 (Slow) and EMA2 (Fast) ie. the gap between two indicators slow and fast. Useful when used alongside EMA cross, MACD, and RSI to strengthen buy/sell signals.

MTF EMAExponential Moving Average indicator that can be configured to display different timeframe EMA's.
Timeframe is set in minutes. Max timeframe currently is the daily (1440 minutes). Any value higher than 1440 will result in no plot.
Examples:
Daily 50 EMA plotted on 4H chart
4H 50 EMA and Daily 50 EMA plotted on 1H chart
Can also work in reverse if needed.
Example, Daily 50 EMA plotted on Weekly Chart


EMAsDescription:
This indicator displays 10 separate Exponential Moving Averages (EMAs) on your chart to help you identify trend direction and potential support/resistance levels.
Unlike Simple Moving Averages (SMAs), EMAs place greater weight on recent price data, allowing for a faster reaction to price changes.
Key Features:
10 Customizable Lines: You can configure the length and source for up to 10 different EMAs.
Dynamic Coloring: The lines change color based on the relationship between the price and the EMA.
EMAs 1-5: Blue when price is above, Orange when price is below.
EMAs 6-10: Green when price is above, Red when price is below.
Visual Hierarchy: Key moving averages (default periods like 50, 200, 600) are rendered with thicker lines to make them stand out as major trend indicators.
Default Settings: The script comes with the following default periods, covering short to long-term trends: 9, 20, 50, 75, 100, 200, 250, 300, 400, 500, 600.
Hope you find this tool useful for your trend analysis!

Dynamic Risk and RewardThe Dynamic Equity Projection (DEP Map) is an institutional-grade visual execution tool designed to automate risk-to-reward mapping directly on your chart. Unlike standard drawing tools, it is context-aware—calculating volatility and trend bias in real-time to provide a "live" projection of your trade's potential.Core Logic & Intelligence1. Trend-Filtered SentimentThe indicator uses a 200-period Exponential Moving Average (EMA) as a directional filter.Bullish Map: If the current price is above the EMA, the DEP Map projects a green "Long" zone.Bearish Map: If the price is below the EMA, it instantly flips to a red "Short" zone.This helps traders stay aligned with the primary market momentum, avoiding the trap of "trading against the tide."2. Volatility-Adaptive Risk (ATR)Rather than using arbitrary point distances, the DEP Map utilizes the Average True Range (ATR).It measures the market's "noise" level over the last 14 bars.The Stop Loss is set at a multiplier (default 1.5x) of this volatility, ensuring your stop is wide enough to survive market breathing but tight enough to maintain a high R:R.Technical FeaturesFeatureDescriptionProfessional BenefitProjection BoxA dynamic rectangle that extends into the "future" (right-side offset).Keeps the current price action clear while providing a visual goalpost for the trade.Persistent LogicUses advanced var object handling to prevent "ghosting" or label stacking.Ensures a clean, high-performance chart interface without clutter.R:R Equity LadderSegments the profit zone into specific milestones: 1.0, 2.0, 3.0, and the "Equity Target" (5.0).Allows for precise partial profit-taking and psychological target setting.Dashed SL LineA high-contrast red dashed line indicating the invalidation point.Provides an immediate visual cue of the trade's total risk.How to Use the DEP MapIdentify the Bias: Observe the color of the box. A green box suggests looking for buying opportunities; a red box suggests selling.Verify the Levels: The labels on the right edge of the box provide the exact price points for your Stop Loss and Take Profit orders.Execute & Manage:R:R 1.0: The "Safety Point." Many traders move their stop to breakeven here.R:R 2.0 - 3.0: The "Standard Exit." This is where the bulk of the trade's profit is usually captured.Equity Target: The "Home Run." Reserved for high-conviction trend extensions.

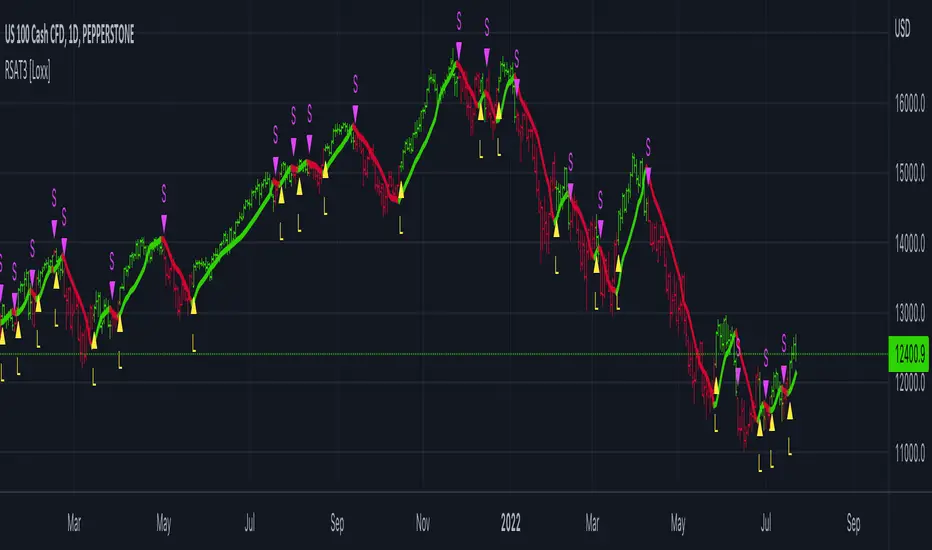
Moving Average Filters Add-on w/ Expanded Source Types [Loxx]Moving Average Filters Add-on w/ Expanded Source Types is a conglomeration of specialized and traditional moving averages that will be used in most of indicators that I publish moving forward. There are 39 moving averages included in this indicator as well as expanded source types including traditional Heiken Ashi and Better Heiken Ashi candles. You can read about the expanded source types clicking here . About half of these moving averages are closed source on other trading platforms. This indicator serves as a reference point for future public/private, open/closed source indicators that I publish to TradingView. Information about these moving averages was gleaned from various forex and trading forums and platforms as well as TASC publications and other assorted research publications.
________________________________________________________________
Included moving averages
ADXvma - Average Directional Volatility Moving Average
Linnsoft's ADXvma formula is a volatility-based moving average, with the volatility being determined by the value of the ADX indicator.
The ADXvma has the SMA in Chande's CMO replaced with an EMA, it then uses a few more layers of EMA smoothing before the "Volatility Index" is calculated.
A side effect is, those additional layers slow down the ADXvma when you compare it to Chande's Variable Index Dynamic Average VIDYA.
The ADXVMA provides support during uptrends and resistance during downtrends and will stay flat for longer, but will create some of the most accurate market signals when it decides to move.
Ahrens Moving Average
Richard D. Ahrens's Moving Average promises "Smoother Data" that isn't influenced by the occasional price spike. It works by using the Open and the Close in his formula so that the only time the Ahrens Moving Average will change is when the candlestick is either making new highs or new lows.
Alexander Moving Average - ALXMA
This Moving Average uses an elaborate smoothing formula and utilizes a 7 period Moving Average. It corresponds to fitting a second-order polynomial to seven consecutive observations. This moving average is rarely used in trading but is interesting as this Moving Average has been applied to diffusion indexes that tend to be very volatile.
Double Exponential Moving Average - DEMA
The Double Exponential Moving Average (DEMA) combines a smoothed EMA and a single EMA to provide a low-lag indicator. It's primary purpose is to reduce the amount of "lagging entry" opportunities, and like all Moving Averages, the DEMA confirms uptrends whenever price crosses on top of it and closes above it, and confirms downtrends when the price crosses under it and closes below it - but with significantly less lag.
Double Smoothed Exponential Moving Average - DSEMA
The Double Smoothed Exponential Moving Average is a lot less laggy compared to a traditional EMA. It's also considered a leading indicator compared to the EMA, and is best utilized whenever smoothness and speed of reaction to market changes are required.
Exponential Moving Average - EMA
The EMA places more significance on recent data points and moves closer to price than the SMA (Simple Moving Average). It reacts faster to volatility due to its emphasis on recent data and is known for its ability to give greater weight to recent and more relevant data. The EMA is therefore seen as an enhancement over the SMA.
Fast Exponential Moving Average - FEMA
An Exponential Moving Average with a short look-back period.
Fractal Adaptive Moving Average - FRAMA
The Fractal Adaptive Moving Average by John Ehlers is an intelligent adaptive Moving Average which takes the importance of price changes into account and follows price closely enough to display significant moves whilst remaining flat if price ranges. The FRAMA does this by dynamically adjusting the look-back period based on the market's fractal geometry.
Hull Moving Average - HMA
Alan Hull's HMA makes use of weighted moving averages to prioritize recent values and greatly reduce lag whilst maintaining the smoothness of a traditional Moving Average. For this reason, it's seen as a well-suited Moving Average for identifying entry points.
IE/2 - Early T3 by Tim Tilson
The IE/2 is a Moving Average that uses Linear Regression slope in its calculation to help with smoothing. It's a worthy Moving Average on it's own, even though it is the precursor and very early version of the famous "T3 Indicator".
Integral of Linear Regression Slope - ILRS
A Moving Average where the slope of a linear regression line is simply integrated as it is fitted in a moving window of length N (natural numbers in maths) across the data. The derivative of ILRS is the linear regression slope. ILRS is not the same as a SMA (Simple Moving Average) of length N, which is actually the midpoint of the linear regression line as it moves across the data.
Instantaneous Trendline
The Instantaneous Trendline is created by removing the dominant cycle component from the price information which makes this Moving Average suitable for medium to long-term trading.
Laguerre Filter
The Laguerre Filter is a smoothing filter which is based on Laguerre polynomials. The filter requires the current price, three prior prices, a user defined factor called Alpha to fill its calculation.
Adjusting the Alpha coefficient is used to increase or decrease its lag and it's smoothness.
Leader Exponential Moving Average
The Leader EMA was created by Giorgos E. Siligardos who created a Moving Average which was able to eliminate lag altogether whilst maintaining some smoothness. It was first described during his research paper "MACD Leader" where he applied this to the MACD to improve its signals and remove its lagging issue. This filter uses his leading MACD's "modified EMA" and can be used as a zero lag filter.
Linear Regression Value - LSMA (Least Squares Moving Average)
LSMA as a Moving Average is based on plotting the end point of the linear regression line. It compares the current value to the prior value and a determination is made of a possible trend, eg. the linear regression line is pointing up or down.
Linear Weighted Moving Average - LWMA
LWMA reacts to price quicker than the SMA and EMA. Although it's similar to the Simple Moving Average, the difference is that a weight coefficient is multiplied to the price which means the most recent price has the highest weighting, and each prior price has progressively less weight. The weights drop in a linear fashion.
McGinley Dynamic
John McGinley created this Moving Average to track price better than traditional Moving Averages. It does this by incorporating an automatic adjustment factor into its formula, which speeds (or slows) the indicator in trending, or ranging, markets.
McNicholl EMA
Dennis McNicholl developed this Moving Average to use as his center line for his "Better Bollinger Bands" indicator and was successful because it responded better to volatility changes over the standard SMA and managed to avoid common whipsaws.
Non lag moving average
The Non Lag Moving average follows price closely and gives very quick signals as well as early signals of price change. As a standalone Moving Average, it should not be used on its own, but as an additional confluence tool for early signals.
Parabolic Weighted Moving Average
The Parabolic Weighted Moving Average is a variation of the Linear Weighted Moving Average. The Linear Weighted Moving Average calculates the average by assigning different weight to each element in its calculation. The Parabolic Weighted Moving Average is a variation that allows weights to be changed to form a parabolic curve. It is done simply by using the Power parameter of this indicator.
Recursive Moving Trendline
Dennis Meyers's Recursive Moving Trendline uses a recursive (repeated application of a rule) polynomial fit, a technique that uses a small number of past values estimations of price and today's price to predict tomorrows price.
Simple Moving Average - SMA
The SMA calculates the average of a range of prices by adding recent prices and then dividing that figure by the number of time periods in the calculation average. It is the most basic Moving Average which is seen as a reliable tool for starting off with Moving Average studies. As reliable as it may be, the basic moving average will work better when it's enhanced into an EMA.
Sine Weighted Moving Average
The Sine Weighted Moving Average assigns the most weight at the middle of the data set. It does this by weighting from the first half of a Sine Wave Cycle and the most weighting is given to the data in the middle of that data set. The Sine WMA closely resembles the TMA (Triangular Moving Average).
Smoothed Moving Average - SMMA
The Smoothed Moving Average is similar to the Simple Moving Average (SMA), but aims to reduce noise rather than reduce lag. SMMA takes all prices into account and uses a long lookback period. Due to this, it's seen a an accurate yet laggy Moving Average.
Smoother
The Smoother filter is a faster-reacting smoothing technique which generates considerably less lag than the SMMA (Smoothed Moving Average). It gives earlier signals but can also create false signals due to its earlier reactions. This filter is sometimes wrongly mistaken for the superior Jurik Smoothing algorithm.
Super Smoother
The Super Smoother filter uses John Ehlers’s “Super Smoother” which consists of a a Two pole Butterworth filter combined with a 2-bar SMA (Simple Moving Average) that suppresses the 22050 Hz Nyquist frequency: A characteristic of a sampler, which converts a continuous function or signal into a discrete sequence.
Three pole Ehlers Butterworth
The 3 pole Ehlers Butterworth (as well as the Two pole Butterworth) are both superior alternatives to the EMA and SMA. They aim at producing less lag whilst maintaining accuracy. The 2 pole filter will give you a better approximation for price, whereas the 3 pole filter has superior smoothing.
Three pole Ehlers smoother
The 3 pole Ehlers smoother works almost as close to price as the above mentioned 3 Pole Ehlers Butterworth. It acts as a strong baseline for signals but removes some noise. Side by side, it hardly differs from the Three Pole Ehlers Butterworth but when examined closely, it has better overshoot reduction compared to the 3 pole Ehlers Butterworth.
Triangular Moving Average - TMA
The TMA is similar to the EMA but uses a different weighting scheme. Exponential and weighted Moving Averages will assign weight to the most recent price data. Simple moving averages will assign the weight equally across all the price data. With a TMA (Triangular Moving Average), it is double smoother (averaged twice) so the majority of the weight is assigned to the middle portion of the data.
The TMA and Sine Weighted Moving Average Filter are almost identical at times.
Triple Exponential Moving Average - TEMA
The TEMA uses multiple EMA calculations as well as subtracting lag to create a tool which can be used for scalping pullbacks. As it follows price closely, it's signals are considered very noisy and should only be used in extremely fast-paced trading conditions.
Two pole Ehlers Butterworth
The 2 pole Ehlers Butterworth (as well as the three pole Butterworth mentioned above) is another filter that cuts out the noise and follows the price closely. The 2 pole is seen as a faster, leading filter over the 3 pole and follows price a bit more closely. Analysts will utilize both a 2 pole and a 3 pole Butterworth on the same chart using the same period, but having both on chart allows its crosses to be traded.
Two pole Ehlers smoother
A smoother version of the Two pole Ehlers Butterworth. This filter is the faster version out of the 3 pole Ehlers Butterworth. It does a decent job at cutting out market noise whilst emphasizing a closer following to price over the 3 pole Ehlers.
Volume Weighted EMA - VEMA
Utilizing tick volume in MT4 (or real volume in MT5), this EMA will use the Volume reading in its decision to plot its moves. The more Volume it detects on a move, the more authority (confirmation) it has. And this EMA uses those Volume readings to plot its movements.
Studies show that tick volume and real volume have a very strong correlation, so using this filter in MT4 or MT5 produces very similar results and readings.
Zero Lag DEMA - Zero Lag Double Exponential Moving Average
John Ehlers's Zero Lag DEMA's aim is to eliminate the inherent lag associated with all trend following indicators which average a price over time. Because this is a Double Exponential Moving Average with Zero Lag, it has a tendency to overshoot and create a lot of false signals for swing trading. It can however be used for quick scalping or as a secondary indicator for confluence.
Zero Lag Moving Average
The Zero Lag Moving Average is described by its creator, John Ehlers, as a Moving Average with absolutely no delay. And it's for this reason that this filter will cause a lot of abrupt signals which will not be ideal for medium to long-term traders. This filter is designed to follow price as close as possible whilst de-lagging data instead of basing it on regular data. The way this is done is by attempting to remove the cumulative effect of the Moving Average.
Zero Lag TEMA - Zero Lag Triple Exponential Moving Average
Just like the Zero Lag DEMA, this filter will give you the fastest signals out of all the Zero Lag Moving Averages. This is useful for scalping but dangerous for medium to long-term traders, especially during market Volatility and news events. Having no lag, this filter also has no smoothing in its signals and can cause some very bizarre behavior when applied to certain indicators.
________________________________________________________________
What are Heiken Ashi "better" candles?
The "better formula" was proposed in an article/memo by BNP-Paribas (In Warrants & Zertifikate, No. 8, August 2004 (a monthly German magazine published by BNP Paribas, Frankfurt), there is an article by Sebastian Schmidt about further development (smoothing) of Heikin-Ashi chart.)
They proposed to use the following:
(Open+Close)/2+(((Close-Open)/( High-Low ))*ABS((Close-Open)/2))
instead of using :
haClose = (O+H+L+C)/4
According to that document the HA representation using their proposed formula is better than the traditional formula.
What are traditional Heiken-Ashi candles?
The Heikin-Ashi technique averages price data to create a Japanese candlestick chart that filters out market noise.
Heikin-Ashi charts, developed by Munehisa Homma in the 1700s, share some characteristics with standard candlestick charts but differ based on the values used to create each candle. Instead of using the open, high, low, and close like standard candlestick charts, the Heikin-Ashi technique uses a modified formula based on two-period averages. This gives the chart a smoother appearance, making it easier to spots trends and reversals, but also obscures gaps and some price data.
Expanded generic source types:
Close = close
Open = open
High = high
Low = low
Median = hl2
Typical = hlc3
Weighted = hlcc4
Average = ohlc4
Average Median Body = (open+close)/2
Trend Biased = (see code, too complex to explain here)
Trend Biased (extreme) = (see code, too complex to explain here)
Included:
-Toggle bar color on/off
-Toggle signal line on/off

ROCkin RSIROCkin RSI Indicator
Overview
The "ROCkin RSI" indicator combines the traditional Relative Strength Index (RSI) with an innovative approach using the Rate of Change (ROC) to offer a new way to visualize and interpret market momentum. By averaging the slope of the RSI over time and allowing for different types of moving averages, this indicator aims to help traders identify trending and reversal patterns more efficiently.
Features
RSI Calculations: The core of the indicator is based on the standard Relative Strength Index, an oscillator that measures the speed and change of price movements. The RSI oscillates between 0 and 100 and is usually used to identify overbought or oversold conditions.
Rate of Change of Price (ROC): Instead of simply plotting the RSI, this indicator calculates the Rate of Change of the closing price, essentially looking at how steep the RSI curve is over a user-defined period.
Smoothing: To reduce noise and make the curve smoother, the slope of the RSI is averaged over a given number of periods, which can either be a Simple Moving Average (SMA) or an Exponential Moving Average (EMA).
Column Plots: The smoothed RSI slope is plotted as columns, where the color of the columns (red or green) indicates whether the slope is positive or negative.
Optional RSI Moving Average: The indicator also offers an optional feature to plot a moving average of the smoothed RSI slope, aiding in trend identification.
Inputs
RSI Periods: The number of periods used to calculate the RSI.
Slope Periods: The number of periods used for calculating the Rate of Change.
Average Periods: The number of periods used for smoothing the RSI slope.
Type of Average: Choose between EMA (Exponential Moving Average) and SMA (Simple Moving Average) for smoothing.
Show RSI Moving Average: Toggle this to either show or hide the moving average of the smoothed RSI slope.
Moving Average Period: The period used for calculating the RSI Moving Average.
Moving Average Type: Choose between EMA and SMA for the RSI Moving Average.
How to Interpret
Positive Slope (Red Columns): Indicates upward momentum in the RSI, which may imply a bullish trend.
Negative Slope (Green Columns): Indicates downward momentum in the RSI, suggesting a possible bearish trend.
RSI Moving Average: Acts as a signal line to confirm the trend. When the smoothed RSI slope is above its moving average, it confirms the bullish trend, and when it's below, it confirms the bearish trend.
Practical Use
Entry/Exit Signals: Consider entering a long position when the columns of the green histogram cross above the moving average. Conversely, consider entering a short position when the columns cross under when red. The higher the columns the more likely the trade will be a good one.
Fine-Tuning and Optimization
It's crucial to understand that the default settings might not be optimal for all trading scenarios. The effectiveness of the ROCkin RSI indicator can vary based on the asset you're trading, the market conditions, and your trading style. Therefore, it's highly recommended to play with the settings and study the historical performance on the chart to grasp how the indicator behaves.
By experimenting with different periods for RSI, the Rate of Change, and the moving averages, you can tailor the indicator to better suit your needs. Studying how the indicator would have performed in the past can help you understand its potential strengths and weaknesses. Once you've got a feel for how it operates, you can then optimize the settings to align with your trading strategy and risk tolerance.

Multi-Moving Average Buy/Sell IndicatorThis Multi-Moving Average Buy/Sell Indicator is a powerful and customizable tool designed to help traders identify potential buy and sell signals based on the interaction between price and multiple moving averages. Whether you're a day trader, swing trader, or long-term investor, this indicator provides clear visual cues and alerts to help you make informed trading decisions.
Key Features
1. Multiple Moving Averages
The indicator calculates four key moving averages:
9-period MA
20-period MA
50-period MA
180-period MA
You can choose the type of moving average:
SMA (Simple Moving Average)
EMA (Exponential Moving Average)
WMA (Weighted Moving Average)
2. Custom Timeframe
Select a custom timeframe from a user-friendly dropdown menu:
1 Minute
5 Minutes
15 Minutes
30 Minutes
1 Hour
4 Hours
Daily
Weekly
The indicator dynamically adjusts to the selected timeframe, making it suitable for all trading styles.
3. Buy/Sell Signals
Buy Signal: Triggered when the price crosses above any of the moving averages.
Sell Signal: Triggered when the price crosses below any of the moving averages.
Signals are displayed as labels on the chart:
Green "BUY" Label: Below the bar when a buy signal is triggered.
Red "SELL" Label: Above the bar when a sell signal is triggered.
4. Visualization
Toggle the visibility of all moving averages using the showAllMAs input.
Moving averages are plotted with distinct colors for easy identification:
9 MA: Blue
20 MA: Orange
50 MA: Purple
180 MA: Teal
5. Alerts
The indicator generates alerts for buy and sell signals, which can be used for notifications or automated trading.
How to Use
Add the Indicator:
Open TradingView and go to the Pine Script Editor.
Copy and paste the script into the editor.
Click Add to Chart.
Configure Inputs:
maType: Choose the type of moving average (SMA, EMA, WMA).
timeframe: Select a custom timeframe (e.g., "1 Minute", "Daily").
showSignals: Toggle to show or hide buy/sell signals.
showAllMAs: Toggle to show or hide all moving averages.
Interpret the Signals:
Look for green "BUY" labels below the bars for potential buy opportunities.
Look for red "SELL" labels above the bars for potential sell opportunities.
Set Alerts:
Use the built-in alert system to get notified when buy or sell signals are triggered.
Example Use Cases
Day Trading
Use a 1-minute or 5-minute timeframe with an EMA for quick signals.
Example Inputs:
maType = "EMA"
timeframe = "5 Minutes"
showAllMAs = true
Swing Trading
Use a daily timeframe with an SMA for longer-term signals.
Example Inputs:
maType = "SMA"
timeframe = "Daily"
showAllMAs = false
Why Use This Indicator?
Versatility: Suitable for all trading styles and timeframes.
Customization: Choose your preferred moving average type and timeframe.
Clear Signals: Easy-to-read buy/sell labels and moving averages.
Alerts: Never miss a trading opportunity with built-in alerts.
Limitations
False Signals:
The indicator may generate false signals in choppy or sideways markets. Always combine it with other tools (e.g., RSI, volume analysis) for better accuracy.
Timeframe Dependency:
The effectiveness of the signals depends on the selected timeframe. Shorter timeframes may produce more signals but with higher noise.
No Backtesting:
The script does not include backtesting functionality. Test the strategy manually on historical data.
Customization Options
Add More Moving Averages: Modify the script to include additional moving averages (e.g., 200 MA).
Change Signal Logic: Adjust the conditions for buy/sell signals (e.g., require confirmation from multiple moving averages).
Add Alerts for Specific MAs: Create separate alerts for signals based on specific moving averages (e.g., only 9 MA or 50 MA).

Custom Moving Average Ribbon with EMA Table & Text ColorComprehensive Description of the Custom Moving Average Ribbon with EMA Table & Text Color
The Custom Moving Average Ribbon with EMA Table & Text Color is a highly flexible and customizable indicator designed for traders who use multiple moving averages to assess trends, strength, and potential market reversals. It plots up to 8 moving averages (either SMA, EMA, WMA, or VWMA) on the price chart and displays a table summarizing the moving averages’ values, periods, and colors. The table also allows for the customization of the text color, making it easier to align with your chart’s theme or preference.
Key Features:
Multiple Moving Averages: You can display up to 8 moving averages (MA), each of which can be customized in terms of:
Type: SMA (Simple Moving Average), EMA (Exponential Moving Average), WMA (Weighted Moving Average), or VWMA (Volume-Weighted Moving Average).
Period: Each moving average has a user-defined period, which allows for flexibility depending on your trading style (short-term, medium-term, or long-term).
Enable/Disable: Each moving average can be independently enabled or disabled based on your preference.
Moving Average Ribbon: The indicator visualizes multiple moving averages as a ribbon, giving traders insight into the market's underlying trend. The interaction between these moving averages provides essential signals:
Uptrend: Shorter-term MAs above longer-term MAs, all sloping upward.
Downtrend: Shorter-term MAs below longer-term MAs, sloping downward.
Consolidation: MAs tightly packed, indicating low volatility or a sideways market.
Customizable Table: The indicator includes a table that displays:
The Name of each moving average (e.g., MA 1, MA 2, etc.).
The Period used for each moving average.
The Current Value of each moving average.
Color Coding for easier visual identification on the chart.
Text Color Customization: You can change the text color in the table to match your chart style or to ensure high visibility.
Responsive Design: This indicator works on any time frame, whether you're a day trader, swing trader, or long-term investor, and the table adjusts dynamically as new data comes in.
How to Use the Indicator
a) Trend Identification
The Custom Moving Average Ribbon helps in identifying trends and their strength. Here’s how you can interpret the plotted moving averages:
Uptrend (Bullish):
If the shorter-term moving averages (e.g., 5-period, 10-period) are above the longer-term moving averages (e.g., 50-period, 200-period), and all the MAs are sloping upward, it suggests a strong bullish trend.
The greater the separation between the moving averages, the stronger the uptrend.
Use the table to quickly verify the current value of each MA and confirm that the price is staying above most or all of the MAs.
Downtrend (Bearish):
When shorter-term moving averages are below the longer-term moving averages and all MAs are sloping downward, this indicates a bearish trend.
Greater separation between MAs indicates a stronger downtrend.
Neutral/Consolidating Market:
If the MAs are tightly packed and frequently crossing each other, the market is likely consolidating, and a strong trend is not in play.
In these situations, it’s better to wait for a clearer signal before taking any positions.
b) Reversal Signals
Golden Cross: When a short-term moving average (e.g., 50-period) crosses above a long-term moving average (e.g., 200-period), this is considered a bullish signal, suggesting a possible upward trend.
Death Cross: When a short-term moving average crosses below a long-term moving average, it’s considered a bearish signal, indicating a potential downward trend.
c) Using the Table for Quick Reference
The table allows you to monitor:
The current price value relative to each moving average. If the price is above most MAs, the market is likely in an uptrend, and if below, in a downtrend.
Changes in MA values: If you see values of shorter-term MAs moving closer to or crossing longer-term MAs, this could indicate a weakening trend or a potential reversal.
How to Combine this Indicator with Other Indicators for a Solid Strategy
The Custom Moving Average Ribbon is powerful on its own but can be enhanced when combined with other technical indicators to form a comprehensive trading strategy.
1. Combining with RSI (Relative Strength Index)
How It Works: RSI is a momentum oscillator that measures the speed and change of price movements, typically over 14 periods. It ranges from 0 to 100, with readings above 70 considered overbought and below 30 considered oversold.
Strategy:
Overbought in an Uptrend: If the moving average ribbon indicates an uptrend but the RSI shows the market is overbought (RSI > 70), it could signal a pullback or correction is imminent.
Oversold in a Downtrend: If the moving average ribbon indicates a downtrend but the RSI shows oversold conditions (RSI < 30), a bounce or reversal may be on the horizon.
2. Combining with MACD (Moving Average Convergence Divergence)
How It Works: MACD tracks the difference between two exponential moving averages, typically the 12-period and 26-period EMAs. It generates buy and sell signals based on crossovers and divergences.
Strategy:
Trend Confirmation: Use the MACD to confirm the direction and momentum of the trend indicated by the moving average ribbon. For example, if the MACD line crosses above the signal line while the shorter-term MAs are above the longer-term MAs, it confirms strong bullish momentum.
Divergences: Watch for divergences between price action and MACD. If price is making higher highs but MACD is making lower highs, it could signal a weakening trend, which you can verify using the moving averages.
3. Combining with Bollinger Bands
How It Works: Bollinger Bands plot two standard deviations above and below a moving average, typically the 20-period SMA. The bands widen during periods of high volatility and contract during periods of low volatility.
Strategy:
Breakout or Reversal: If price action moves above the upper Bollinger Band while the shorter-term MAs are crossing above the longer-term MAs, it confirms a strong breakout. Conversely, if price touches or falls below the lower Bollinger Band and the shorter MAs start crossing below the longer-term MAs, it indicates a potential breakdown.
Mean Reversion: In sideways markets, when the moving averages are tightly packed, Bollinger Bands can help spot mean reversion opportunities (buy near the lower band, sell near the upper band).
4. Combining with Volume Indicators
How It Works: Volume is a crucial confirmation indicator for any trend or breakout. Combining volume with the moving average ribbon can enhance your strategy.
Strategy:
Trend Confirmation: If the price breaks above the moving averages and is accompanied by high volume, it confirms a strong breakout. Similarly, if price breaks below the moving averages on high volume, it signals a strong downtrend.
Divergence: If price continues to trend in one direction but volume decreases, it could indicate a weakening trend, helping you prepare for a reversal.
Example Strategies Using the Indicator
Trend-Following Strategy:
Use the moving average ribbon to identify the main trend.
Combine with MACD or RSI for confirmation of momentum.
Enter trades when the shorter-term MAs confirm the trend and the confirmation indicator (MACD or RSI) aligns with the trend.
Exit trades when the moving averages start converging or when your confirmation indicator shows signs of reversal.
Reversal Strategy:
Wait for significant crossovers in the moving averages (Golden Cross or Death Cross).
Confirm the reversal with divergence in MACD or RSI.
Use Bollinger Bands to fine-tune your entry and exit points based on overbought/oversold conditions.
Conclusion
The Custom Moving Average Ribbon with EMA Table & Text Color indicator provides a robust framework for traders looking to use multiple moving averages to gauge trend direction, strength, and potential reversals. By combining it with other technical indicators like RSI, MACD, Bollinger Bands, and volume, you can develop a solid trading strategy that enhances accuracy, reduces false signals, and maximizes profit potential in various market conditions.
This indicator offers high flexibility with customization options, making it suitable for traders of all levels and strategies. Whether you're trend-following, scalping, or swing trading, this tool provides invaluable insights into market movements.

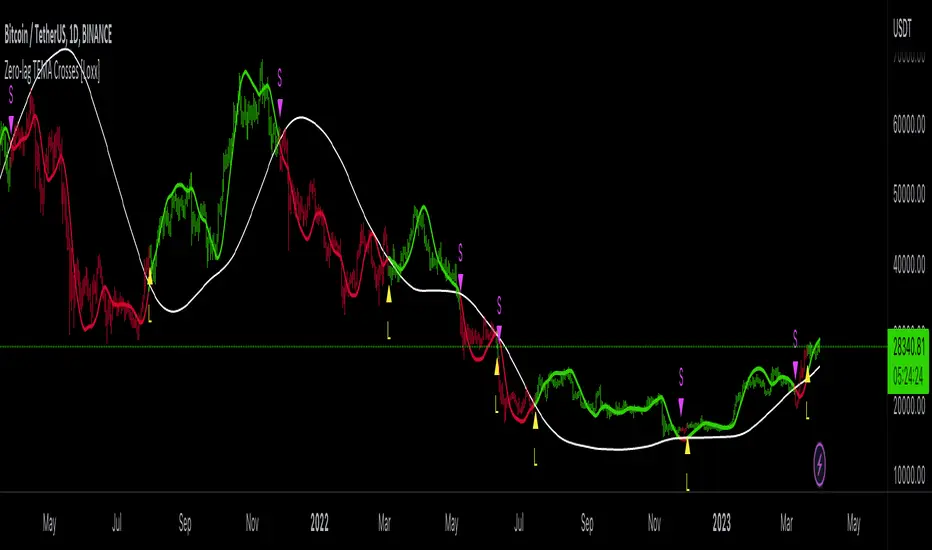
Zero-lag TEMA Crosses [Loxx]Zero-lag TEMA Crosses is a spinoff of a the Zero-lag MA as described by David Stendahl in the April 2000 issue of the journal "Technical Analysis of Stocks and Commodities". This indicator uses TEMA calculation mode in order to make the lag lesser compared to the original Zero-lag MA, and that makes this version even faster than the Zero-lag DEMA too. This indicator is the difference between a Fast and Slow Zero-lag TEMA. This indicator is very useful for lower timeframe scalping.
What is the Zero-lag MA?
The Zero-lag MA (Zero-Lag Moving Average) is a technical indicator that was introduced in the April 2000 issue of the journal "Technical Analysis of Stocks and Commodities" by David Stendahl.
The Zero-lag MA is a type of moving average (MA) that is designed to reduce or eliminate the lag that is typically associated with traditional moving averages. Moving averages are a widely used technical analysis tool that helps traders to identify trends and potential trading opportunities. They work by calculating the average price of a security over a given period of time, and then plotting that average on a chart. The most commonly used moving averages are simple moving averages (SMAs) and exponential moving averages (EMAs).
The problem with traditional moving averages is that they can be slow to respond to changes in market conditions. This lag can cause traders to miss out on potential trading opportunities, or to enter or exit trades at the wrong time. The Zero-lag MA was developed as a solution to this problem.
The Zero-lag MA is calculated using a combination of two EMAs and a subtraction formula. The first step in calculating the Zero-lag MA is to calculate two exponential moving averages: a fast EMA and a slow EMA. The fast EMA is calculated over a shorter period of time than the slow EMA. The exact period lengths will depend on the trader's preferences and the security being analyzed.
Once the two EMAs have been calculated, the next step is to take the difference between them. This difference represents the current market trend, with a positive value indicating an uptrend and a negative value indicating a downtrend. However, this difference alone is not enough to create a useful indicator, as it can still suffer from lag.
To further reduce lag, the difference between the two EMAs is multiplied by a factor derived from a third, slower EMA. This slower EMA acts as a smoothing factor, helping to reduce noise and make the indicator more accurate. The exact period length of the slower EMA will depend on the trader's preferences and the security being analyzed.
The final step in calculating the Zero-lag MA is to add the result of the multiplication to the fast EMA. This produces a final value that represents the current market trend with reduced lag. The Zero-lag MA can be plotted on a chart like any other moving average, and can be used to identify trends, potential trading opportunities, and support and resistance levels.
Overall, the Zero-lag MA is designed to provide traders with a more accurate representation of current market conditions by reducing the lag time between price changes and the moving average. By doing so, it can help traders to make more informed trading decisions and improve their overall profitability.
What is the TEMA?
The triple exponential moving average (TEMA) is a technical analysis indicator that was developed to reduce the lag of traditional moving averages, such as the simple moving average (SMA) or the exponential moving average (EMA). The TEMA was first introduced by Patrick Mulloy in the January 1994 issue of the "Technical Analysis of Stocks and Commodities" magazine.
The TEMA is a type of moving average that is calculated by applying multiple exponential smoothing techniques to price data. Unlike traditional moving averages, which apply a single smoothing factor to price data, the TEMA applies three smoothing factors to produce a more responsive and accurate indicator.
To calculate the TEMA, the following steps are taken:
Calculate the single exponential moving average (SMA) of the price data over a given period.
Calculate the double exponential moving average (DEMA) of the SMA over the same period.
Calculate the triple exponential moving average (TEMA) of the DEMA over the same period.
The formula for calculating the TEMA is:
TEMA = 3 * EMA(SMA) - 3 * EMA(EMA(SMA)) + EMA(EMA(EMA(SMA)))
where EMA is the exponential moving average and SMA is the simple moving average.
The TEMA is designed to reduce the lag associated with traditional moving averages by applying multiple smoothing factors to the price data. This helps to filter out short-term price fluctuations and provide a smoother indicator of the underlying trend. The TEMA is also less susceptible to whipsaws, which occur when a security's price moves in one direction and then quickly reverses, causing false trading signals.
The TEMA can be used in a variety of ways in technical analysis. It can be used to identify trends, determine support and resistance levels, and generate trading signals. When the TEMA is rising, it is generally interpreted as a bullish signal, indicating that the price is trending higher. When the TEMA is falling, it is generally interpreted as a bearish signal, indicating that the price is trending lower.
In summary, the TEMA is a more responsive and accurate indicator than traditional moving averages, designed to reduce lag and provide a smoother representation of the underlying trend. It is a useful tool for technical analysts and traders looking to identify trends, support and resistance levels, and potential trading opportunities.
Extras
Alerts
Bar coloring
Signals
Loxx's Expanded Source Types, see here:
VIX, ATR, and Volatility Indicatorhere what the indictor do !
The "VIX, ATR, and Volatility Indicator" combines the Volatility Index (VIX), Average True Range (ATR), and moving averages to provide insights into market volatility.
VIX (Volatility Index):
The VIX measures the expected volatility in the market over the next 30 days. A higher VIX value indicates increased market volatility, while a lower value suggests lower volatility.
ATR (Average True Range):
The ATR is a technical indicator that measures the average range between high and low prices over a specified period. It provides a sense of the market's volatility by considering price movements. Higher ATR values indicate greater volatility, while lower values indicate lower volatility.
Moving Averages:
The indicator calculates both an Exponential Moving Average (EMA) and Simple Moving Average (SMA) with a specific period (e.g., 50).
Moving averages smooth out price data to identify trends and potential areas of support or resistance.
Volatility Detection:
By comparing the current closing price to the EMA and SMA, the indicator determines if there is high volatility.
If the current closing price is higher than either the EMA or SMA, it indicates potential high volatility.
Visualization:
The VIX and ATR are typically plotted on the chart, providing a visual representation of market volatility and price range.
Additionally, markers or labels may be used to highlight periods of high volatility when the current price exceeds the moving averages.
what are the VIX and ATR
Volatility Index (VIX):
Monitor the VIX value from financial platforms or market data providers. A higher VIX value indicates increased market volatility, suggesting potential trading opportunities. Conversely, a lower VIX value indicates lower volatility, which may influence your trading strategy.
Average True Range (ATR):
Calculate the ATR manually or use charting platforms that provide ATR as an indicator.
Plot the ATR on your trading chart to visualize the range of price movements.
Determine suitable entry and exit points based on ATR values. For example, higher ATR values may indicate larger potential price swings, while lower ATR values may suggest a more stable market.
how it work
Fetching VIX Data:
The request.security function is used to fetch the daily VIX data from the "CBOE:VIX" symbol. It retrieves the closing price of the VIX for each day.
Calculating ATR:
The ta.atr function calculates the Average True Range (ATR) with a period of 14. ATR measures the average range between the high and low prices over the specified period, providing an indication of market volatility.
Calculating Moving Averages:
Two types of moving averages are calculated: Exponential Moving Average (EMA) and Simple Moving Average (SMA). Both moving averages are calculated using a period of 50, but you can adjust the period as needed.
The ta.ema function calculates the Exponential Moving Average, which places greater weight on recent prices.
The ta.sma function calculates the Simple Moving Average, which gives equal weight to all prices in the period.
Identifying High Volatility:
The indicator determines if there is high volatility by comparing the current closing price to both the EMA and SMA.
If the current closing price is higher than either the EMA or SMA, the isHighVolatility variable is set to true, indicating potential high volatility.
Plotting the Indicators:
The VIX and ATR are plotted using the plot function, assigning colors and line widths for visual differentiation.
The plotshape function is used to plot markers below the bars to indicate highly volatile periods. The isHighVolatility variable determines when the markers appear.

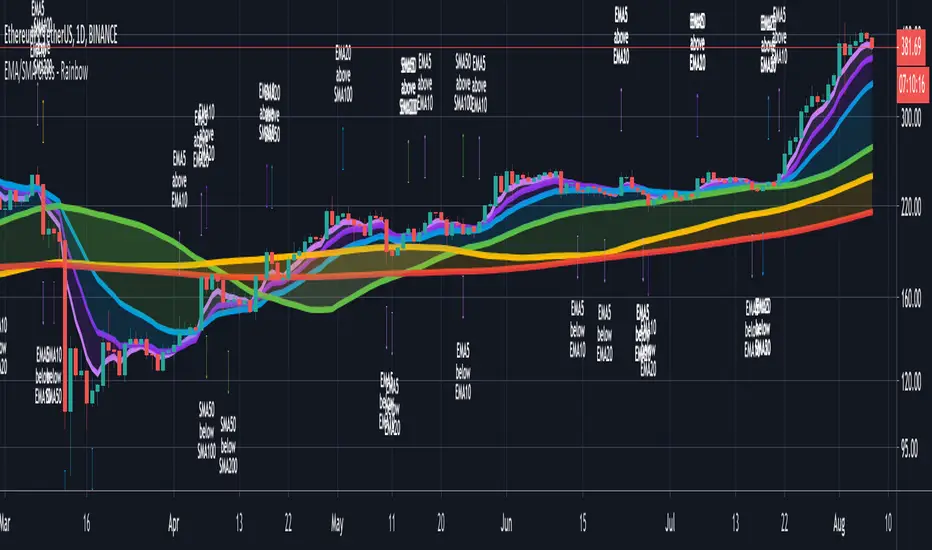
CryptoSignalScanner - Advanced Moving Averages - Cross & RainbowDESCRIPTION:
With this script you can plot 6 moving averages.
You can decide which Moving Average you want to show or hide.
For every plot you can decide to display the Simple Moving Average ( SMA ) or Exponential Moving Average ( EMA ).
It provides CrossOver and CrossUnder labels when loading the script. Those labels you can show or hide.
You have the possibility to show or hide the rainbow colors. This rainbow function gives you a clear view of the current trend.
HOW TO USE:
• When one Moving Average crosses above another Moving Average it signals an uptrend.
• When one Moving Average crosses below another Moving Average it signals a downtrend.
• The higher to length of the Moving Average the stronger the trend.
FEATURES:
• You can show/hide the preferred Moving Averages.
• You can set the length, type and source for every Moving Average.
• You can show/hide the rainbow colors.
• You can show/hide the CrossUp labels.
• You can show/hide the CrossDown labels.
• You can set alerts for every Moving Average.
• Etc...
DEFAULT SETTINGS:
• MA1 => EMA5
• MA2 => EMA10
• MA3 => EMA20
• MA4 => SMA50
• MA5 => SMA100
• MA6 => SMA200
Simple Moving Average vs. Exponential Moving Average:
SMA and EMA are calculated differently. The exponential moving average ( EMA ) focuses more on recent prices than on a long series of data points, as the simple moving average required.
The calculation makes the EMA quicker to react to price changes and the SMA react slower. That is the main difference between the two.
One is not necessarily better than another. It comes down to personal preference. Plot an EMA and SMA of the same length on a chart and see which one helps you make better trading decisions.
Moving Average Trading Strategies:
The first strategy is a price crossover, when the price crosses above or below a moving average, it signals a potential change in trend.
The second strategy applies when one moving averages crosses another moving average.
• When the short-term MA crosses above the long-term MA, it signals a buy signal.
• When the short-term MA crosses below the long-term MA, it signals a sell signal.
REMARKS:
• This advice is NOT financial advice.
• We do not provide personal investment advice and we are not a qualified licensed investment advisor.
• All information found here, including any ideas, opinions, views, predictions, forecasts, commentaries, suggestions, or stock picks, expressed or implied herein, are for informational, entertainment or educational purposes only and should not be construed as personal investment advice.
• We will not and cannot be held liable for any actions you take as a result of anything you read here.
• We only provide this information to help you make a better decision.
• While the information provided is believed to be accurate, it may include errors or inaccuracies.
If you like this script please donate some coins to share your appreciation.
Good Luck,
SEOCO
Keltner Channel With User Selectable Moving AvgKeltner Channel with user options to calculate the moving average basis and envelopes from a variety of different moving averages.
The user selects their choice of moving average, and the envelopes automatically adjust. The user may select a MA that reacts faster to volatility or slower/smoother.
Added additional options to color the envelopes or basis based on the current trend and alternate candle colors for envelope touches. The script has a rainbow gradient by default based on RSI.
Options (generally from slower/smoother to faster/more responsive to volatility):
SMMA,
SMA,
Donchian, (Note: Selecting Donchian will just convert this indicator to a regular Donchian Channel)
Tillson T3,
EMA,
VWMA,
WMA,
EHMA,
ALMA,
LSMA,
HMA,
TEMA
Value Added:
Allows Keltner Channel to be calculated from a variety of moving averages other than EMA/SMA, including ones that are well liked by traders such as Tillson T3, ALMA, Hull MA, and TEMA.
Glossary:
The Hull Moving Average ( HMA ), developed by Alan Hull, is an extremely fast and smooth moving average . In fact, the HMA almost eliminates lag altogether and manages to improve smoothing at the same time.
The Exponential Hull Moving Average is similar to the standard Hull MA, but with superior smoothing. The standard Hull Moving Average is derived from the weighted moving average ( WMA ). As other moving average built from weighted moving averages it has a tendency to exaggerate price movement.
Weighted Moving Average: A Weighted Moving Average ( WMA ) is similar to the simple moving average ( SMA ), except the WMA adds significance to more recent data points.
Arnaud Legoux Moving Average: ALMA removes small price fluctuations and enhances the trend by applying a moving average twice, once from left to right, and once from right to left. At the end of this process the phase shift (price lag) commonly associated with moving averages is significantly reduced. Zero-phase digital filtering reduces noise in the signal. Conventional filtering reduces noise in the signal, but adds a delay.
Least Squares: Based on sum of least squares method to find a straight line that best fits data for the selected period. The end point of the line is plotted and the process is repeated on each succeeding period.
Triple EMA (TEMA) : The triple exponential moving average (TEMA) was designed to smooth price fluctuations, thereby making it easier to identify trends without the lag associated with traditional moving averages (MA). It does this by taking multiple exponential moving averages (EMA) of the original EMA and subtracting out some of the lag.
Running (SMoothed) Moving Average: A Modified Moving Average (MMA) (otherwise known as the Running Moving Average (RMA), or SMoothed Moving Average (SMMA)) is an indicator that shows the average value of a security's price over a period of time. It works very similar to the Exponential Moving Average, they are equivalent but for different periods (e.g., the MMA value for a 14-day period will be the same as EMA-value for a 27-days period).
Volume-Weighted Moving Average: The Volume-weighted Moving Average (VWMA) emphasizes volume by weighing prices based on the amount of trading activity in a given period of time. Users can set the length, the source and an offset. Prices with heavy trading activity get more weight than prices with light trading activity.
Tillson T3: The Tillson moving average a.k.a. the Tillson T3 indicator is one of the smoothest moving averages and is both composite and adaptive.

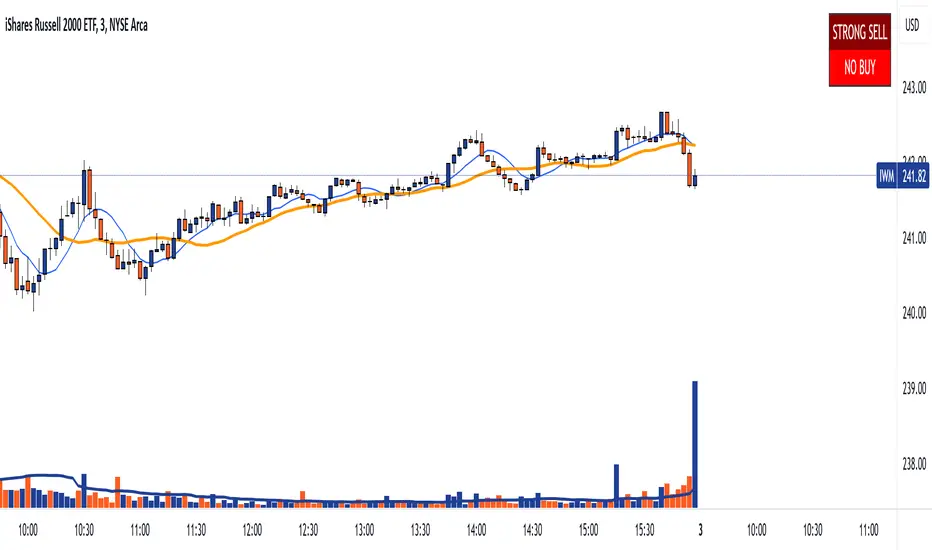
DTS- Dynamic Trend SignalDynamic Trend Signal
The Dynamic Trend Signal indicator is a powerful and highly customizable tool designed for traders who want clear and actionable signals to guide their trading decisions. This indicator leverages the relationship between two moving averages and the current price to provide concise buy/sell recommendations while visually enhancing your chart with professional-grade features.
Key Features:
Actionable Trading Signals:
STRONG BUY / NO SELL: When the price is above both moving averages.
BUY / NO SELL: When the price is above the longer moving average but below the shorter moving average.
NO BUY / SELL: When the price is below the longer moving average but above the shorter moving average.
STRONG SELL / NO BUY: When the price is below both moving averages.
Dynamic Signal Table:
Displays real-time trading signals in a convenient table format.
Automatically updates based on market conditions.
Customizable table position (top-left, top-right, bottom-left, or bottom-right).
Dynamic background and text colors for improved visibility:
Green shades for bullish signals.
Red shades for bearish signals.
Customizable Moving Averages:
Configure each moving average independently:
Choose between Simple Moving Average (SMA) and Exponential Moving Average (EMA).
Set unique lengths, colors, and line thickness for each average.
Default settings:
MA1: Short-term (8-period) with thickness 1.
MA2: Long-term (20-period) with thickness 2.
Optional Crossover Alerts:
Visual and textual alerts for moving average crossovers:
BUY: When the shorter moving average crosses above the longer moving average.
SELL: When the shorter moving average crosses below the longer moving average.
Crossover alerts are disabled by default but can be easily enabled in settings.
Ease of Use:
Intuitive interface with clean and professional visuals.
Fully customizable to fit any trading strategy or chart style.
How It Helps Traders:
The Dynamic Trend Signal simplifies market analysis by removing guesswork and focusing on clear, data-driven signals. Whether you're a beginner looking for straightforward guidance or an experienced trader seeking to enhance your strategy, this indicator provides:
Confidence in decision-making with clear buy/sell signals.
Customization to align with your unique trading approach.
Clarity through visually appealing, color-coded signals and alerts.
Ideal For:
Swing Traders
Day Traders
Trend Followers
Traders looking to integrate a dynamic, rule-based approach to their analysis.
How to Use:
Add the Dynamic Trend Signal indicator to your chart.
Adjust the moving average lengths, types, colors, and thickness to suit your trading strategy.
Monitor the signal table for actionable recommendations.
Optionally enable crossover alerts for real-time buy/sell notifications.
Unlock the power of clear and actionable trading signals with the Dynamic Trend Signal! Add it to your TradingView chart today and take your trading strategy to the next level.
ATR Bands with Optional Risk/Reward Colors█ OVERVIEW
This indicator projects ATR bands and, optionally, colors them based on a risk/reward advantage for those who trade breakouts/breakdowns using moving averages as partial or full exit points.
█ DEFINITIONS
► True Range
The True Range is a measure of the volatility of a financial asset and is defined as the maximum difference among one of the following values:
- The high of the current period minus the low of the current period.
- The absolute value of the high of the current period minus the closing price of the previous period.
- The absolute value of the low of the current period minus the closing price of the previous period.
► Average True Range
The Average True Range was developed by J. Welles Wilder Jr. and was introduced in his 1978 book titled "New Concepts in Technical Trading Systems". It is calculated as an average of the true range values over a certain number of periods (usually 14) and is commonly used to measure volatility and set stop-loss and profit targets (1).
For example, if you are looking at a daily chart and you want to calculate the 14-day ATR, you would take the True Range of the previous 14 days, calculate their average, and this would be the ATR for that day. The process is then repeated every day to obtain a series of ATR values over time.
The ATR can be smoothed using different methods, such as the Simple Moving Average (SMA), the Exponential Moving Average (EMA), or others, depending on the user's preferences or analysis needs.
► ATR Bands
The ATR bands are created by adding or subtracting the ATR from a reference point (usually the closing price). This process generates bands around the central point that expand and contract based on market volatility, allowing traders to assess dynamic support and resistance levels and to adapt their trading strategies to current market conditions.
█ INDICATOR
► ATR Bands
The indicator provides all the essential parameters for calculating the ATR: period length, time frame, smoothing method, and multiplier.
It is then possible to choose the reference point from which to create the bands. The most commonly used reference points are Open, High, Low, and Close, but you can also choose the commonly used candle averages: HL2, HLC3, HLCC4, OHLC4. Among these, there is also a less common "OC2", which represents the average of the candle body. Additionally, two parameters have been specifically created for this indicator: Open/Close and High/Low.
With the "Open/Close" parameter, the upper band is calculated from the higher value between Open and Close, while the lower one is calculated from the lower value between Open and Close. In the case of bullish candles, therefore, the Close value is taken as the starting point for the upper band and the Open value for the lower one; conversely, in bearish candles, the Open value is used for the upper band and the Close value for the lower band. This setting can be useful for precautionally generating broader bands when trading with candlesticks like hammers or inverted hammers.
The "High/Low" parameter calculates the upper band starting from the High and the lower band starting from the Low. Among all the available options, this one allows drawing the widest bands.
Other possible options to improve the drawing of ATR bands, aligning them with the price action, are:
• Doji Smoothing: When the current candle is a doji (having the same Open and Close price), the bands assume the values they had on the previous candle. This can be useful to avoid steep fluctuations of the bands themselves.
• Extend to High/Low: Extends the bands to the High or Low values when they exceed the value of the band.
• Round Last Cent: Expands the upper band by one cent if the price ends with x.x9, and the lower band if the price ends with x.x1. This function only works when the asset's tick is 0.01.
► Risk/Reward Advantage
The indicator optionally colors the ATR bands after setting a breakpoint, one or two risk/reward ratios, and a series of moving averages. This function allows you to know in advance whether entering a trade can provide an advantage over the risk. The band is colored when the ratio between the distance from the break point to the band and the distance from the break point to the first available moving average reaches at least the set ratio value. It is possible to set two colorings, one for a minimum risk/reward ratio and one for an optimal risk/reward ratio.
The break point can be chosen between High/Low (High in case of breakout, Low in case of breakdown) or Open/Close (on breakouts, Close with bullish candles or Open with bearish candles; on breakdowns, Close with bearish candles or Open with bullish candles).
It is possible to choose up to 10 moving averages of various types, including the VWAP with the Anchor Period (2).
Depending on the "Price to MA" setting, the bands can be individually or simultaneously colored.
By selecting "Single Direction," the risk/reward calculation is performed only when all moving averages are above or below the break point, resulting in only one band being colored at a time. For this reason, when the break point is in between the moving averages, the calculation is not executed. This setting can be useful for strategies involving price movement from a level towards a series of specific moving averages (for example, in reversals starting from a certain level towards the VWAP with possible partial take profits on some previous moving averages, or simply in trend following towards one or more moving averages).
Choosing "Both Directions" the risk/reward ratio is calculated based on the first available moving averages both above and below the price. This setting is useful for those who operate in range bound markets or simply take advantage of movements between moving averages.
█ NOTE
This script may not be suitable for scalping strategies that require immediate entries due to the inability to know the ATR of a candle in advance until its closure. Once the candle is closed, you should have time to place a stop or stop-limit order, so your strategy should not anticipate an immediate start with the next candle. Even more conveniently, if your strategy involves an entry on a pullback, you can place a limit order at the breakout level.
(1) www.tradingview.com
(2) For convenience, the code for the Anchor Period has been entirely copied from the VWAP code provided by TradingView.

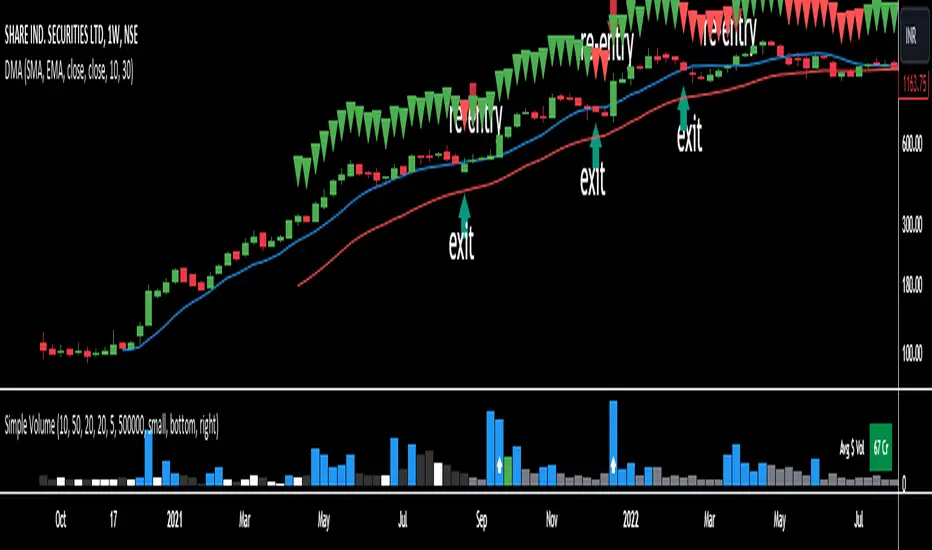
Dual Moving Average with DotsOverview:
The Dual Moving Average with Dots is a powerful technical analysis tool designed to assist traders in identifying potential trend reversals and confirming trend strength. This indicator combines the simplicity of dual moving averages with visual markers in the form of dots above candles, providing clear signals for both trend following and reversal opportunities.
Key Features:
Dual Moving Averages:
Choose between Simple Moving Average (SMA) and Exponential Moving Average (EMA) for two distinct moving averages.
Customize the source for each moving average, including options such as open, close, high, low, and more.
Adjust the periods for both moving averages to suit your trading preferences.
Visual Signals:
Green Dot: A green triangle-up dot appears above candles where the closing price is greater than both selected moving averages. This signals potential bullish strength and trend continuation.
Red Dot: A red triangle-down dot appears above candles where the closing price is lower than either of the selected moving averages. This signals potential bearish weakness and trend reversal.
Flexible Configuration:
Tailor the indicator to your trading strategy by adjusting parameters such as moving average type, source, and period for each average.
Gain insights into market dynamics by visually interpreting the relationship between closing prices and moving averages.
How to Use:
Trend Confirmation:
Confirm a bullish trend when the green dot appears above a candle, suggesting that the closing price is above both moving averages.
Confirm a bearish trend when the red dot appears above a candle, suggesting that the closing price is below either of the moving averages.
Reversal Signals:
Watch for potential trend reversals when red dots appear, signaling that the closing price is below one of the moving averages.
Customization for Strategy:
Experiment with different combinations of moving average types, sources, and periods to align the indicator with your unique trading strategy.
Usage Tips:
Combine the Dual Moving Average with Dots with other technical indicators for comprehensive market analysis.
Look for confluence with support/resistance levels or chart patterns to enhance the robustness of your trading decisions.
AI-Powered Breakout with Advanced FeaturesDescription
This script is designed to detect breakout moments in financial markets using a combination of traditional breakout detection methods and adaptive moving averages. By leveraging elements of artificial intelligence, the script provides a more dynamic and responsive approach to identifying potential entry and exit points in trading.
Usefulness
This script stands out by integrating a traditional breakout finder with an adaptive moving average component. The adaptive moving average adjusts dynamically based on the differences between fast and slow exponential moving averages (EMAs), offering a more flexible and responsive detection of support and resistance levels. This combination aims to reduce false signals and enhance the reliability of breakout detections, making it a valuable tool for traders seeking to capture market movements more effectively.
Features
1. Breakout Detection: Utilizes pivot highs and lows to identify significant breakout points over a user-defined period. This method helps in capturing the essential support and resistance levels that are critical in breakout trading.
2. AI Machine Learning Component - Adaptive Moving Average: Implements an adaptive moving average using two exponential moving averages (EMAs). adaptiveMA is dynamically adjusted based on the difference between a fast average and a slow average.
3. Buy/Sell Signals: The script generates buy and sell signals when bullish and bearish breakouts occur, respectively. These signals are visually represented on the chart, helping traders to quickly identify potential trading opportunities.
4. Visualization: Draws horizontal lines at identified breakout levels and plots shapes (arrows) on the chart to indicate buy/sell signals. This makes it easy for traders to see where significant breakout points are and where to consider entering or exiting trades.
Underlying Concepts
1. Breakout Finder Logic: The script uses pivot points (highs and lows) to detect breakout levels. It stores these pivot points in arrays and monitors them for persistence, ensuring that the detected breakouts are significant and reliable.
2. Adaptive Moving Average (AMA): The AMA is a key component that enhances the script's responsiveness. By calculating the differences between fast and slow EMAs, the AMA adapts to changing market conditions, providing a more accurate measure of trends and potential reversals.
How to Use
• Adjustable Parameters: The script includes several user-adjustable parameters:
o Lookback Length: Defines the period over which the script calculates the highest high and lowest low for breakout detection.
o Multiplier for Adaptive MA: Adjusts the sensitivity of the adaptive moving average.
o Period for Pivots: Sets the period for detecting pivot highs and lows.
o Max Breakout Length: Specifies the maximum length for breakout consideration.
o Threshold Rate: Determines the threshold rate for breakout validation.
o Minimum Number of Tests: Sets the minimum number of tests required to validate a breakout.
o Colors and Line Style: Customize the colors and line styles for breakout levels.
Interpreting Signals
o Green Arrows: Indicate a bullish breakout signal, suggesting a potential buy opportunity.
o Red Arrows: Indicate a bearish breakout signal, suggesting a potential sell opportunity.
o Horizontal Lines: Show the breakout levels, helping to visualize support and resistance areas.
By combining traditional breakout detection with advanced adaptive moving averages, this script aims to provide traders with a robust tool for identifying and capitalizing on market breakouts.
Credits
Parts of this script were inspired and adapted from the "Breakout Finder" script by LonesomeTheBlue. Significant improvements include the integration of the adaptive moving average component and enhancements to the breakout detection logic.

R-squared Adaptive T3 [Loxx]R-squared Adaptive T3 is an R-squared adaptive version of Tilson's T3 moving average. This adaptivity was originally proposed by mladen on various forex forums. This is considered experimental but shows how to use r-squared adapting methods to moving averages. In theory, the T3 is a six-pole non-linear Kalman filter.
What is the T3 moving average?
Better Moving Averages Tim Tillson
November 1, 1998
Tim Tillson is a software project manager at Hewlett-Packard, with degrees in Mathematics and Computer Science. He has privately traded options and equities for 15 years.
Introduction
"Digital filtering includes the process of smoothing, predicting, differentiating, integrating, separation of signals, and removal of noise from a signal. Thus many people who do such things are actually using digital filters without realizing that they are; being unacquainted with the theory, they neither understand what they have done nor the possibilities of what they might have done."
This quote from R. W. Hamming applies to the vast majority of indicators in technical analysis. Moving averages, be they simple, weighted, or exponential, are lowpass filters; low frequency components in the signal pass through with little attenuation, while high frequencies are severely reduced.
"Oscillator" type indicators (such as MACD, Momentum, Relative Strength Index) are another type of digital filter called a differentiator.
Tushar Chande has observed that many popular oscillators are highly correlated, which is sensible because they are trying to measure the rate of change of the underlying time series, i.e., are trying to be the first and second derivatives we all learned about in Calculus.
We use moving averages (lowpass filters) in technical analysis to remove the random noise from a time series, to discern the underlying trend or to determine prices at which we will take action. A perfect moving average would have two attributes:
It would be smooth, not sensitive to random noise in the underlying time series. Another way of saying this is that its derivative would not spuriously alternate between positive and negative values.
It would not lag behind the time series it is computed from. Lag, of course, produces late buy or sell signals that kill profits.
The only way one can compute a perfect moving average is to have knowledge of the future, and if we had that, we would buy one lottery ticket a week rather than trade!
Having said this, we can still improve on the conventional simple, weighted, or exponential moving averages. Here's how:
Two Interesting Moving Averages
We will examine two benchmark moving averages based on Linear Regression analysis.
In both cases, a Linear Regression line of length n is fitted to price data.
I call the first moving average ILRS, which stands for Integral of Linear Regression Slope. One simply integrates the slope of a linear regression line as it is successively fitted in a moving window of length n across the data, with the constant of integration being a simple moving average of the first n points. Put another way, the derivative of ILRS is the linear regression slope. Note that ILRS is not the same as a SMA (simple moving average) of length n, which is actually the midpoint of the linear regression line as it moves across the data.
We can measure the lag of moving averages with respect to a linear trend by computing how they behave when the input is a line with unit slope. Both SMA(n) and ILRS(n) have lag of n/2, but ILRS is much smoother than SMA.
Our second benchmark moving average is well known, called EPMA or End Point Moving Average. It is the endpoint of the linear regression line of length n as it is fitted across the data. EPMA hugs the data more closely than a simple or exponential moving average of the same length. The price we pay for this is that it is much noisier (less smooth) than ILRS, and it also has the annoying property that it overshoots the data when linear trends are present.
However, EPMA has a lag of 0 with respect to linear input! This makes sense because a linear regression line will fit linear input perfectly, and the endpoint of the LR line will be on the input line.
These two moving averages frame the tradeoffs that we are facing. On one extreme we have ILRS, which is very smooth and has considerable phase lag. EPMA has 0 phase lag, but is too noisy and overshoots. We would like to construct a better moving average which is as smooth as ILRS, but runs closer to where EPMA lies, without the overshoot.
A easy way to attempt this is to split the difference, i.e. use (ILRS(n)+EPMA(n))/2. This will give us a moving average (call it IE/2) which runs in between the two, has phase lag of n/4 but still inherits considerable noise from EPMA. IE/2 is inspirational, however. Can we build something that is comparable, but smoother? Figure 1 shows ILRS, EPMA, and IE/2.
Filter Techniques
Any thoughtful student of filter theory (or resolute experimenter) will have noticed that you can improve the smoothness of a filter by running it through itself multiple times, at the cost of increasing phase lag.
There is a complementary technique (called twicing by J.W. Tukey) which can be used to improve phase lag. If L stands for the operation of running data through a low pass filter, then twicing can be described by:
L' = L(time series) + L(time series - L(time series))
That is, we add a moving average of the difference between the input and the moving average to the moving average. This is algebraically equivalent to:
2L-L(L)
This is the Double Exponential Moving Average or DEMA, popularized by Patrick Mulloy in TASAC (January/February 1994).
In our taxonomy, DEMA has some phase lag (although it exponentially approaches 0) and is somewhat noisy, comparable to IE/2 indicator.
We will use these two techniques to construct our better moving average, after we explore the first one a little more closely.
Fixing Overshoot
An n-day EMA has smoothing constant alpha=2/(n+1) and a lag of (n-1)/2.
Thus EMA(3) has lag 1, and EMA(11) has lag 5. Figure 2 shows that, if I am willing to incur 5 days of lag, I get a smoother moving average if I run EMA(3) through itself 5 times than if I just take EMA(11) once.
This suggests that if EPMA and DEMA have 0 or low lag, why not run fast versions (eg DEMA(3)) through themselves many times to achieve a smooth result? The problem is that multiple runs though these filters increase their tendency to overshoot the data, giving an unusable result. This is because the amplitude response of DEMA and EPMA is greater than 1 at certain frequencies, giving a gain of much greater than 1 at these frequencies when run though themselves multiple times. Figure 3 shows DEMA(7) and EPMA(7) run through themselves 3 times. DEMA^3 has serious overshoot, and EPMA^3 is terrible.
The solution to the overshoot problem is to recall what we are doing with twicing:
DEMA(n) = EMA(n) + EMA(time series - EMA(n))
The second term is adding, in effect, a smooth version of the derivative to the EMA to achieve DEMA. The derivative term determines how hot the moving average's response to linear trends will be. We need to simply turn down the volume to achieve our basic building block:
EMA(n) + EMA(time series - EMA(n))*.7;
This is algebraically the same as:
EMA(n)*1.7-EMA(EMA(n))*.7;
I have chosen .7 as my volume factor, but the general formula (which I call "Generalized Dema") is:
GD(n,v) = EMA(n)*(1+v)-EMA(EMA(n))*v,
Where v ranges between 0 and 1. When v=0, GD is just an EMA, and when v=1, GD is DEMA. In between, GD is a cooler DEMA. By using a value for v less than 1 (I like .7), we cure the multiple DEMA overshoot problem, at the cost of accepting some additional phase delay. Now we can run GD through itself multiple times to define a new, smoother moving average T3 that does not overshoot the data:
T3(n) = GD(GD(GD(n)))
In filter theory parlance, T3 is a six-pole non-linear Kalman filter. Kalman filters are ones which use the error (in this case (time series - EMA(n)) to correct themselves. In Technical Analysis, these are called Adaptive Moving Averages; they track the time series more aggressively when it is making large moves.
Included:
Bar coloring
Signals
Alerts
Loxx's Expanded Source Types